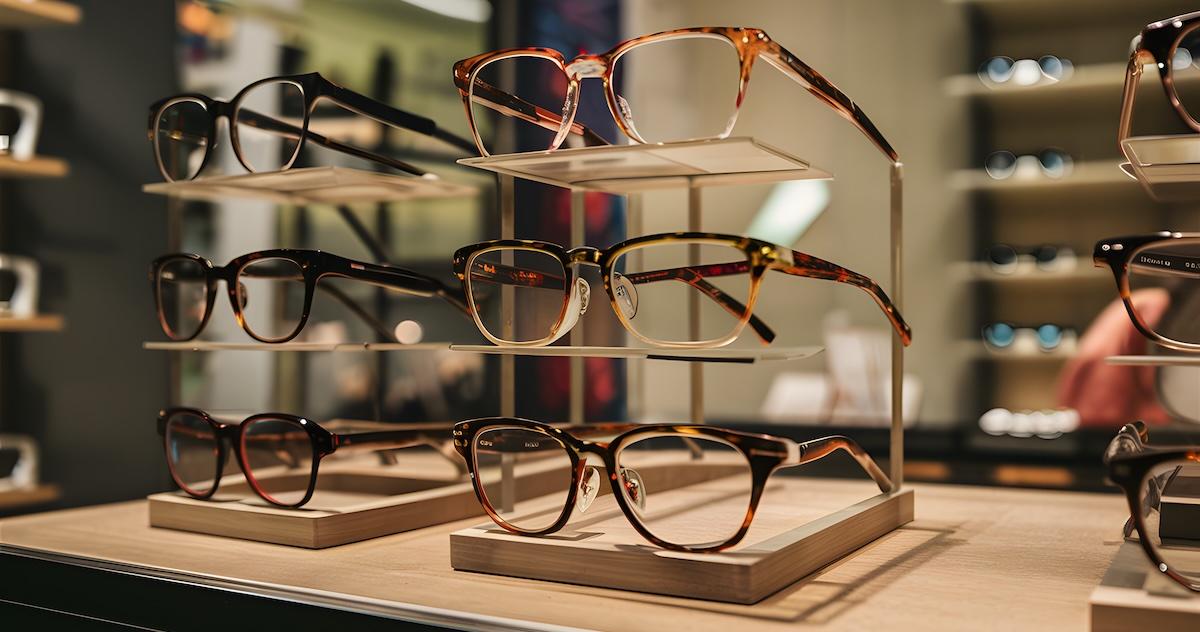
Your Quick Overview of Kate Spade’s 2Q16 Results and Stock Market Performance
Nov. 20 2020, Updated 3:05 p.m. ET
Summary of Kate Spade’s 2Q16 results
Kate Spade (KATE) reported weaker-than-expected 2Q16 results on August 3, 2016, recording EPS (earnings per share) of $0.11, as compared to the estimate of $0.14 by Wall Street analysts.
The company’s same-store sales growth fell abruptly to 4%, as compared to its average of 16% during the three previous quarters. Kate’s management cited weaker tourism, a quicker-than-expected transition to a newer handbag style, Cameron Street, and a novelty sales slump in June. The management also cited the extremely promotional retail environment as a key reason for Kate’s weaker results.
As a result of its second-quarter headwinds, Kate lowered its full-year outlook. Its sales guidance was revised to the $1.37 billion–$1.4 billion range, as compared to the $1.39 billion–$1.41 billion range guided earlier. EPS expectations were also lowered to the $0.63–$0.70 band, as compared to the previous $0.70–$0.80 range.
Kate has been penalized for its 2Q16 results
Kate Spade’s stock was heavily penalized by the market after missing its expectations. The share price fell a whopping 18.2% on the day of the earnings release, and though the stock has risen more than 12% since then, it still trades below the pre-earnings level.
As of September 13, 2016, Kate is trading 30% below its 52-week high price. Kate’s YTD (year-to-date) performance is weaker than that of close competitors Michael Kors (KORS) and Coach (COH). While Kate’s stock has gained 3.4% YTD, KORS and COH are looking at YTD gains of ~18% and ~8%, respectively. PVH Corporation (PVH), the best-performing apparel company, has seen YTD gains of more than 45%.
ETF investors seeking to add exposure to Kate Spade can consider the iShares S&P Mid-Cap 400 Value ETF (IJJ), which invests 0.18% of its portfolio in the company.
Read the next and final part of this series to know about recent analyst actions on other apparel companies.