iShares US Consumer Goods
Latest iShares US Consumer Goods News and Updates
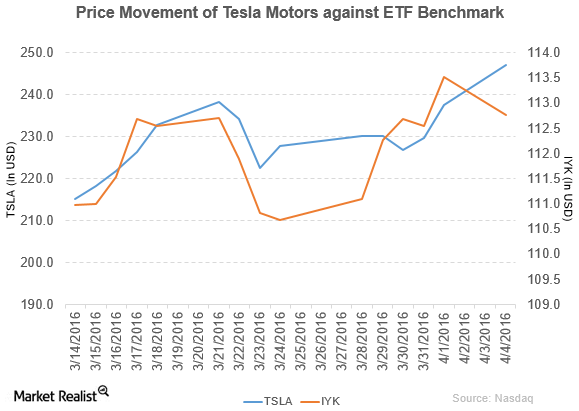
Tesla Motors Rose Due to Increased Orders for the Model 3 Sedan
Tesla Motors (TSLA) has a market cap of $31.5 billion. It rose by 4.0% and closed at $246.99 per share on April 4, 2016.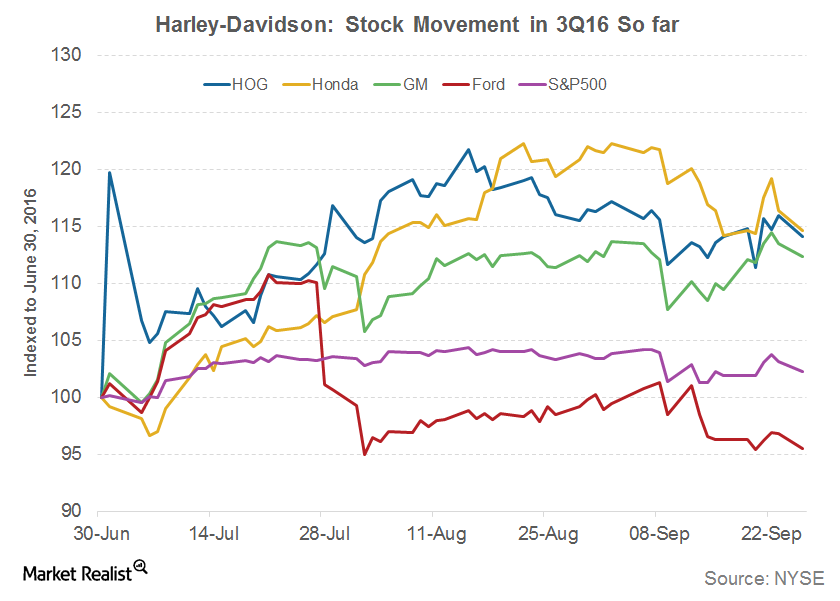
How Has Harley-Davidson Performed so Far in 3Q16?
Harley-Davidson is set to release its 3Q16 earnings report on October 18, 2016. The company is the most popular heavyweight motorcycle brand in the world.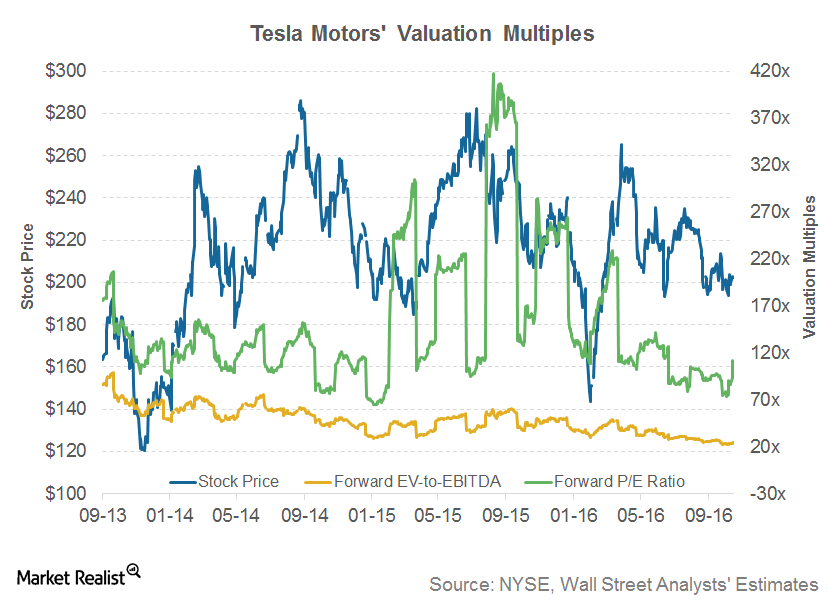
What Could Drive Tesla’s Valuation Multiples in 4Q16?
As of October 26, 2016, Tesla’s forward EV-to-EBITDA multiple was 26.4x.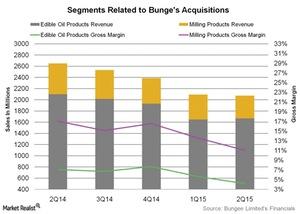
Will Bunge’s Acquisitions Help Revive Its Segment Margins?
Bunge North America, the North American operating segment of Bunge Limited (BG), announced that it had acquired Whole Harvest Foods.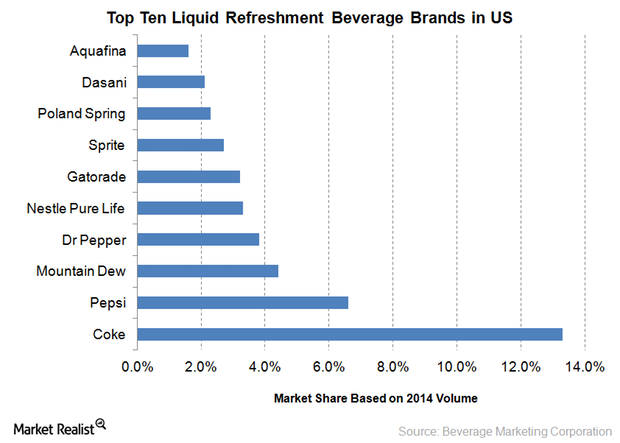
An Overview of the US Nonalcoholic Beverage Industry
The US nonalcoholic beverage market comprises categories like carbonated soft drinks, ready-to-drink tea and coffee, bottled water, sports drinks, and energy drinks.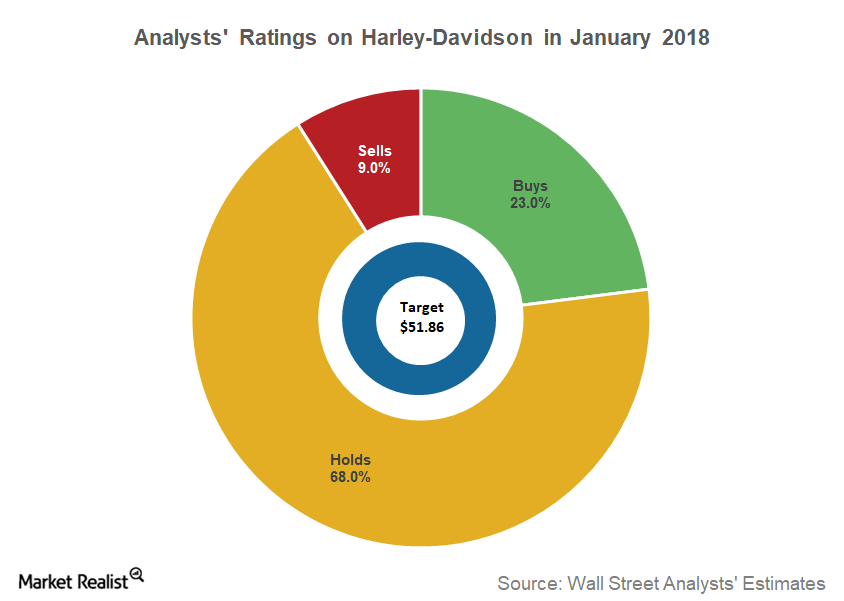
Analysts’ Recommendations on HOG before Its 4Q17 Results
According to data compiled by Reuters, 68% of analysts covering Harley-Davidson stock gave it “hold” recommendations.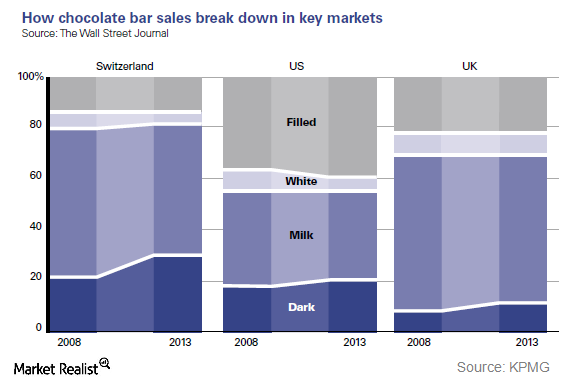
Analyzing Hershey’s Emphasis on Product Innovation
Hershey plans to position dark chocolate as a lifestyle choice in the US. It has thus begun promoting its dark chocolate brands for specific consumption.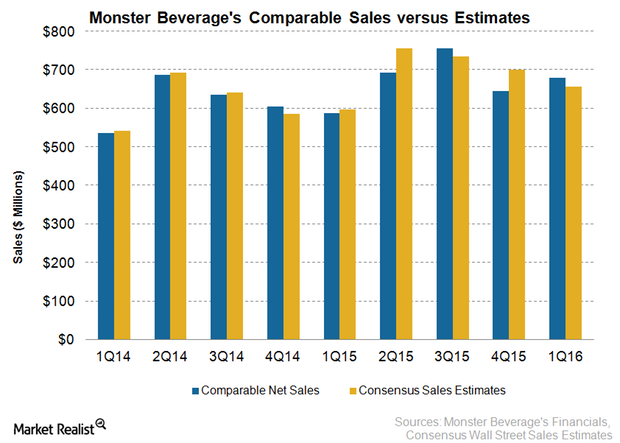
Monster’s 1Q16 Sales Benefit from Strategic Deal with Coca-Cola
Monster Beverage’s (MNST) net sales in 1Q16 ended March 31, 2016, were $680.2 million, ahead of the consensus analyst sales estimate of $656.9 million.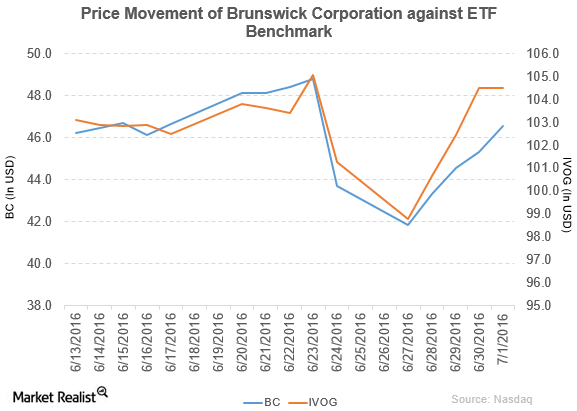
Why Did Brunswick Change Its Revolving Credit Facility?
Brunswick (BC) rose by 6.6% to close at $46.54 per share at the end of the fifth week of June 2016.
Overview of Nike Earnings, Leverage, and Valuation
Nike (NKE) has a positive earnings surprise history. In simple terms, the company has beat Wall Street’s earnings estimates in the past several quarters.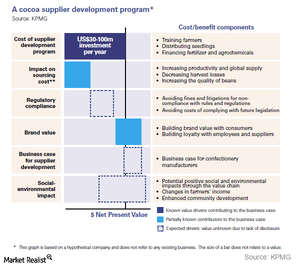
Hershey’s Steps to Improve Suppliers Productivity and Conscious Sourcing
Hershey has set a goal of sourcing 100% cocoa from certified cocoa farms. In fiscal 2014, it sourced 30% certified cocoa.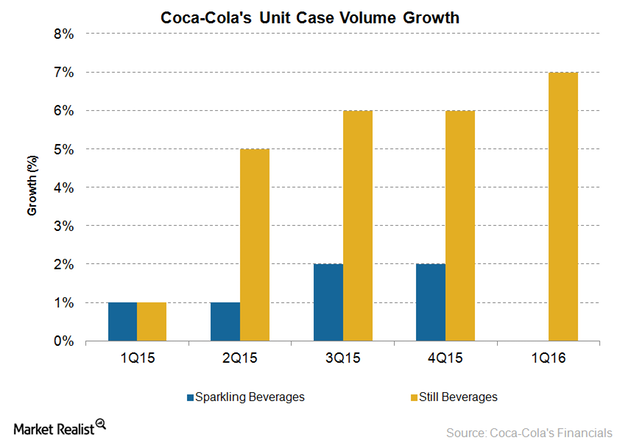
The Growing Emphasis of Coca-Cola and Peers on Still Beverages
Another plant-based beverage acquisition made by Coca-Cola was that of Xiamen Culiangwang Beverage Technology Company in 2015.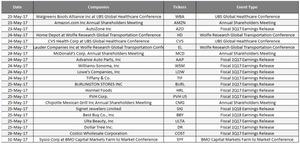
The Week Ahead: Key Dates in Consumer from May 22–26, 2017
In this part of the series, we’ll look at the important events for the week ahead, from May 22–26, 2017.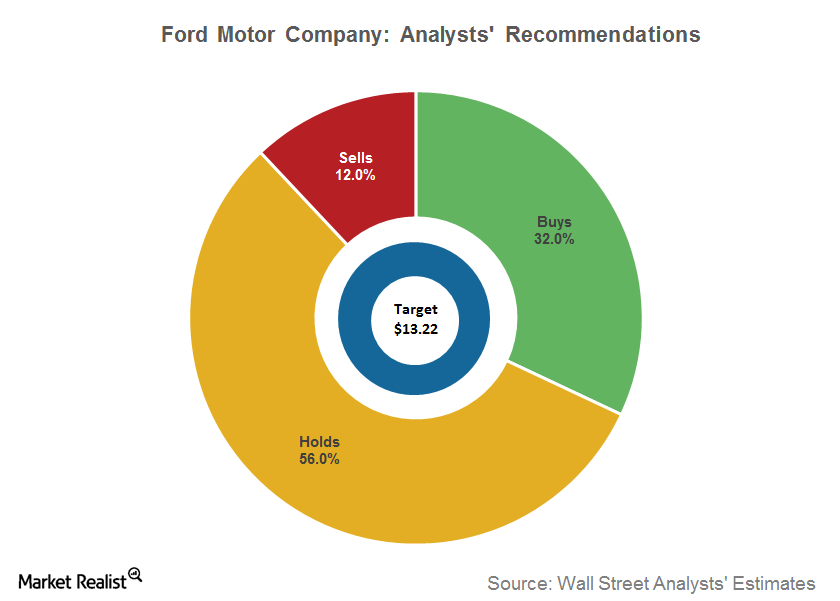
What Are Analysts’ Recommendations for Ford?
According to the latest Bloomberg consensus, 32% of analysts covering Ford rated it as a “buy,” 56% rated it as a “hold,” and three rated it as a “sell.”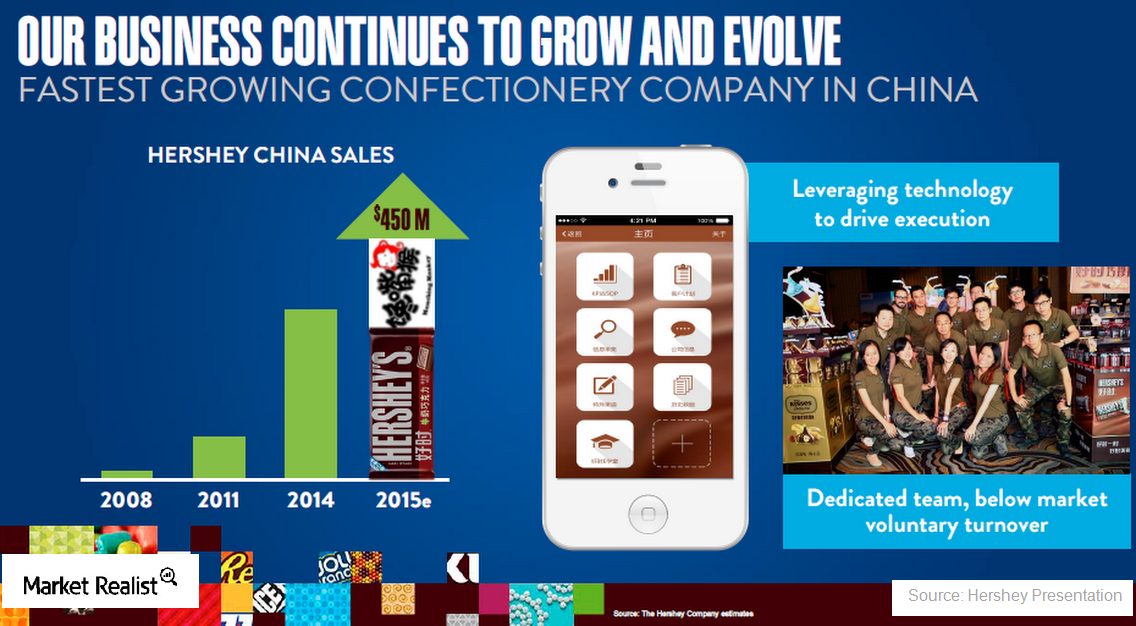
Why China Is Such an Important Market for Hershey in 2015
Hershey is the fastest-growing confectionery company in China, and Hershey expects China to become its second-largest market behind the US by 2017.
US Truck Sales Jumped Nearly 16% in March 2018
According to the data compiled by Autodata, March 2018 US auto sales stood at 1.7 million vehicle units.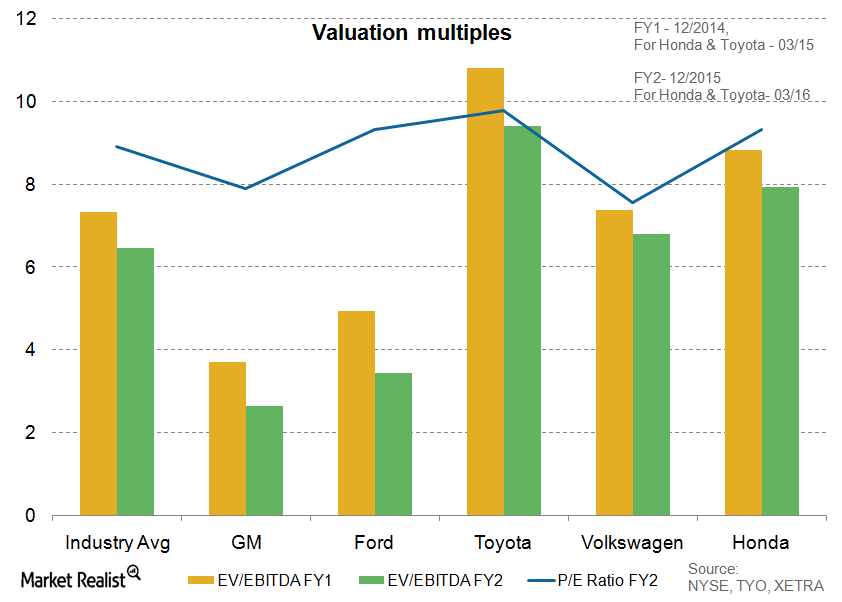
Must-know: Top auto industry ETFs for investors
The First Trust NASDAQ Global Auto ETF (CARZ) is the most traded auto-focused ETF. The three-year return for the ETF is 48.32%. YTD, CARZ provided a return of 2.23%.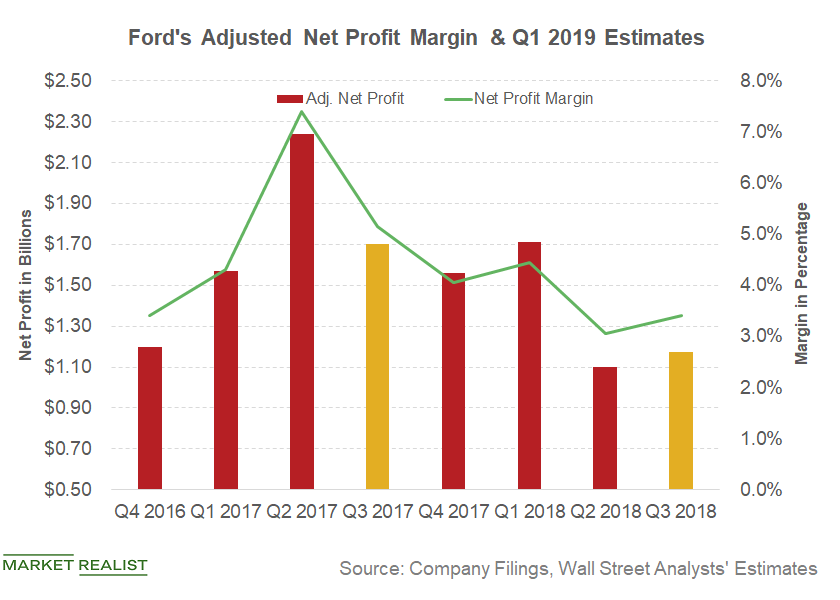
Could Ford’s Profit Margins Improve in Q1 2019?
In the fourth quarter of 2018, Ford (F) reported automotive segment EBIT (earnings before interest and taxes) of $1.1 billion, down 31.3% YoY.
What to Expect for Harley-Davidson’s Q1 Profit Margin
In the fourth quarter, Harley-Davidson’s (HOG) gross profit from motorcycles and related products fell ~17.5% YoY (year-over-year) to $564 million from $320 million, reducing the segment’s gross margin YoY to 27.6% from 30.6%.
Can General Motors Improve Its Profit Margins in 2019?
In 2018, a positive mix helped General Motors (GM) boost its revenue despite its declining sales volumes.
Analyzing the Recent Trend in GM’s Revenue
In the fourth quarter of 2018, General Motors’ (GM) revenue rose 1.8% YoY (year-over-year) to $38.4 billion.
Analyzing Tesla’s Revenue Beat in Q4 2018
In the fourth quarter, Tesla delivered 90,966 car units to customers with a huge 203.6 YoY increase.
Is GM’s Dropping Global Market Share a Concern?
In the third quarter, General Motors’ (GM) global market share fell to 8.6% from 10.0% in the third quarter of 2017.
Vehicle Sales in China: May Was Strong
According to the China Association of Automobile Manufacturers, vehicle sales in China were 2.29 million units in May, a 9.6% rise YoY.
Comparing the Auto Industry’s Valuation Multiples
Valuation multiples are often used by investors to compare auto companies similar in size or business nature.
How Foreign Automakers’ Stock Has Fared in March 2018
According to Autodata, US auto sales fell 2.4% year-over-year in February.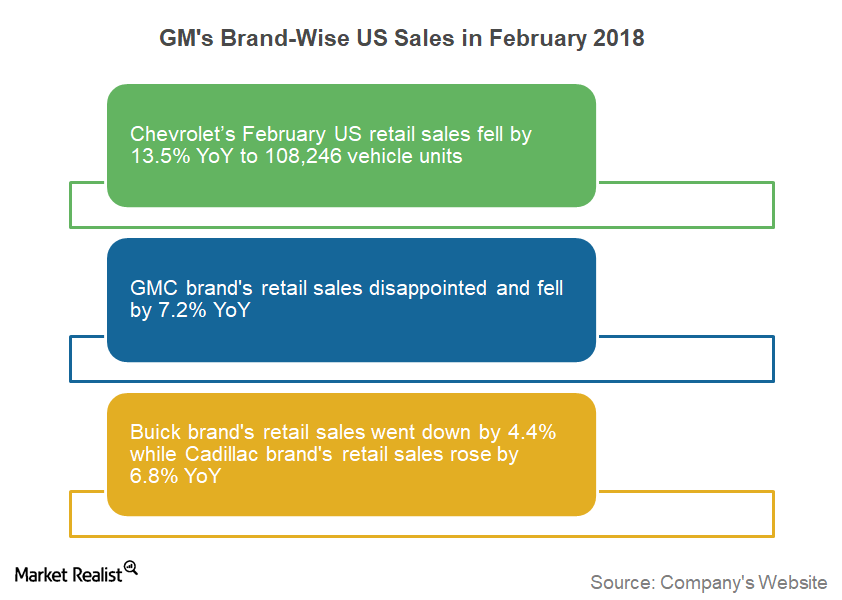
A Closer Look at GM’s US Sales by Brand in February 2018
In 2017, General Motors’ (GM) Chevrolet brand’s retail sales fell 1.0% YoY (year-over-year). Chevrolet’s total US sales also fell 1.5% YoY in the year.
Analyzing AutoZone’s Segment-Wise Performance in 2Q18
AutoZone’s business segments AutoZone’s (AZO) results are divided into two business segments: the DIY (Do-it-yourself) segment and the Commercial or DIFM (Do-it-for-me) segment. The DIY segment, which targets retail customers, yields wider margins than DIFM. Let’s take a look how these business segments performed in 2Q18 and AutoZone’s other key growth priorities. DIY segment in 2Q18 AutoZone’s […]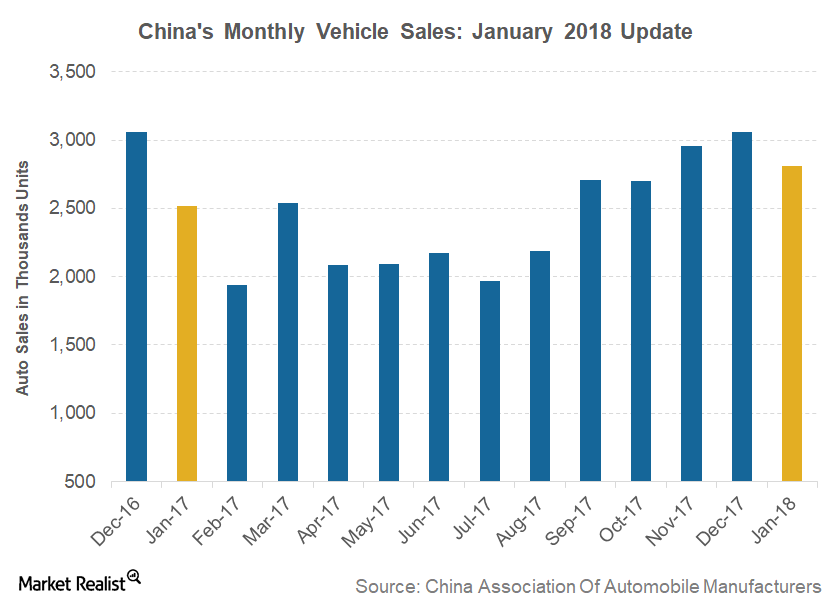
Comparing China and US Vehicle Sales in January 2018
In January 2018, total US auto sales rose about 1.0% YoY to 1.15 million vehicle units, reflecting a slower growth rate than China.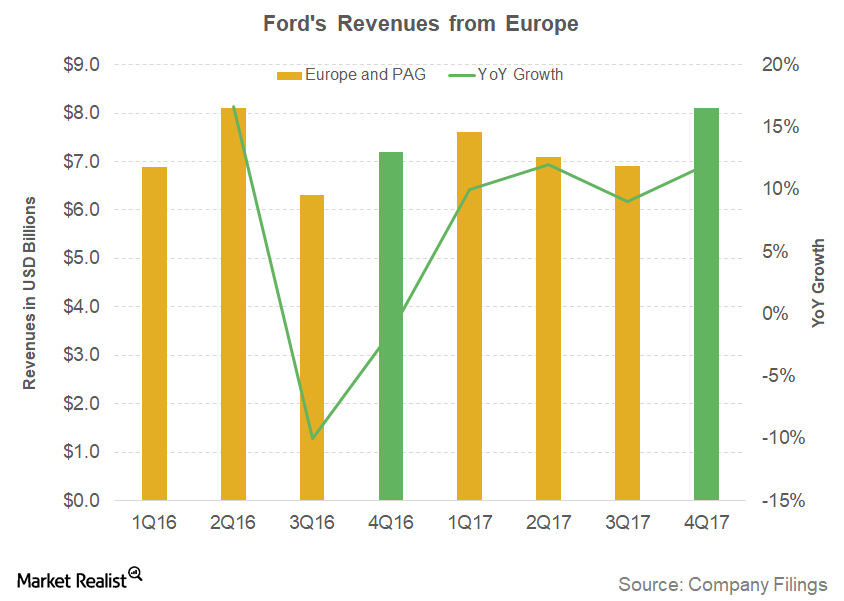
Why Couldn’t Ford Perform Well in Europe in 4Q17?
The company’s revenues from its largest market rose, but it couldn’t manage to post a stronger profitability from the region in the fourth quarter last year.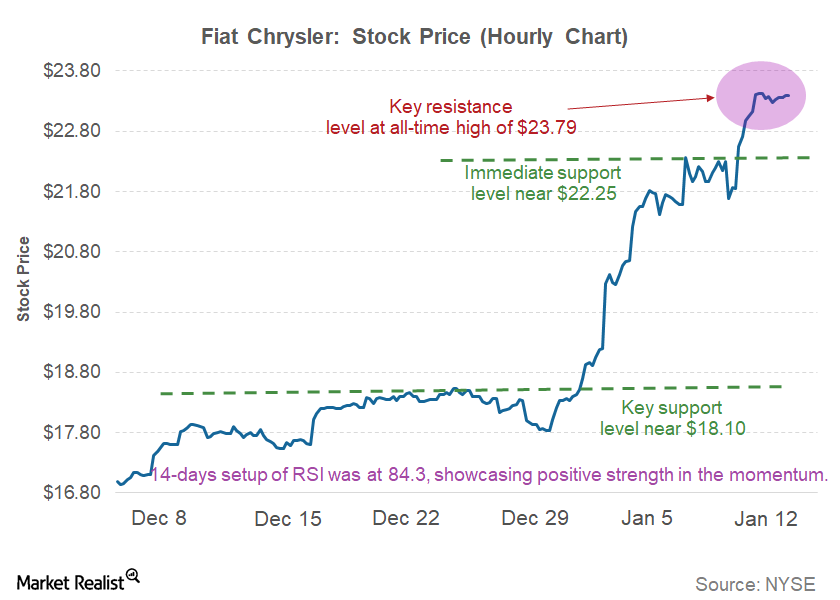
Fiat Chrysler Stock Began 2018 with a Bang after a Solid 2017
Last week, Fiat Chrysler stock (FCAU) continued to soar and posted solid weekly gains of 7.4%.
Why Toyota’s US Sales Continued to Drop in December 2017
In December 2017, Toyota Motor (TM), the largest Japanese automaker, reported an 8.3% year-over-year (or YoY) decrease in its US sales volume to 222,985 units.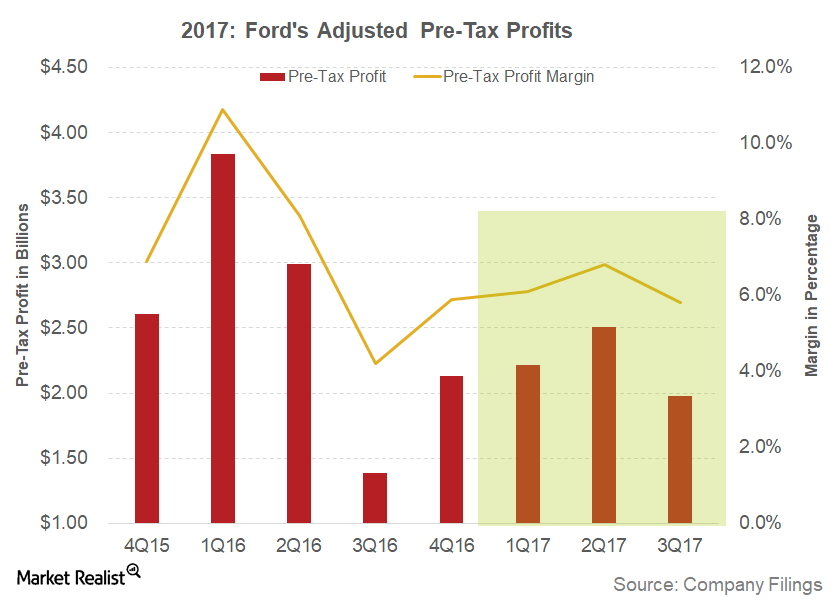
Key Factors Impacted Ford’s Profit Margins
In 1Q17, Ford reported a gross profit margin of 10.3%. It reflected weakness compared to the gross margin of 14.1% in the same quarter the previous year.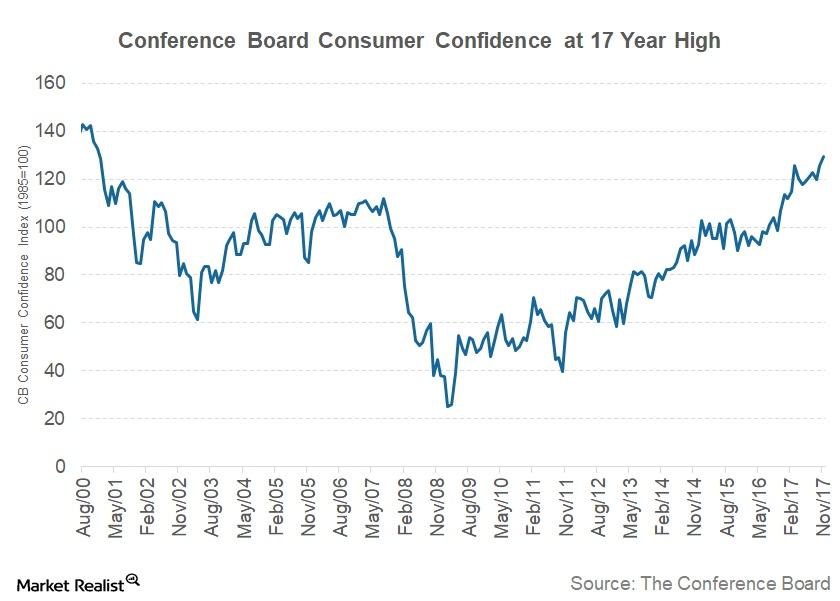
Conference Board Consumer Confidence Rose in November
The Conference Board Consumer Confidence Index for November came in at 129.5, up from 126.2 in October.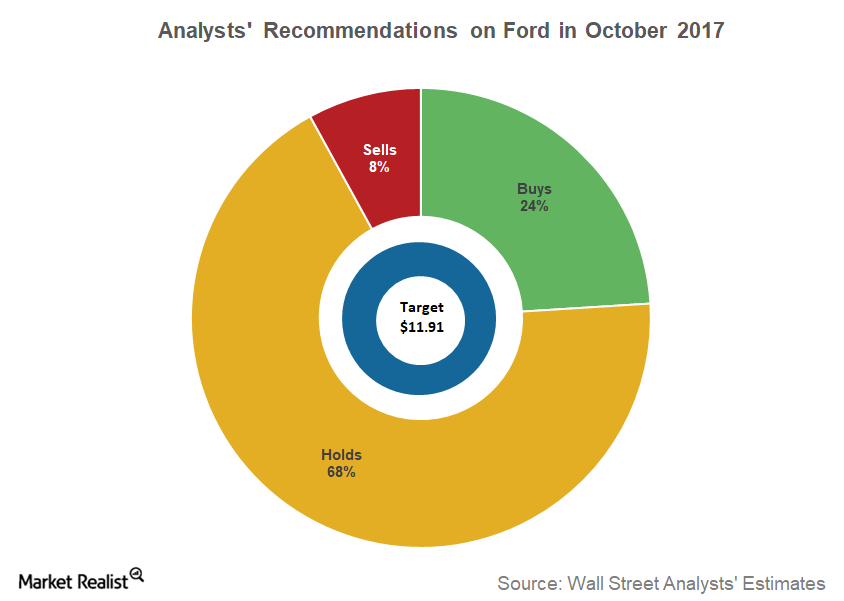
Why Many Analysts Aren’t Positive on Ford in October 2017
According to data compiled by Reuters as of October 11, 25% of analysts covering Ford (F) stock have given it a “buy” recommendation.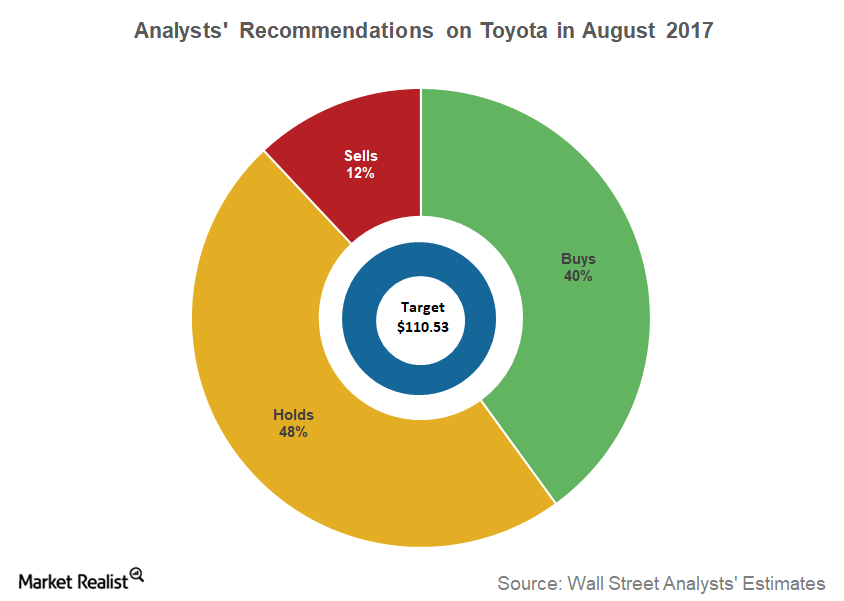
Analysts’ Recommendations for Toyota in August 2017
Toyota Toyota (TM) is the second-largest auto manufacturer in the world after Volkswagen (VLKAY), according to 2016 global auto sales data. In 2008, Toyota became the world’s largest automaker by volume, despite being founded much later than legacy US auto giants (IYK) General Motors (GM) and Ford Motor (F). Recommendations on Toyota According to recent data […]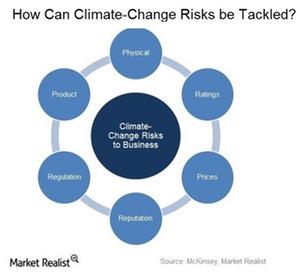
Can Green Bonds Provide a Potential Hedge against Climate Risk?
In this environment, green bonds could offer investors an option to hedge their portfolios against climate-related risk and enjoy a good risk-return profile.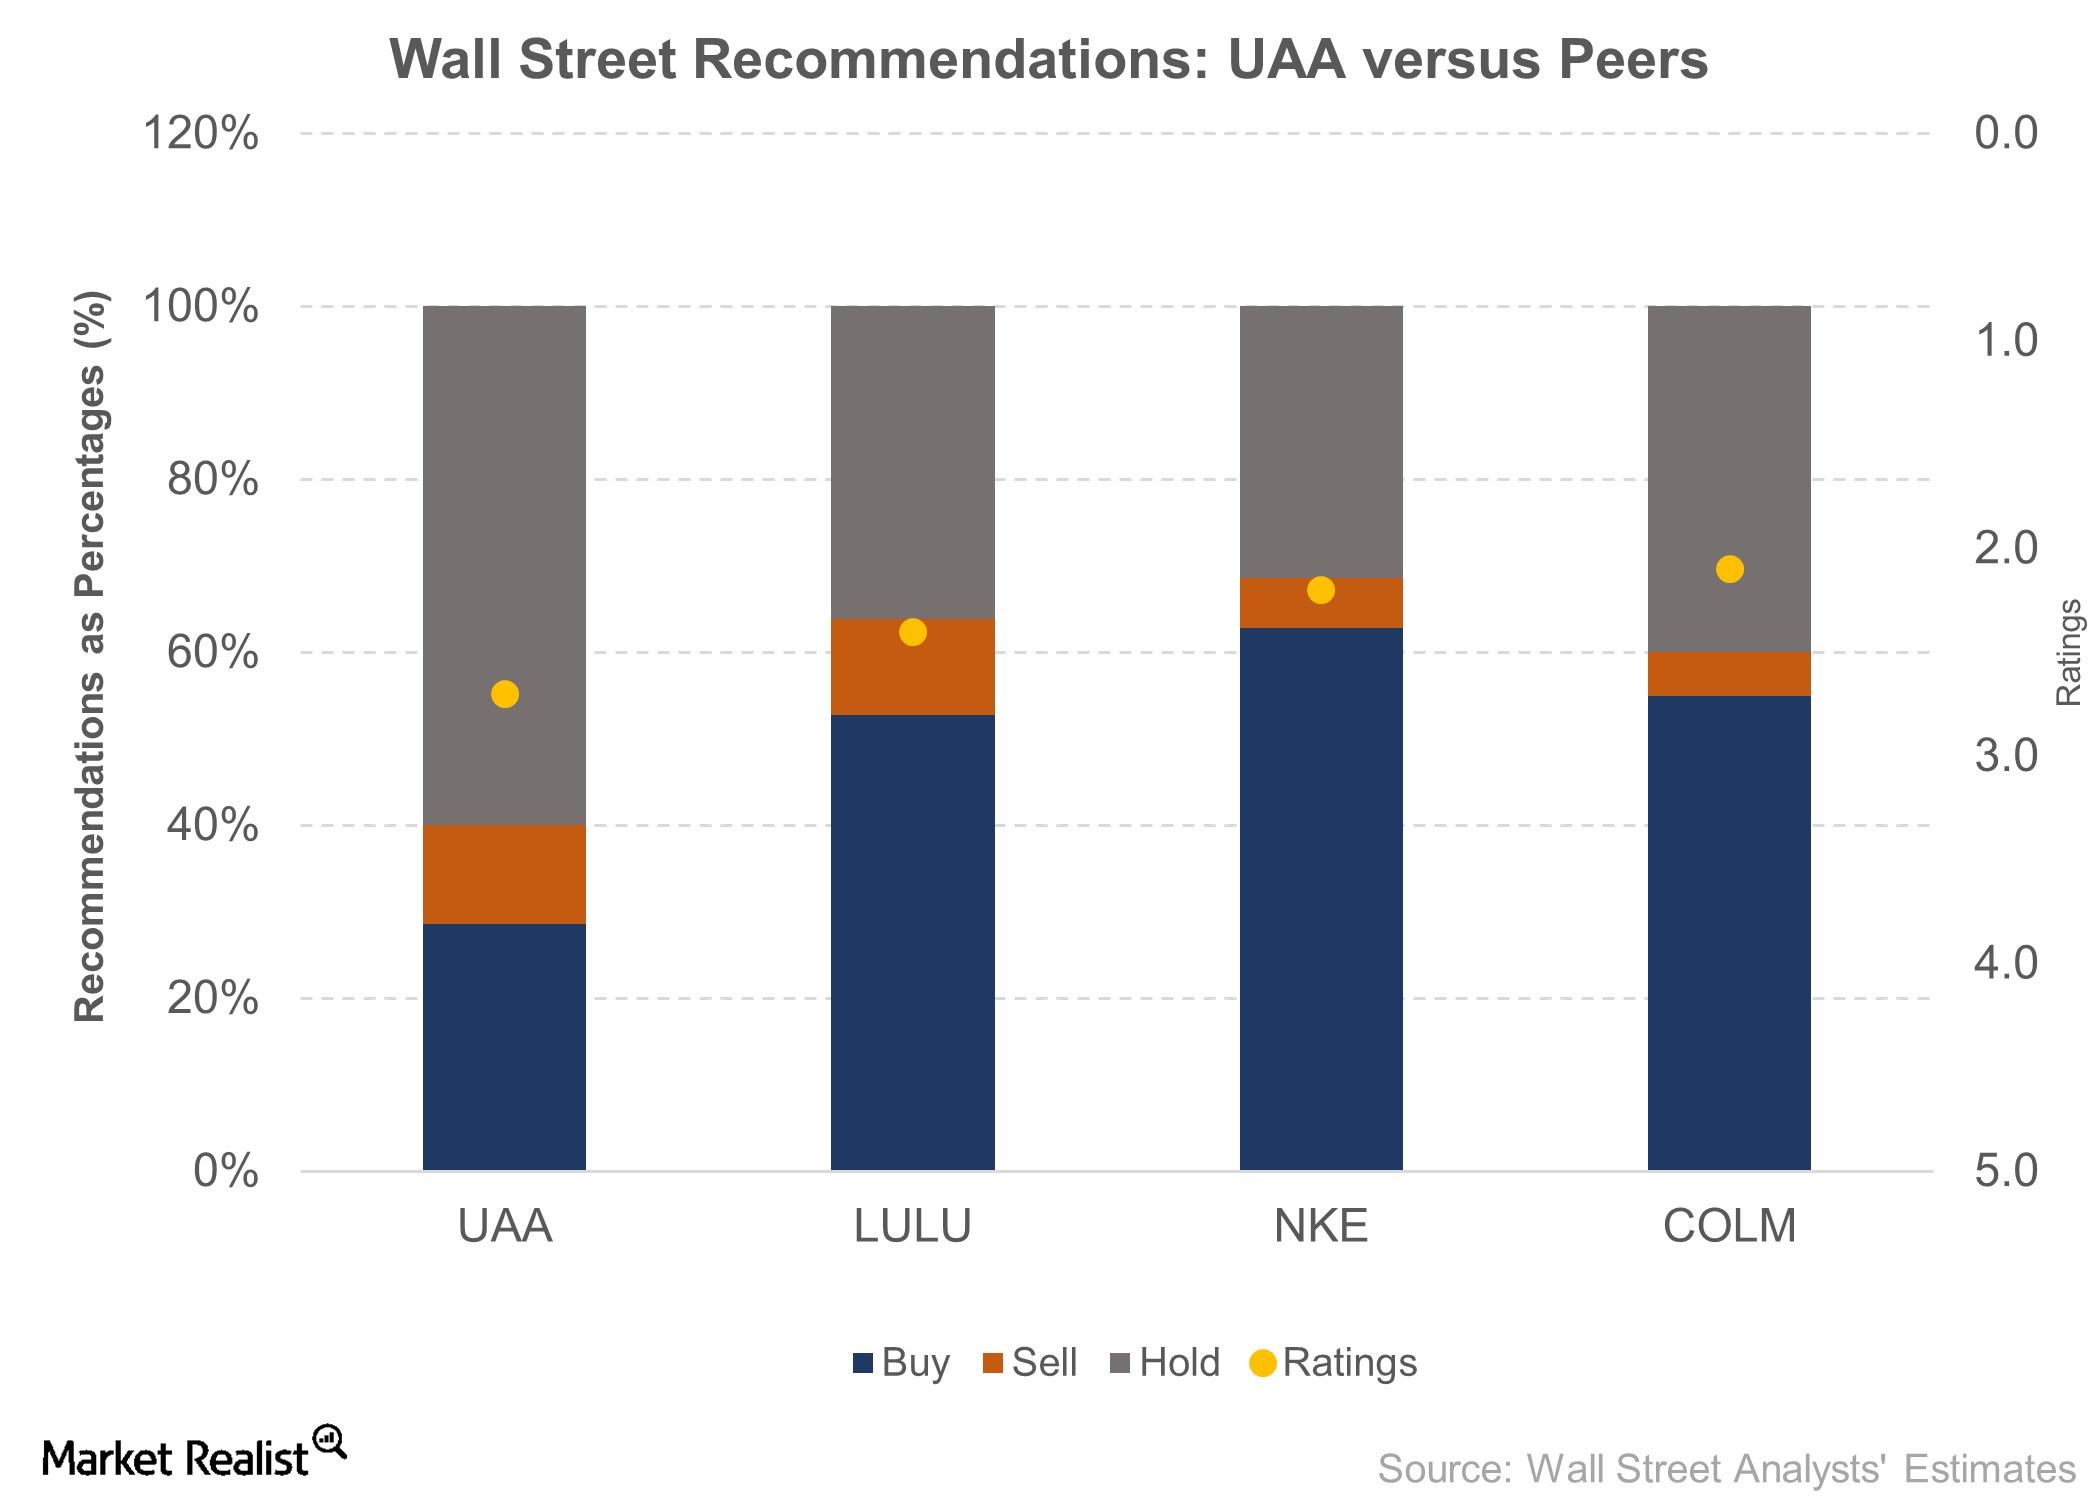
Under Armour Stock Lost 29% during the Week after Its 4Q16 Results
Under Armour (UAA), which is covered by 35 Wall Street analysts, has ten “buy” recommendations, four “sell” recommendations, and 21 “hold” recommendations.
Inside Ralph Lauren’s Fiscal 3Q17 Results
RL delivered better-than-expected earnings and in-line revenues, but its EPS fell 18% YoY to $1.86.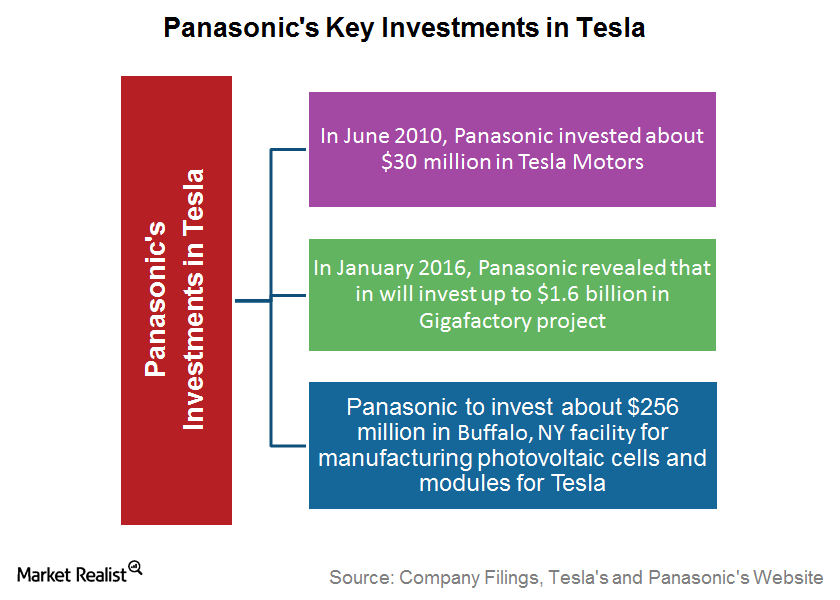
Why Is Tesla’s Association with Panasonic Important?
Tesla’s agreement with Panasonic for the solar energy business made it clear that their association isn’t just limited to cells and battery manufacturing.
Comparing General Motors and Ford’s Huge Pension Obligations
In the last six years, Ford contributed ~$12.9 billion to its pension funds. It’s the main reason why it has a better-funded status than General Motors.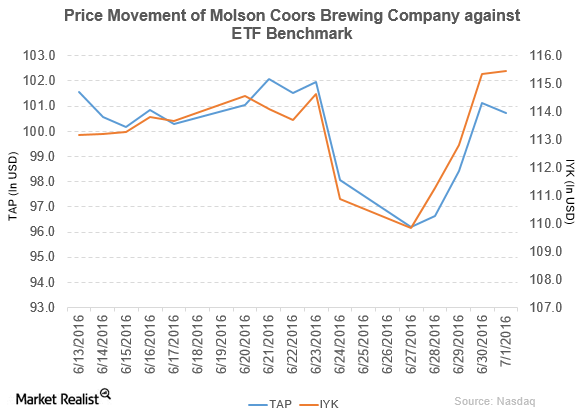
Moody’s Downgrades Molson Coors’ Senior Notes to ‘Baa3’
Molson Coors Brewing (TAP) rose by 2.7% to close at $100.74 per share at the end of the fifth week of June 2016.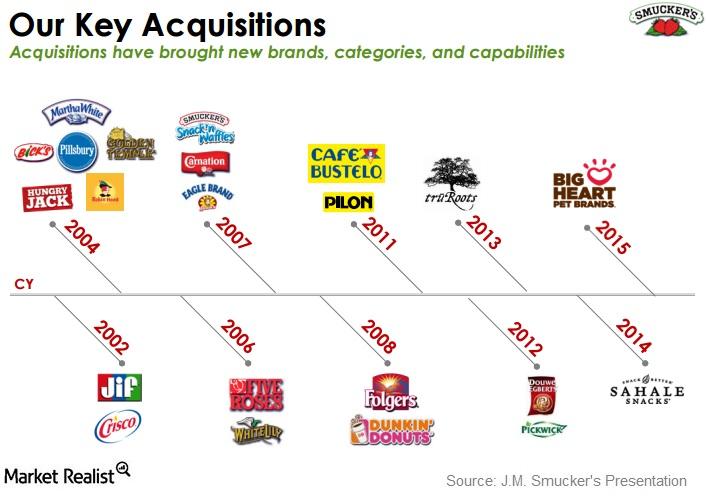
How Did Acquisitions and Innovations Lead J.M. Smucker’s Revenue?
The J.M. Smucker Company has made some key acquisitions since 2002. These acquisitions have brought in new brands, categories, and capabilities.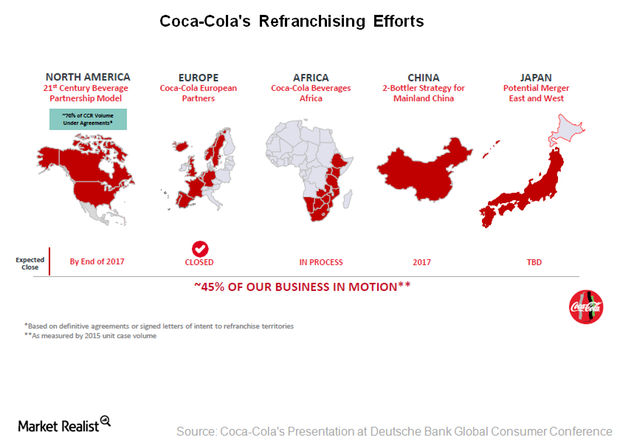
How Coca-Cola’s Refranchising Efforts Will Transform the Company
On June 15, the Coca-Cola Company (KO) announced a letter of intent to refranchise territories in most of the Memphis, Tennessee, market unit.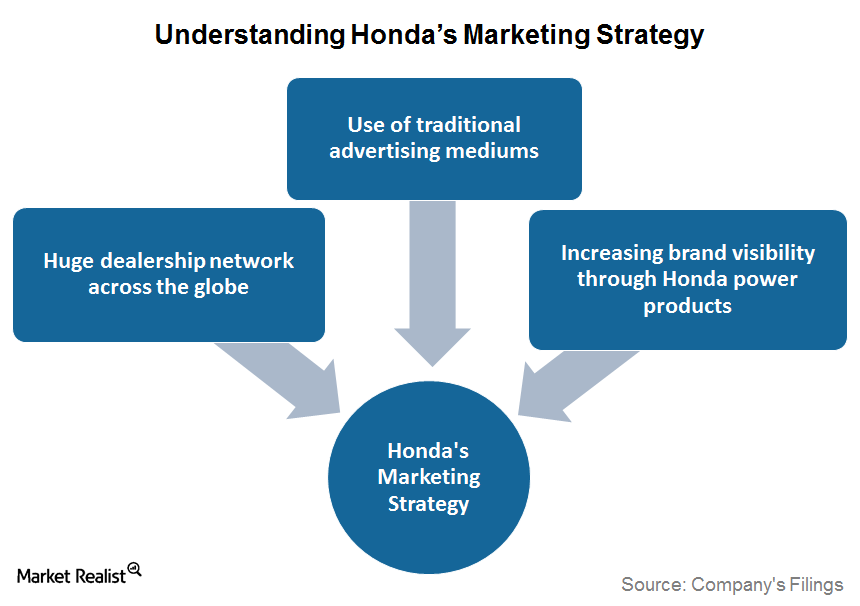
How Has Honda’s Marketing Strategy Helped It Grow?
Honda (HMC) markets its products through an extensive sales network in the US. This network comprises ~1,040 independent local dealers for motorcycles, ~1,310 for automobiles, and ~8,200 for power products.
Overview: The Beginning of Honda Motor Company
Honda Motor Company (HMC) is the second-largest Japanese automaker after Toyota and the world’s largest internal combustion engine manufacturer by volume. This series will help auto investors to become familiar with the key aspects of Honda’s business before investing in its stock and ADRs.
A Look at Toyota’s Key Leverage Ratios
At the end of most recent reported quarter, Toyota’s interest coverage ratio was 80.6x. This is far better than the GM’s interest coverage ratio of 15.6x and Ford’s ratio of 14.1x.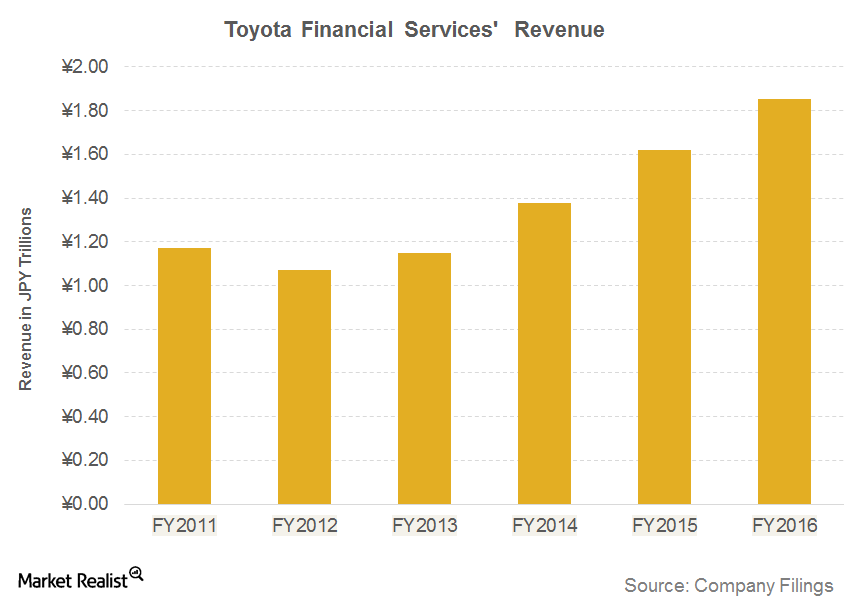
Toyota’s Financial Services Segment and Its Automotive Business
In the last five fiscal years, Toyota’s Financial Services’s revenues have grown by 73%. Rising revenues for the TFS segment reflects optimism in Toyota’s overall sales pattern.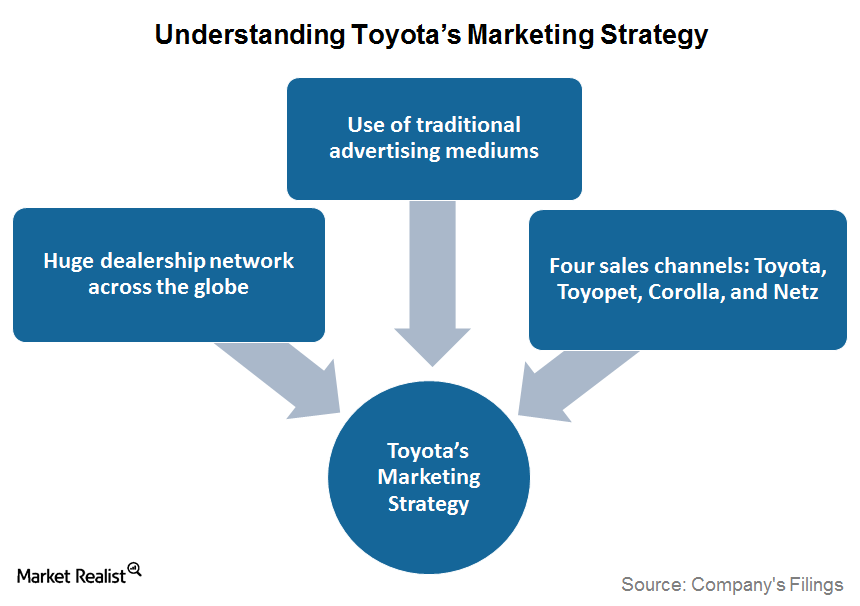
Understanding Toyota’s Marketing Strategy
Toyota (TM) has become one of the top ten biggest advertising spenders in the US. The company spent 435 billion Japanese yen, or 1.6% of its revenues, on advertising and sales promotions during fiscal 2015.
How Toyota Became the World’s Largest Automaker
Toyota established its US headquarters in 1982. It expanded into luxury cars in the 1980s, pickup trucks in the 1990s, and hybrids in the 2000s.
