Consumer Discret Sel Sect SPDR® ETF
Latest Consumer Discret Sel Sect SPDR® ETF News and Updates
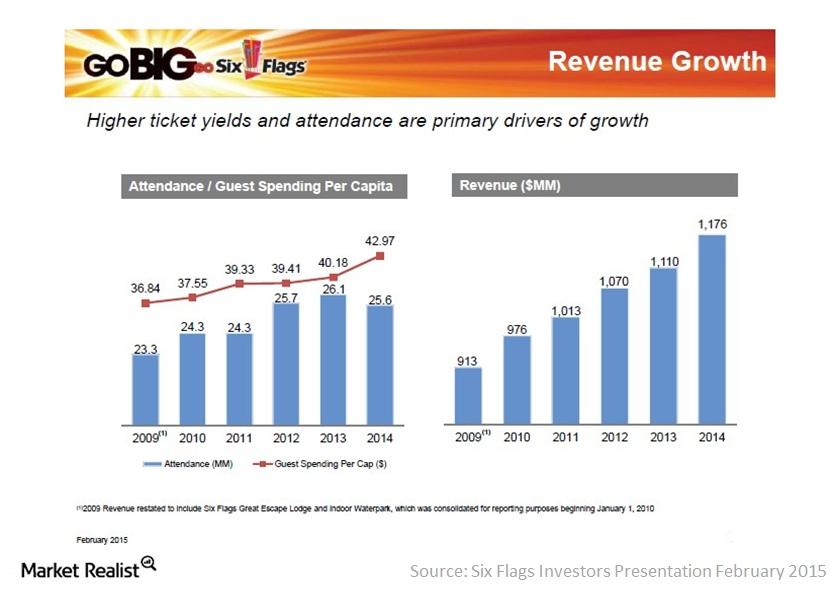
Why Six Flags’ guest spending per capita improved
Six Flags’ per capita guest spending increased $2.79, or 7%, to $42.97 in 2014, primarily due to improved admissions pricing and new offerings in the parks.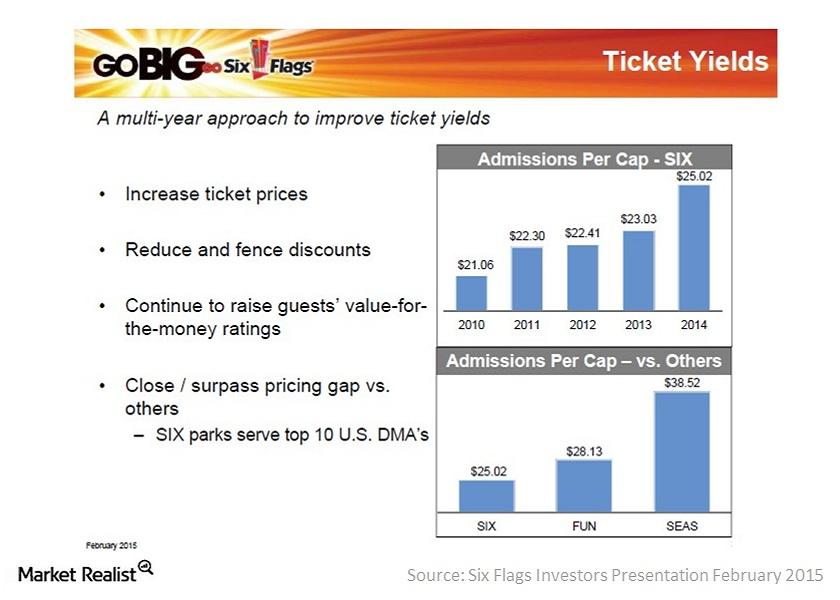
Ticket pricing pushes Six Flags’ admissions revenue up
Six Flags’ (SIX) admissions revenue per capita increased by 9% in 2014, primarily driven by pricing improvements on multi- and single-use ticket offerings.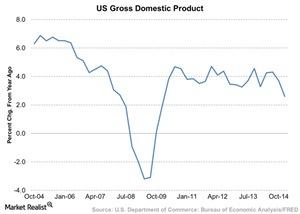
Why US Gross Domestic Product Growth Impacts Restaurants
The restaurant industry is part of the consumer discretionary sector. This sector does well when the economy is expanding.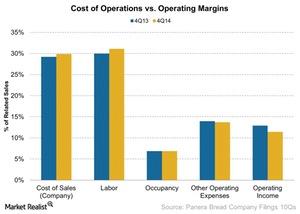
Panera Bread’s Cost Of Operations – Food Inflation And Labor
Labor expenses increased by 1.15% to 31.11% as a percentage of related sales from last year. The increase affected the company’s bakery operating margins.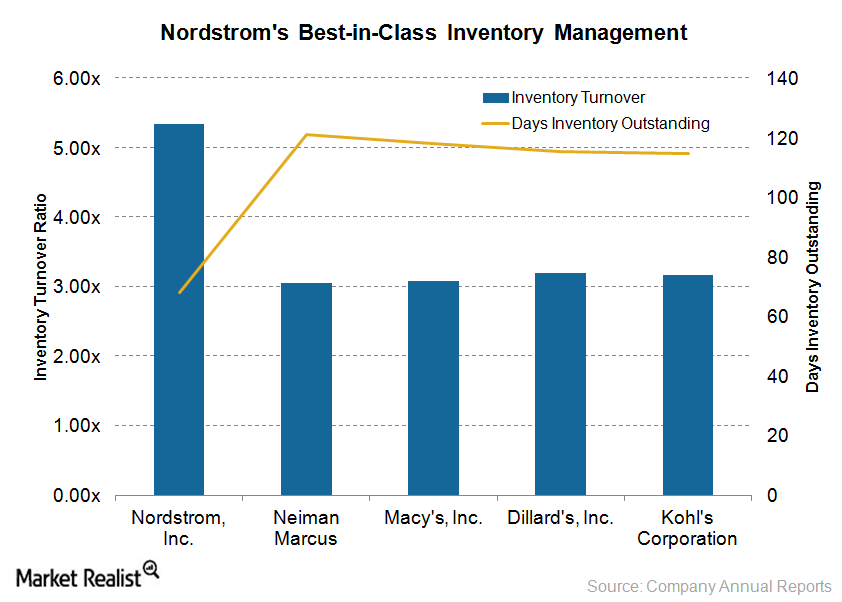
Nordstrom’s inventory management better than that of its peers
This article discusses Nordstrom’s inventory management in comparison to that of its industry peers.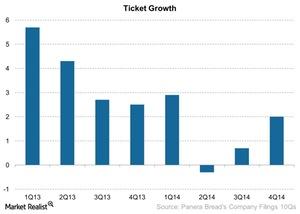
Panera Bread’s Traffic And Ticket Impact Same-Store Sales Growth
Traffic is the increase in the number of customers that visit the stores and make a transaction or purchase. Panera Bread’s traffic grew 1.3%.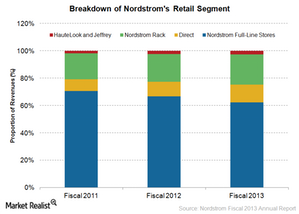
Understanding Nordstrom’s revenue streams
In fiscal 2013, the company’s Retail segment contributed 97% of Nordstrom’s revenues of $12.5 billion, while the Credit segment accounted for only 3%.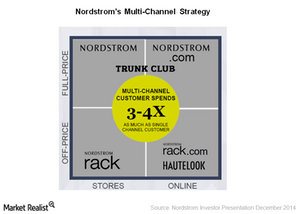
Nordstrom’s multichannel strategy, customer focus lead to success
Nordstrom’s multichannel strategy and best-in-class customer service have made the company famous.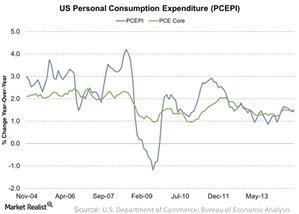
How Inflation Impacts The Restaurant Industry
Low inflation means low interest rates. This makes it affordable for restaurants to borrow and expand units.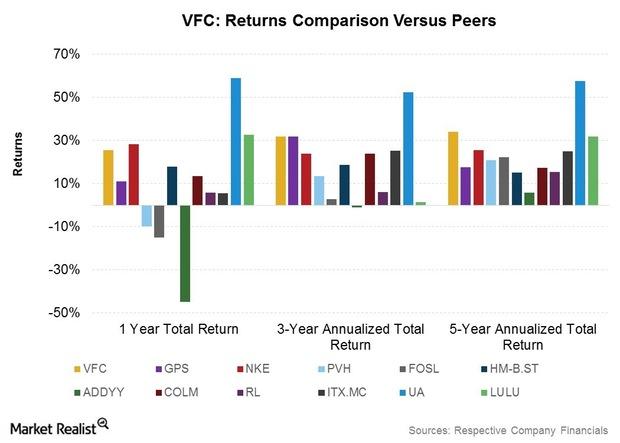
Shareholder Returns Analysis: Where VF Corp. Trumps Competitors
VFC’s total annualized returns to shareholders appear among the most consistent within its peer group for one-year, three-year, and five-year time periods.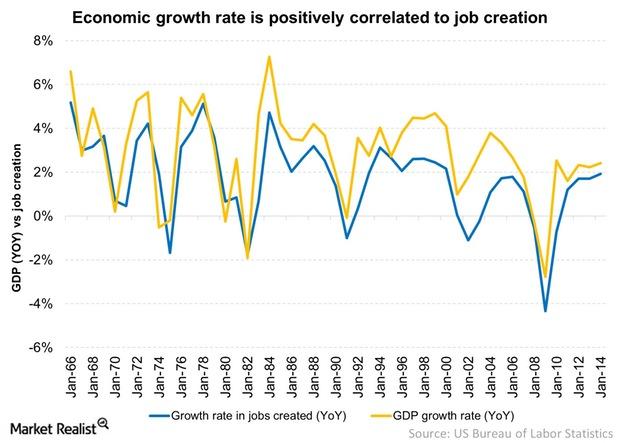
Why Job Creation And GDP Growth Go Hand-In-Hand
Job creation and GDP growth go hand-in-hand. The job markets and the economy tend to move in a similar pattern.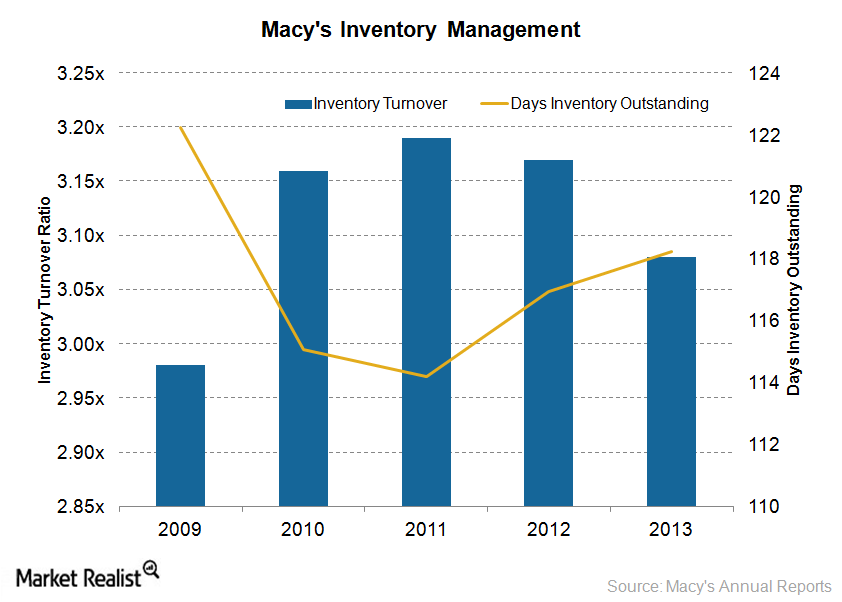
Macy’s works on inventory management: Will it improve sales?
Macy’s is taking measures to improve inventory management, including its My Macy’s program that customizes merchandise according to local preferences.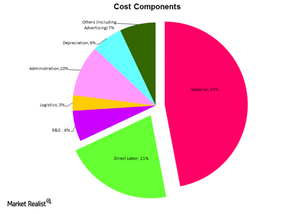
Raw materials – the biggest cost driver in the auto industry
Raw materials contribute about 47% to the cost of a vehicle. On average, an automobile is 47% steel, 8% iron, 8% plastic, 7% aluminum, and 3% glass.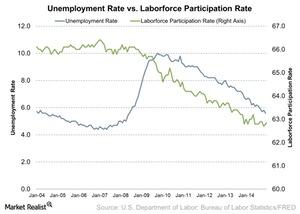
How Unemployment Rate, Labor Participation Affect Restaurants
The unemployment rate for December 2014 was 5.6%, showing a month-over-month decrease from 5.8% in November.
Macy’s target consumers: Do they make a difference?
Macy’s target consumers include Millennials. The company launched collections aimed at Millennials, including QMack, Maison Jules, and Bar III Carnaby.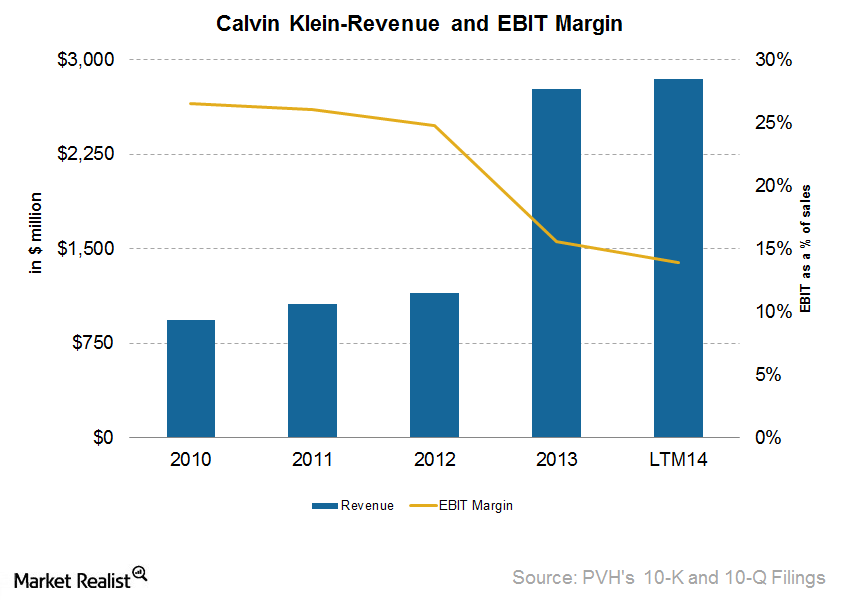
Calvin Klein’s financial performance and growth opportunities
Calvin Klein’s North American operations had a 2% increase in same-store sales growth. However, the international operations decreased by 4%.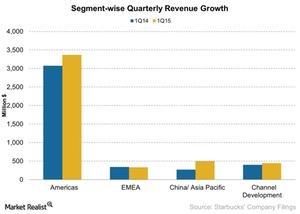
Starbucks China and Asia-Pacific Segment Reports Record Sales
The Starbucks China and Asia-Pacific segment grew 85% to $495 million, up from $266 million year-over-year.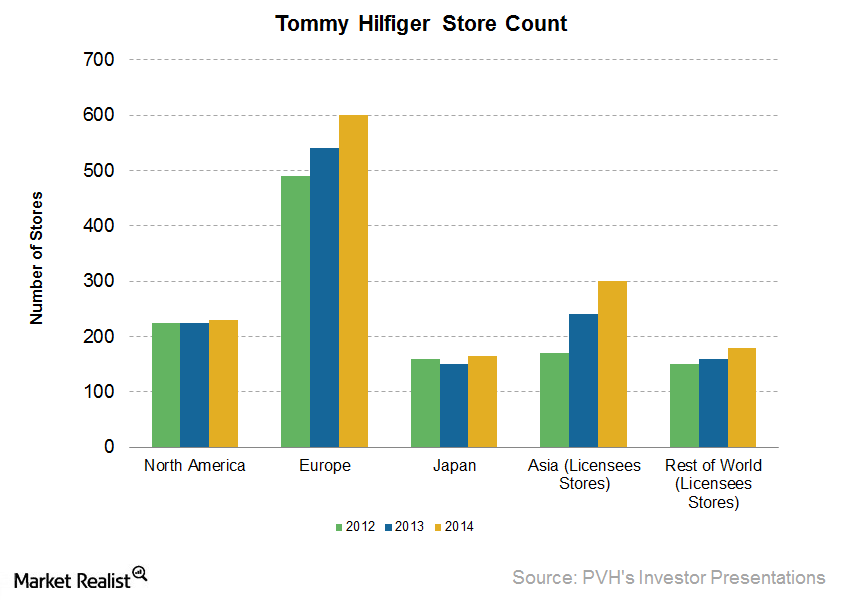
Tommy Hilfiger—the proven lifestyle brand
Tommy Hilfiger was founded in 1985. Along with Calvin Klein, it’s one of PVH’s two flagship brands. For 2013, Tommy Hilfiger’s global retail sales were $6.4 billion.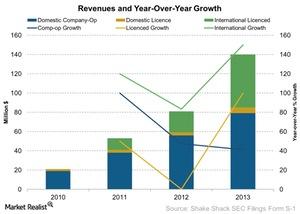
Where Does Shake Shack Get Its Revenue Sources?
Domestic means all of the restaurants in Shake Shack’s domestic market—the US. Revenue from this segment was $78.5 million in 2013.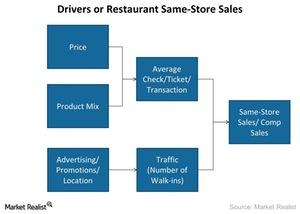
Why Should You Care About Shake Shack’s AUV?
Shake Shack (SHAK) calculates its AUV (average unit volume) by dividing the total company-operated sales by the total company-operated units.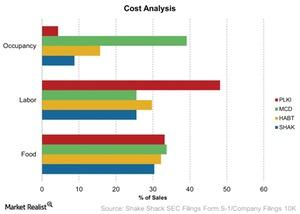
Understanding Shake Shack’s Three Key Costs
We’ve looked at Shake Shack’s (SHAK) revenues and drivers. It’s also important to understand how the company has been managing its key costs.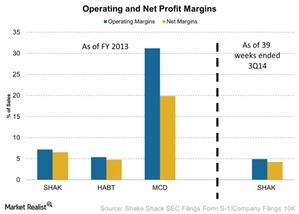
Analyzing Shake Shack’s Profitability
We’ll look at Shake Shack’s profitability in terms of its operating and net profit margins. In 2013, it had an operating profit of $5.9 million.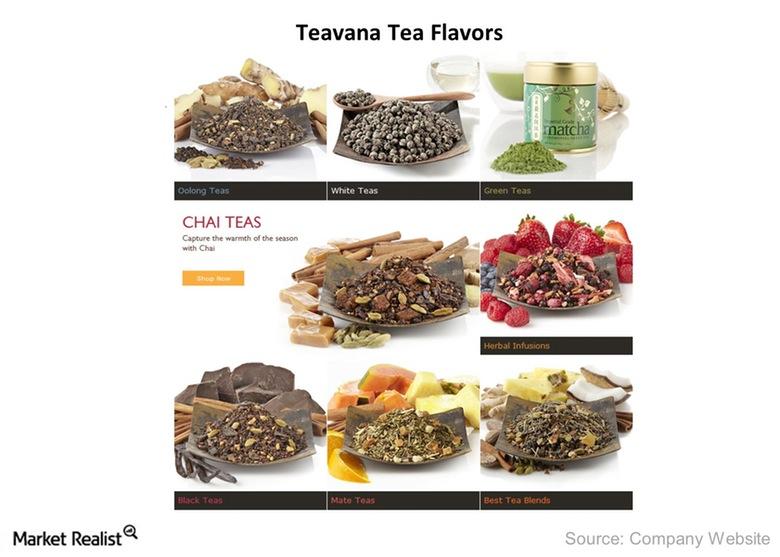
Starbucks Strategically Targets Its Teavana Business
By opening Teavana Fine Teas and Tea Bars, Starbucks has shown how it’s focused on generating revenues from relevant products.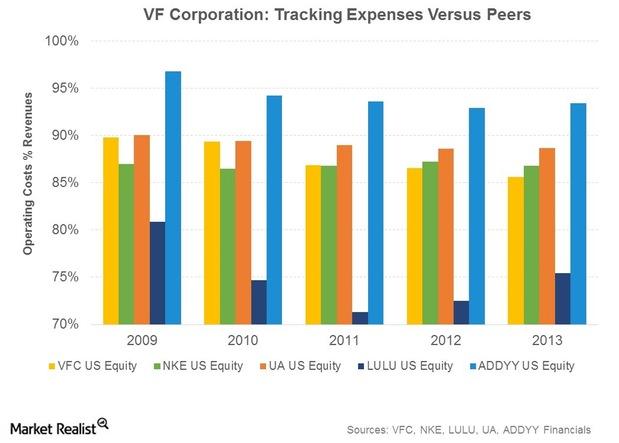
VF Corp.’s Location, Manufacturing, And Supply Chain Advantages
VFC manufactures ~27% of its products in facilities operated by the company. The company owns 28 manufacturing facilities.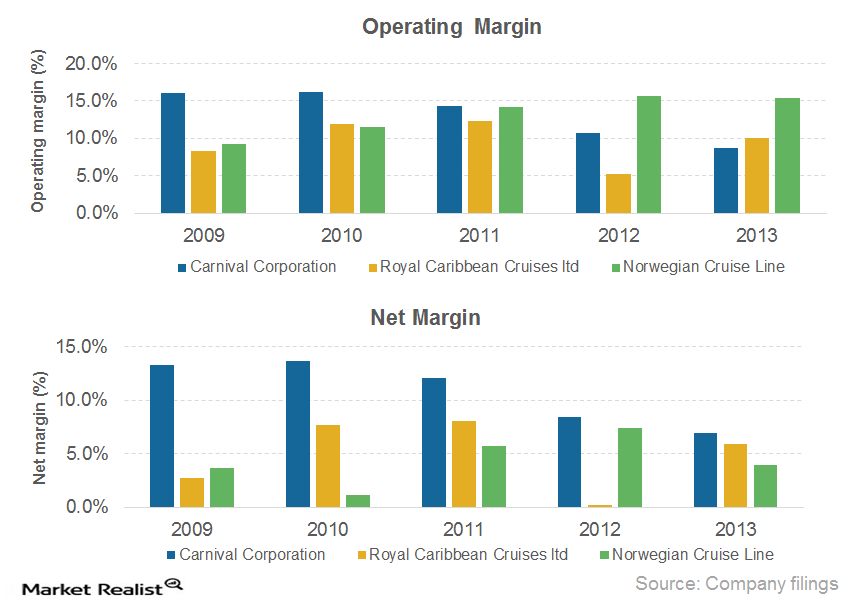
Comparing the major cruise lines’ operating and net margins
Among the three major competitors in the cruise industry, Royal Caribbean (RCL) had the highest operating margin in 2013.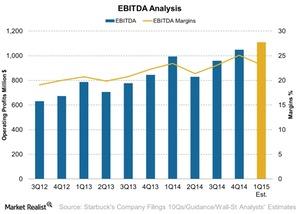
An Analysis Of Starbucks’s EBITDA
Starbucks’s EBITDA is lowest in second quarters, which shows the seasonality of the business. Adverse weather conditions can also affect EBITDA.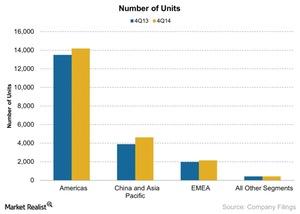
Starbucks’s Geographic Segment Update
The following are Starbucks’s geographic segments: Americas; China and Asia Pacific; and Europe, the Middle East, and Africa.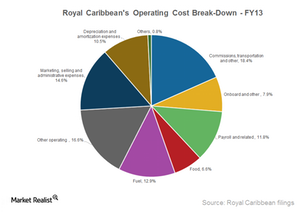
Breaking down Royal Caribbean’s operating costs
Costs directly related to operating a cruise ship comprise ~74% of Royal Caribbean’s (RCL) total operating costs.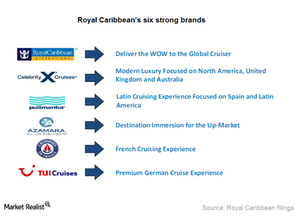
Royal Caribbean tailors brands for specific international markets
Apart from operating the largest contemporary global brand, Royal Caribbean offers five additional brands targeting specific markets.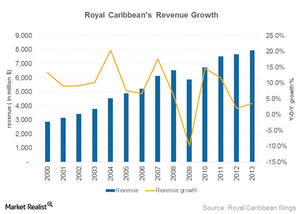
A closer look at Royal Caribbean’s revenue sources and growth
Royal Caribbean (RCL) derives revenue from two sources: passenger ticket revenue and onboard and other revenue.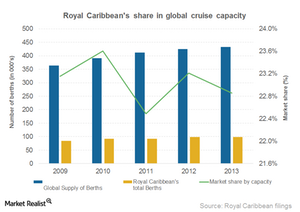
Overview: Royal Caribbean Cruises, the 2nd largest cruise operator
Royal Caribbean Cruises, founded in 1968 and headquartered in Miami, Florida, is the world’s second largest cruise company.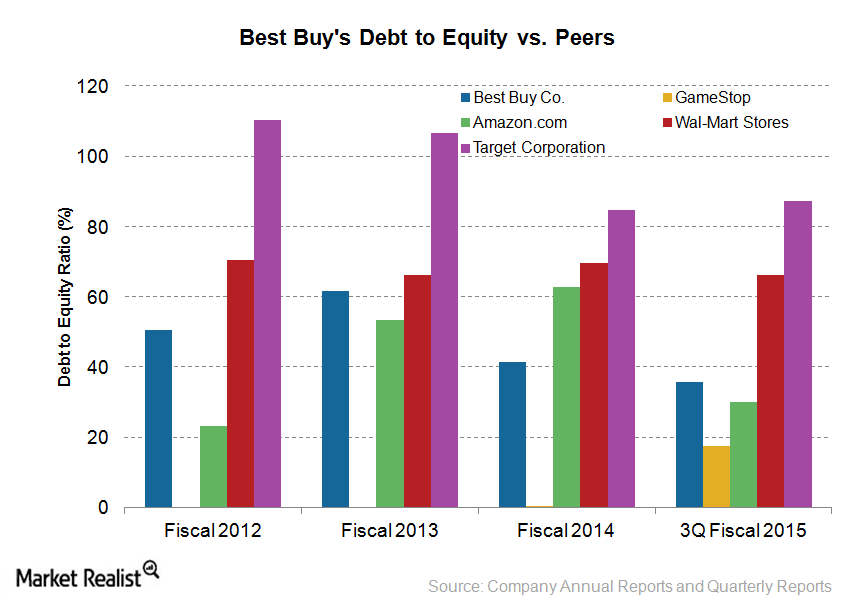
Assessing Best Buy’s debt profile
Gauging a company’s debt levels is crucial to understanding its financial health. Maintaining high debt levels in uncertain times can be damaging.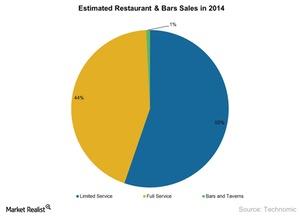
An overview of the US restaurant industry
Consumer confidence in the United States is at an all-time high in seven years, and people are spending more on food prepared outside the home.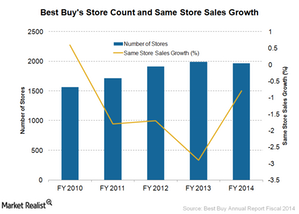
Best Buy sees better same-store sales in 3Q 2015
Best Buy’s growth rate in same-store sales had been negative since fiscal 2011. Efforts to optimize the shopping experience have changed that.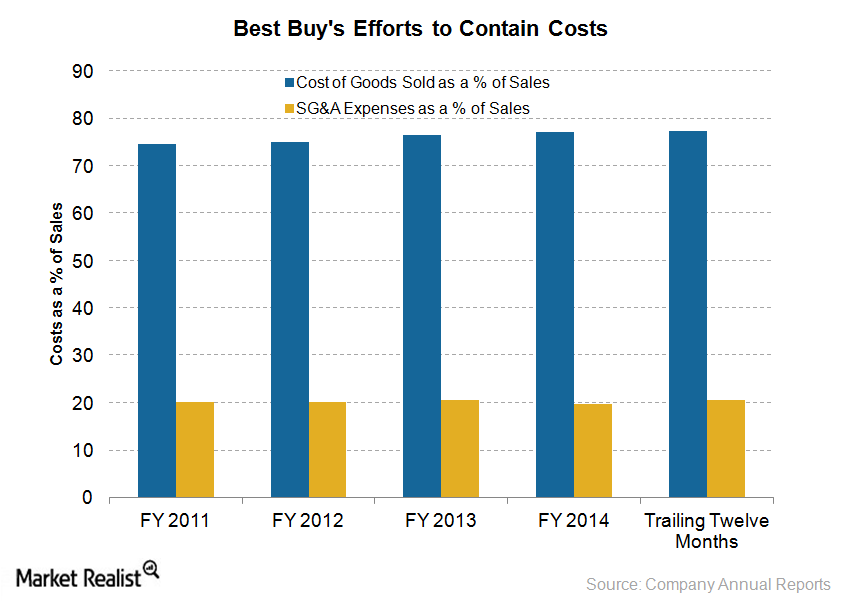
Renew blue: Best Buy’s turnaround strategy
As part of its turnaround strategy, Best Buy is also revamping its stores and trying to encourage more robust store traffic.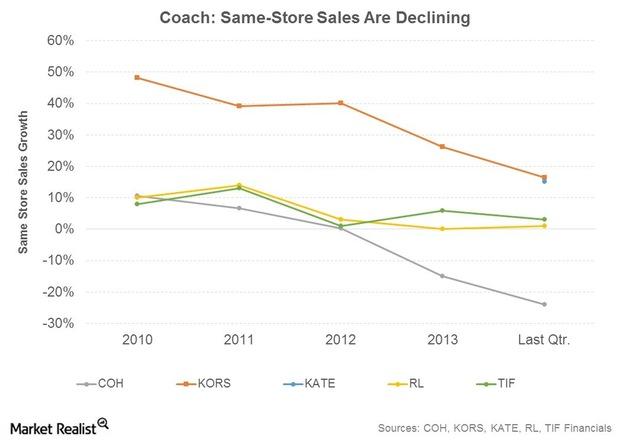
Purse Wars: Coach Seeing Fierce Competition For Market Share
Competition is fierce in all of the affordable luxury industry. And, there are many players, including KORS and KATE.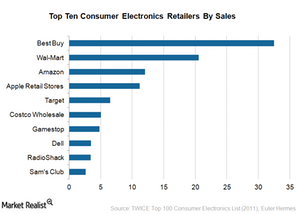
Best Buy: The largest consumer electronics retailer
Best Buy is the leading consumer electronics retailer in the US. Today, Best Buy has more than 1,900 stores and locations.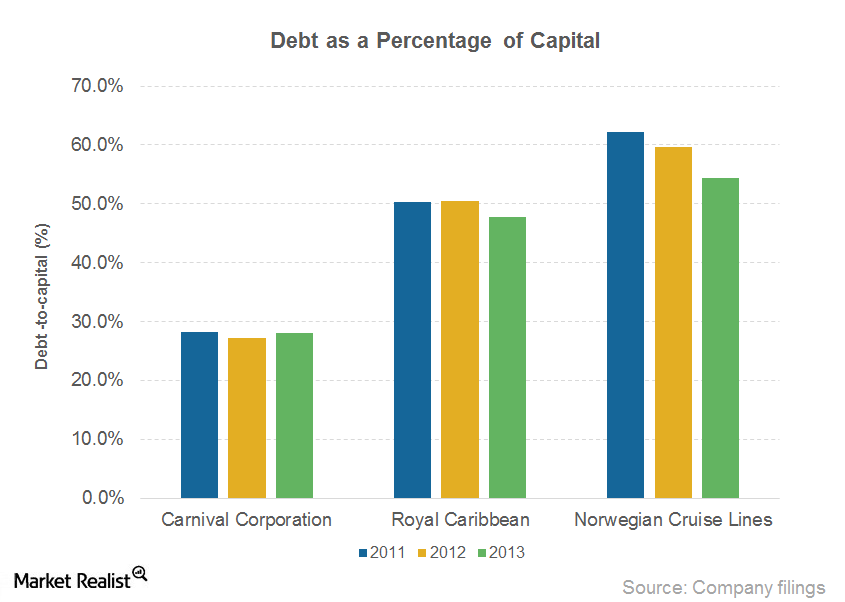
Carnival stays competitive with strong financial position
Carnival has a stronger financial position than its peers. It maintained a very low debt-to-capital ratio of 28% in 2013 and just 27% in 2014.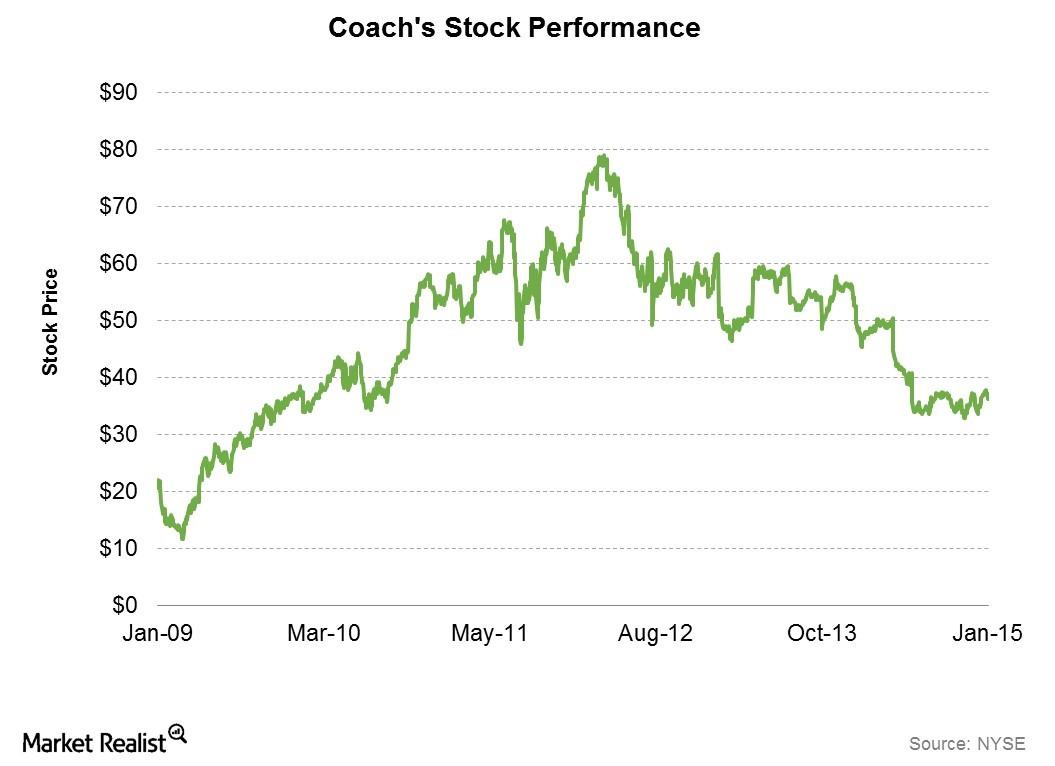
An Introduction To Luxury Brand Pioneer Coach
Coach is a well-known premium fashion brand. In recent years, Coach has faced increasing competition from newer entrants in the affordable luxury market.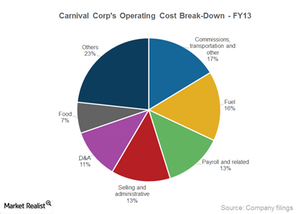
A key overview of Carnival’s costs and profitability
Carnival’s operating profit increased to $1,792 million in 2014, from $1,352 million in 2013. Its operating margin increased to 11.3%, from 8.7% in 2013.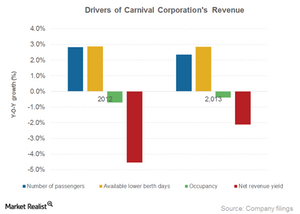
Key drivers of Carnival’s revenue growth
The growth of demand was the key driver of Carnival Corporation’s revenue growth in 2014. The number of passengers increased by 5% in 2014.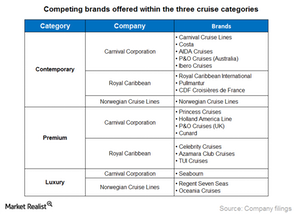
Carnival’s contemporary, premium, and luxury cruises
Cruise categories Cruise liners have been successfully providing a wide range of products and services at various price points to suit preferences of passengers from different age groups. Service levels and pricing differ by brand, category of the ship, cabins, season, duration, and itinerary. We can categorize cruise brands into these three categories: contemporary, premium, […]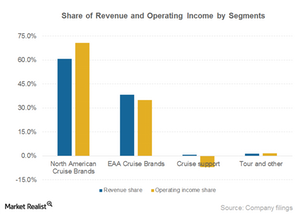
Two segments make up 98% of Carnival Corporation’s revenue
Two of Carnival Corporation’s (CCL) operating segments comprise almost 98% of the company’s revenue. Carnival also reports a Cruise Support segment and a Tour segment.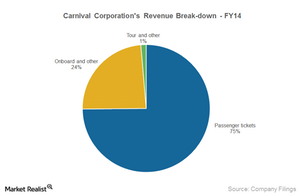
What are Carnival Corporation’s revenue sources?
Carnival Corporation (CCL) derives revenue from the following three sources: passenger tickets, onboard or other activities, and tours.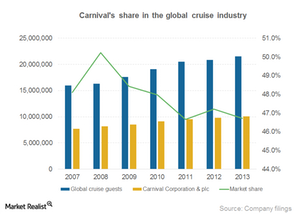
Carnival boasts largest market share of cruise passengers
The number of Carnival’s cruise passengers has increased at a six-year CAGR of 4.6%. It has the largest market share of cruise passengers at ~47%.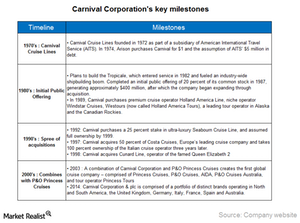
A key overview of Carnival, the world’s largest cruise company
Carnival Corporation (CCL), the largest cruise company in the world, operates 101 cruise ships and has a global market share of ~47%.
Pivotal Government Regulations That Affect Texas Roadhouse
In addition to the factors we’ve discussed, regulations can also affect the company’s profits. Let’s look at some of the regulations that apply to TXRH.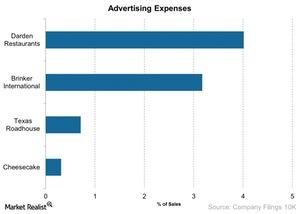
Understanding Texas Roadhouse’s Marketing Approach
A company can increase its marketing and promotional activities to bring in more customers and obtain operating leverage.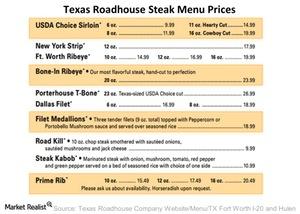
Why Texas Roadhouse Increased Its Menu Prices
The company increased its menu prices by 1.5% in early December of 2013, and in 2012, it increased menu prices by 2.2%.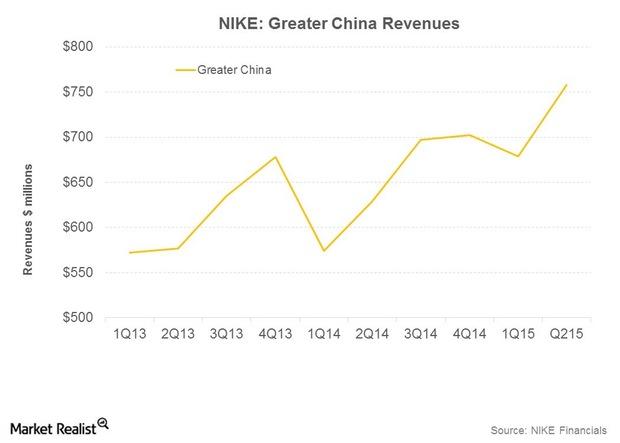
NIKE in Greater China: Strategies That Work
NIKE holds the #1 position for both apparel and footwear in China among sportswear rivals. It plans to leverage the value of its brand among consumers.