General Motors Company
Latest General Motors Company News and Updates
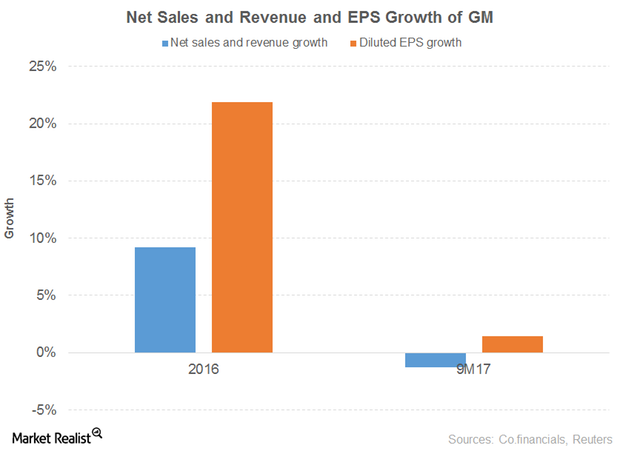
A Look at GM’s Stock Performance
In this part of our focus on the top 18 cheap S&P 500 stocks, we’ll discuss another six stocks: General Motors (GM), Ford Motor (F), Owens-Illinois (OI), The Goodyear Tire & Rubber Company (GT), Navient (NAVI), and Brighthouse Financial (BHF).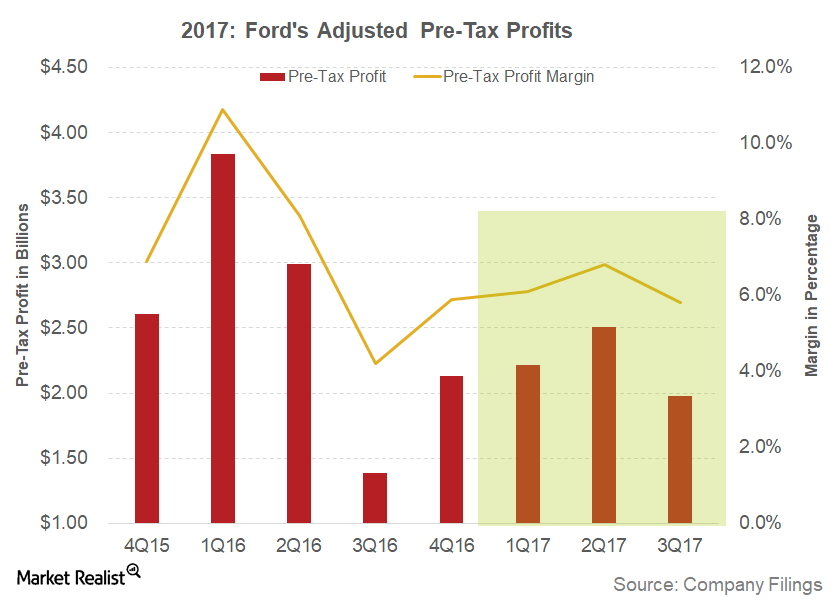
Key Factors Impacted Ford’s Profit Margins
In 1Q17, Ford reported a gross profit margin of 10.3%. It reflected weakness compared to the gross margin of 14.1% in the same quarter the previous year.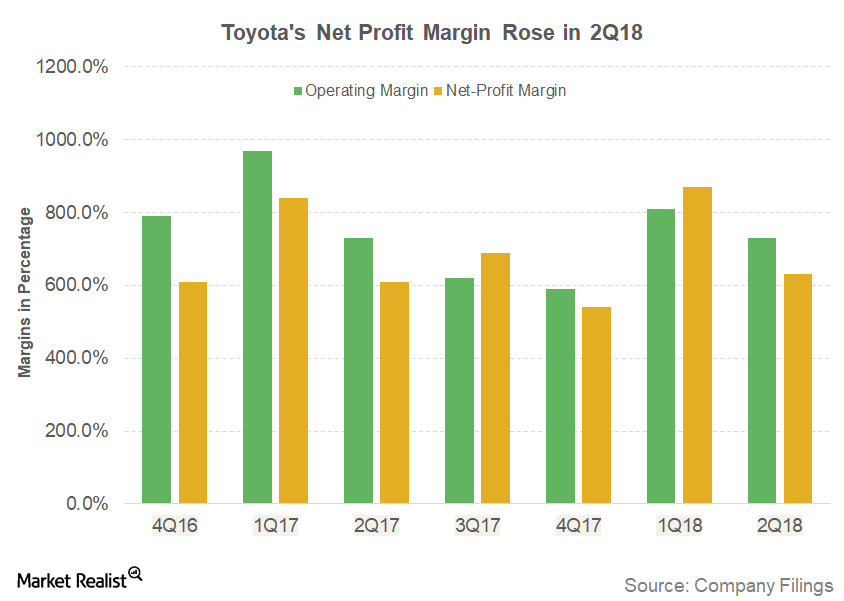
How Toyota’s Profit Margins Trended in Fiscal 2Q18
In fiscal 2Q18, Toyota reported a flat operating margin of 7.3% compared to 7.3% in the same quarter the previous year.
Key Support and Resistance in Tesla Stock after Its 3Q17 Results
The majority of analysts are suggesting a “hold” on Tesla at the moment.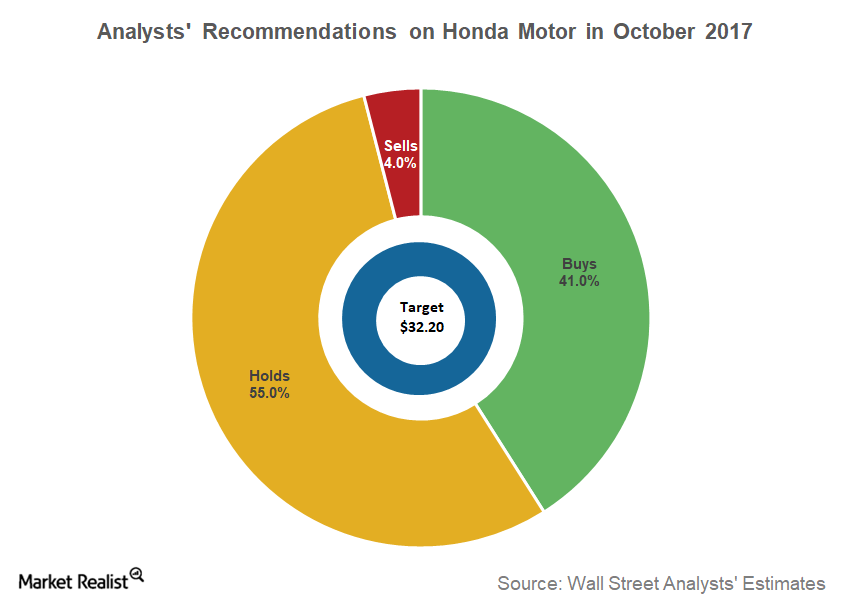
What Do Analysts Recommend for Honda Motor in October 2017?
According to analysts’ consensus data, 41% of analysts covering Honda Motor Company (HMC) gave it a “buy” recommendation on October 11.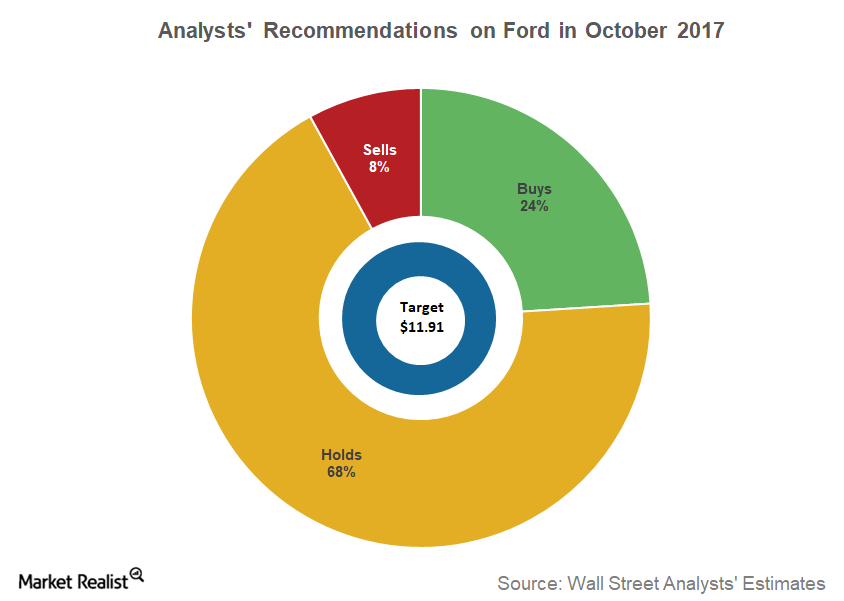
Why Many Analysts Aren’t Positive on Ford in October 2017
According to data compiled by Reuters as of October 11, 25% of analysts covering Ford (F) stock have given it a “buy” recommendation.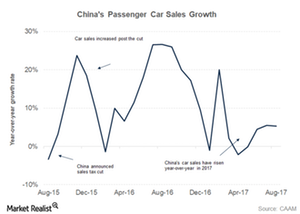
How Did China’s Auto Sales Trend in August?
China’s automobile industry is the second-largest steel consumer after the real estate sector.
Why BlackBerry Is Eyeing the Internet-of-Things Space
The Internet-of-Things (or IoT) market is expected to reach $4 trillion in value by the end of 2025, according to McKinsey & Company.
Here’s What Ford F-Series August Sales Mean for Investors
In August 2017, Ford Motor’s (F) F-Series truck US sales were 77,007 units with a handsome rise of 15.0% on a YoY (year-over-year) basis.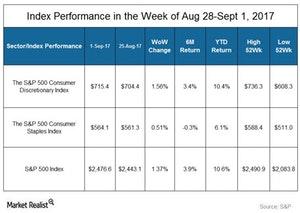
Analyzing the Consumer Sector’s Performance Last Week
On September 1, General Motors (GM) released its August sales report. In August, US retail sales recorded 275,552 vehicles—7.5% higher YoY.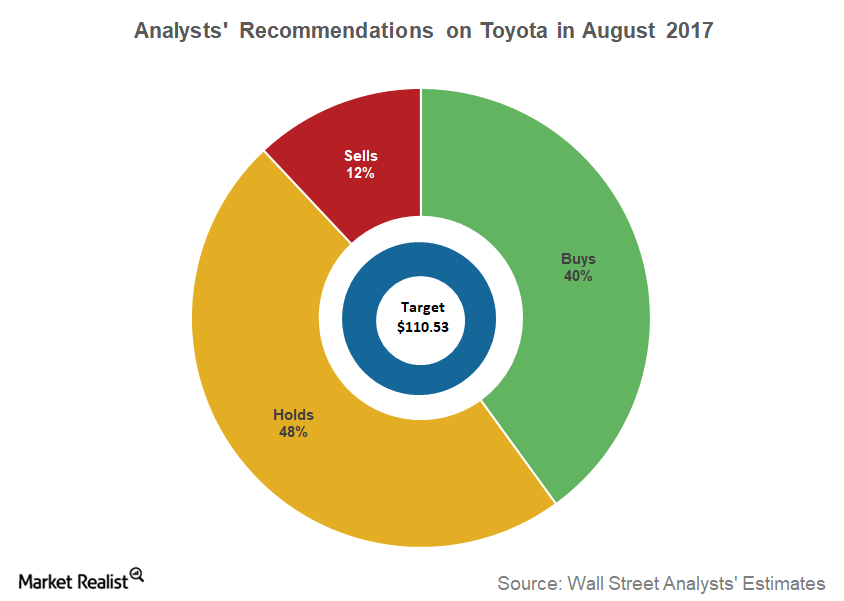
Analysts’ Recommendations for Toyota in August 2017
Toyota Toyota (TM) is the second-largest auto manufacturer in the world after Volkswagen (VLKAY), according to 2016 global auto sales data. In 2008, Toyota became the world’s largest automaker by volume, despite being founded much later than legacy US auto giants (IYK) General Motors (GM) and Ford Motor (F). Recommendations on Toyota According to recent data […]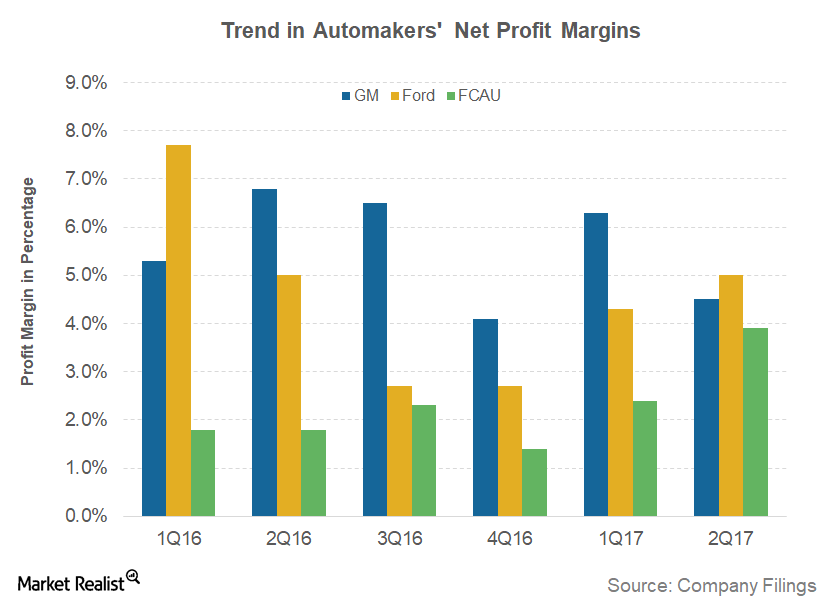
Comparing Mainstream Automakers’ 2Q17 Profit Margins
In 2Q17, General Motors’ (GM) adjusted EBIT (earnings before interest and taxes) stood at 3.7 billion. The company’s EBIT margin was 10.0% for the quarter.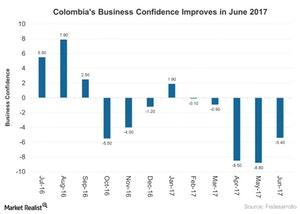
Marginal Rise in Industrial Confidence in Colombia in 2017
Industrial confidence in Colombia (GXG) improved in June 2017 to -5.4% as compared to -8.8% in May 2017.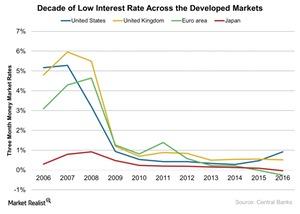
Do Low Interest Rates Inflate Asset Prices?
On January 26, financial adviser Andy Chase told CNBC’s Mike Santoli that equity valuations are at an all-time low. Chase believes that stocks provide the strongest investment opportunity in 2017.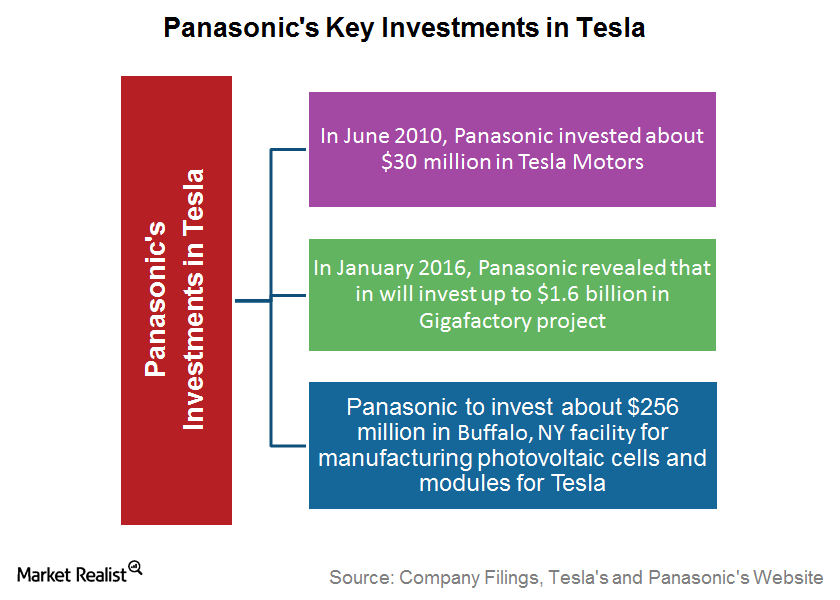
Why Is Tesla’s Association with Panasonic Important?
Tesla’s agreement with Panasonic for the solar energy business made it clear that their association isn’t just limited to cells and battery manufacturing.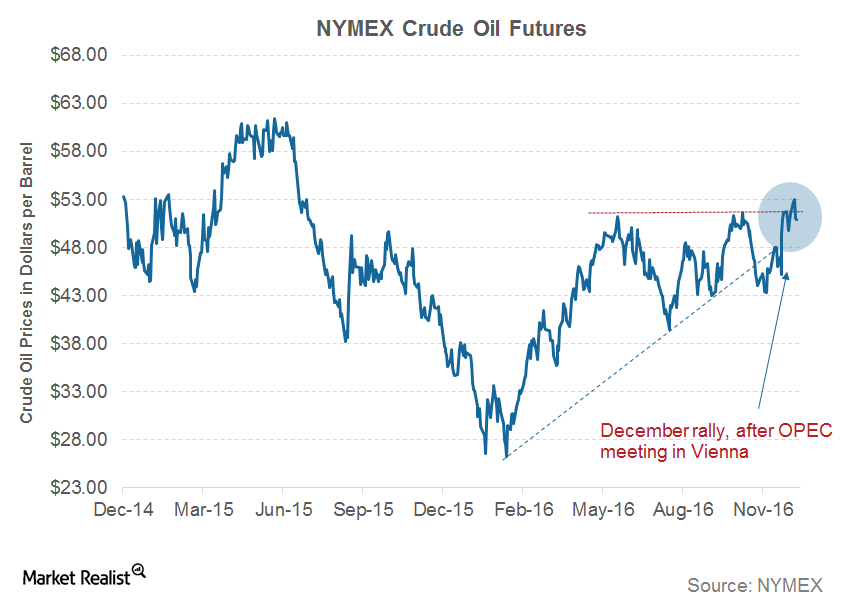
How the Recent Rise in Oil Prices Could Affect the Auto Industry
In November 2016, the WTI (West Texas Intermediate) crude oil prices traded on a bullish note after witnessing a 2.9% rise in the previous month.
Comparing General Motors and Ford’s Huge Pension Obligations
In the last six years, Ford contributed ~$12.9 billion to its pension funds. It’s the main reason why it has a better-funded status than General Motors.
What Different Pension Plans Do Automakers Offer?
Defined benefit plans are one of the oldest types of post-retirement benefit plans that automakers offer to their employees.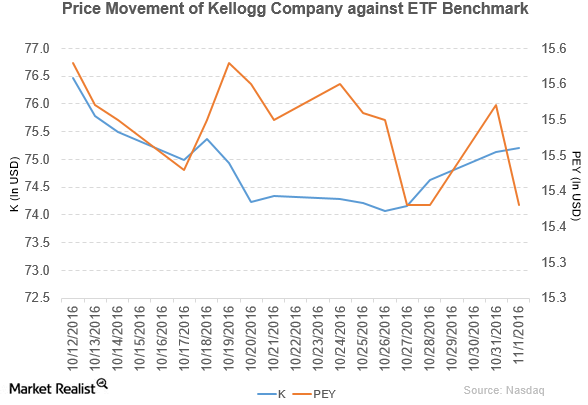
A Look at Kellogg’s 3Q16 Performance
Price movement Kellogg (K) has a market cap of $26.4 billion. It rose 0.11% to close at $75.21 per share on November 1, 2016. The stock’s weekly, monthly, and year-to-date (or YTD) price movements were 1.4%, -2.6%, and 6.1%, respectively, on the same day. Kellogg is trading 0.07% below its 20-day moving average, 3.4% below […]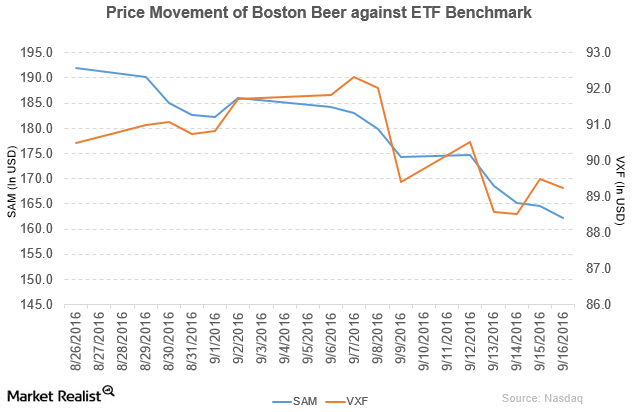
Credit Suisse Has Rated Boston Beer Company ‘Underperform’
Boston Beer (SAM) has a market cap of $2.0 billion. It fell 1.4% to close at $162.15 per share on September 16, 2016.
Why Did Johnson Controls Rise on September 6?
Johnson Controls (JCI) has a market cap of $31.5 billion. It rose by 2.4% to close at $48.90 per share on September 6, 2016.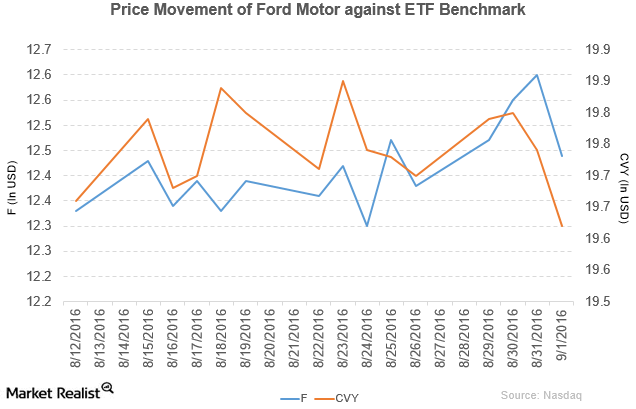
How Did Ford Motor Perform in August 2016?
Ford Motor fell by 1.3% to close at $12.44 per share on September 1, 2016. Its weekly, monthly, and YTD price movements were -0.24%, 2.6%, and -6.7%.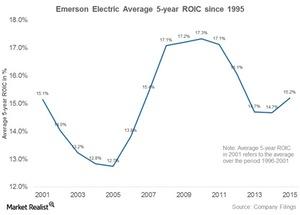
Does Emerson Have a Competitive Advantage?
An analysis of Emerson Electric’s (EMR) ROIC between 1995 and 2015 shows that 2001–2003 were the only years when ROIC fell below 13%.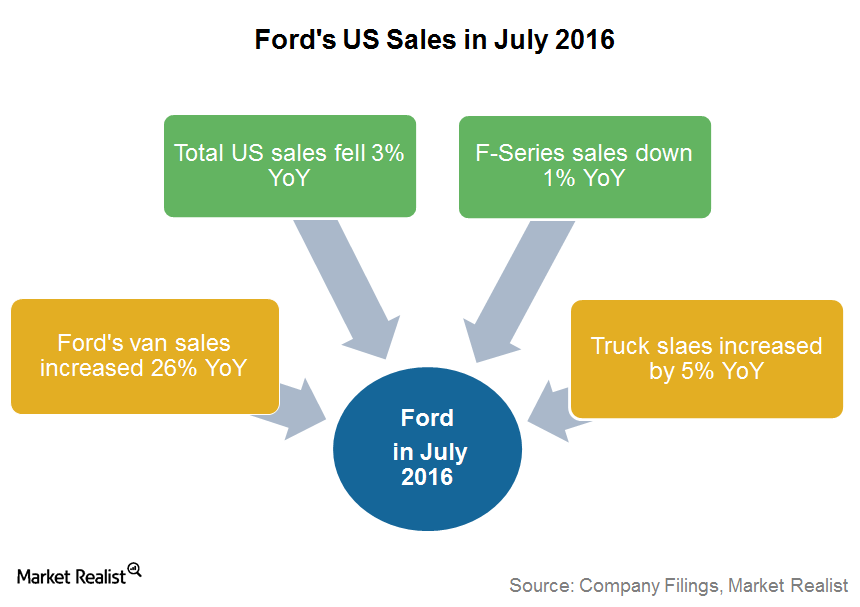
Is Ford Maintaining the Right Balance between Retail and Fleet Sales?
In July 2016, Ford’s fleet sales rose by 6% YoY to 55,321 units, whereas its retail vehicle sales fell by 6% YoY to 161,158 units.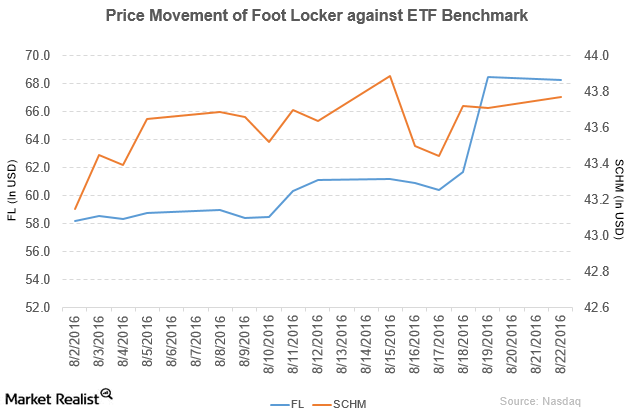
Why Did Foot Locker’s Price Target Rise?
Foot Locker has a market cap of $9.3 billion. It fell by 0.35% and closed at $68.25 per share on August 22, 2016. It reported fiscal 2Q16 sales of $1.8 billion.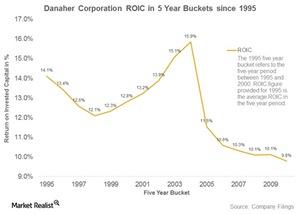
Is Danaher Losing Its Competitive Advantage?
We analyzed Danaher’s (DHR) ROIC in the 20-year period between 1995 and 2015 and classified the period of study into 16 buckets of five years each.
How Ford Motor Performed in July 2016
Ford Motor (F) has a market cap of $47.6 billion. It fell by 4.3% to close at $11.94 per share on August 2, 2016.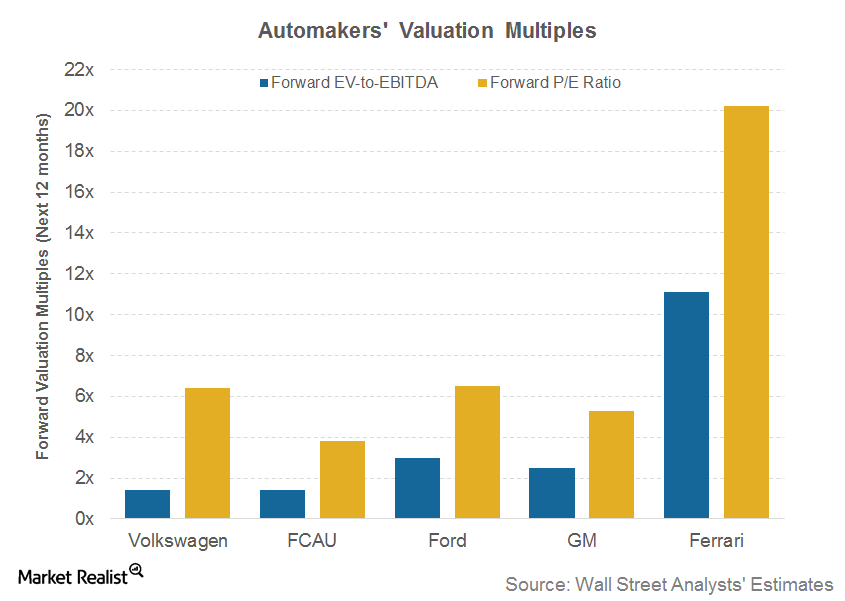
Analyzing Ferrari’s Valuation Multiples ahead of 2Q16 Earnings
As of July 18, 2016, Ferrari’s (RACE) forward EV-to-EBITDA multiple is 11.1x. Ferrari’s forward PE (price-to-earnings) multiple is trading at 20.2x.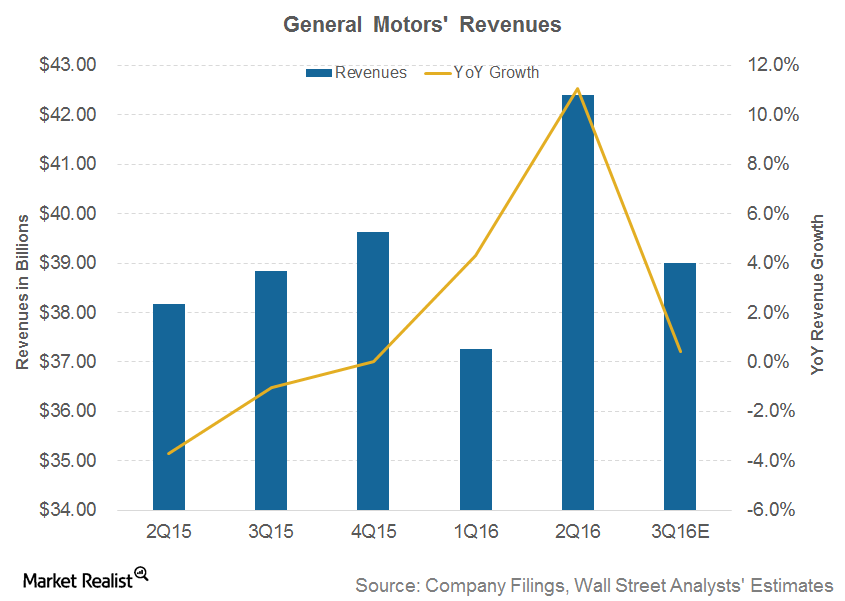
What Drove General Motors’ Revenues Higher in 2Q16?
In 2Q16, General Motors’ (GM) revenues came in at $42.4 billion. This reflects an increase of 11.1% over $38.2 billion in the corresponding quarter of the previous year.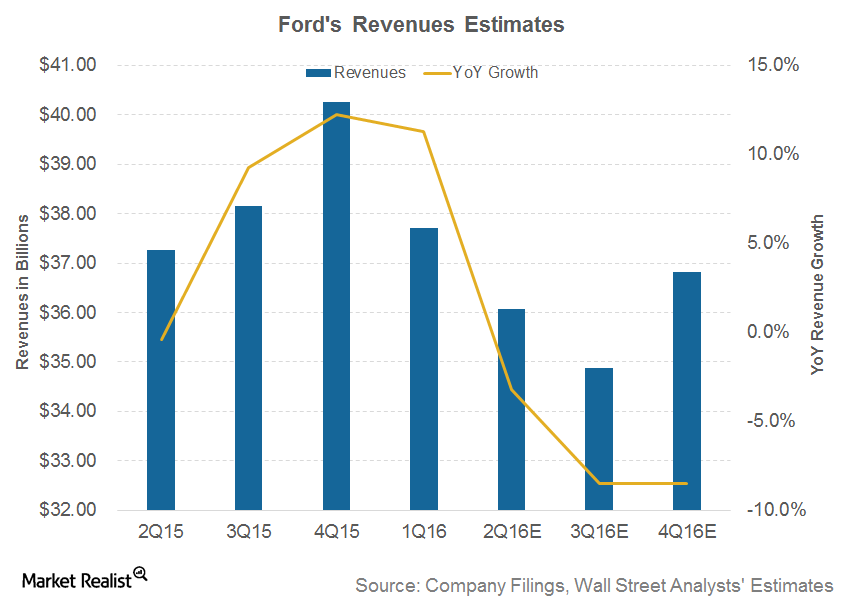
Can Ford Sustain Its Revenue Growth?
In 1Q16, Ford (F) reported an 11.3% year-over-year (or YoY) rise in its global revenue, which was $37.7 billion compared to $33.9 billion in 2Q15.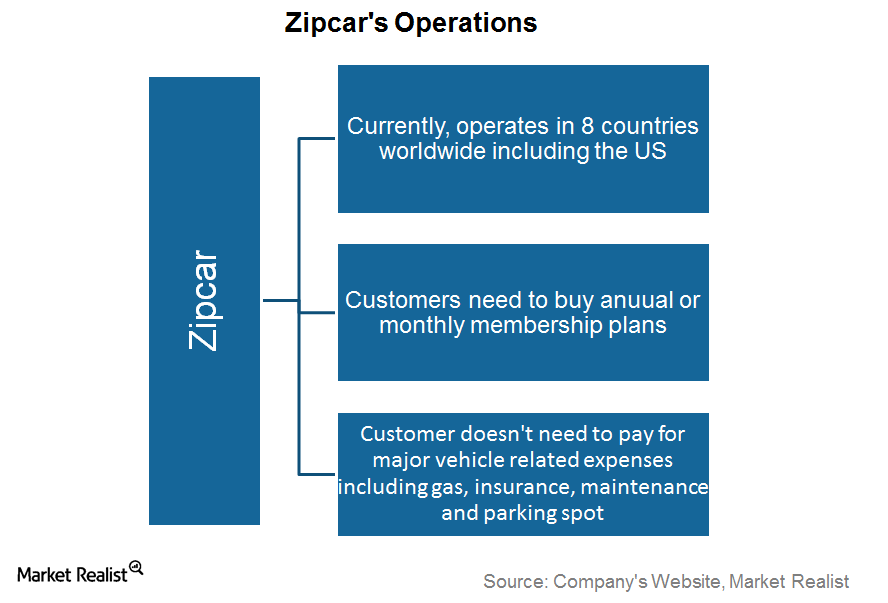
Understanding Zipcar’s Business Model
Founded in 2000, Zipcar was one of the car-sharing industry’s early entrants.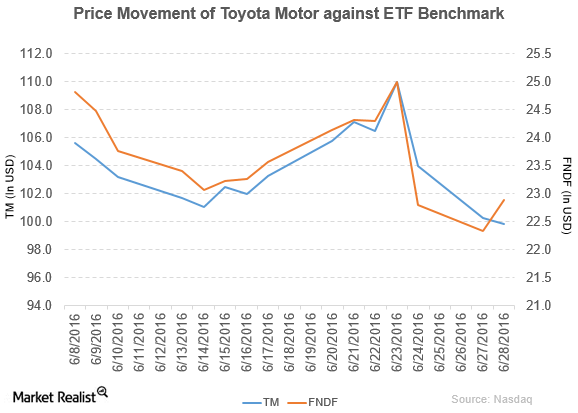
Why Did Toyota Motor Recall Its Vehicles?
Toyota Motor (TM) has a market cap of $158.3 billion. It fell 0.41% to close at $99.85 per share on June 28.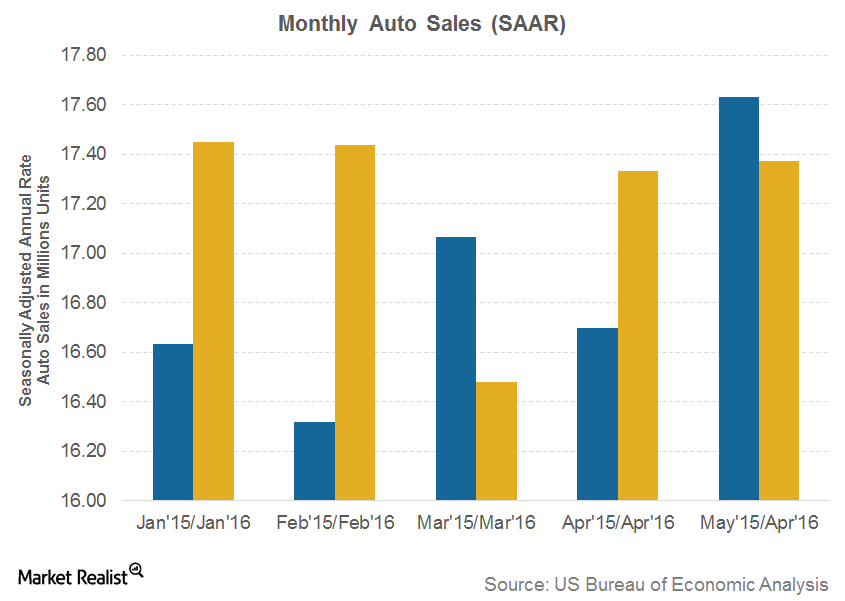
Auto Industry Indicators: What Do Recent Vehicle Sales Data Suggest?
The US auto industry has witnessed good times in the past couple of years. In 2015, US auto sales were at their highest, with 17.4 million vehicles sold.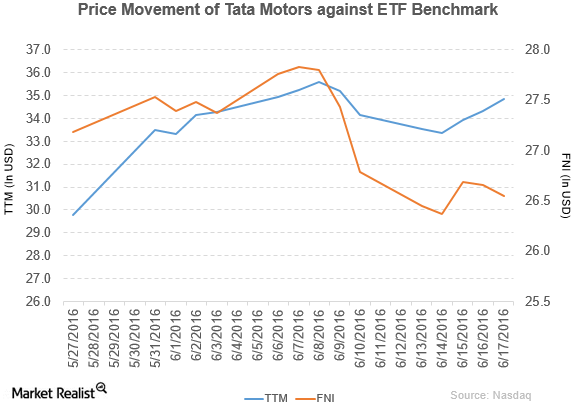
Tata Motors Opened New Plant in Brazil to Increase Profitability
Tata Motors Limited-ADR (TTM) rose by 2.1% to close at $34.83 per share at the end of the third week of June 2016.
Analyzing Recent Trends in Honda’s Revenue
In fiscal 2016, Honda reported strong revenues of ~1.5 trillion Japanese yen, which is 9.6% higher than its revenues of ~1.3 trillion yen in fiscal 2015.
How Has Honda’s Marketing Strategy Helped It Grow?
Honda (HMC) markets its products through an extensive sales network in the US. This network comprises ~1,040 independent local dealers for motorcycles, ~1,310 for automobiles, and ~8,200 for power products.
Understanding Honda’s Financial Services Business
In fiscal 2016, Honda’s Financial Services’s net revenues stood at 1.8 trillion Japanese yen. This is 18% higher than its fiscal 2015 revenues of 1.5 trillion yen.
Honda Motor Company: Understanding Key Business Segments
By revenue, Honda’s Automobile segment is the company’s largest division. In fiscal 2016, ~73% of the company’s total revenues came from the Automobile segment.
What Are the Key Markets for Honda Motor Company?
Honda’s sales from Japan have been declining lately due to slowing auto demand in the region. In fiscal 2016, 12% of the company’s total revenues were from its home market, much lower than 19% in fiscal 2012.
Overview: The Beginning of Honda Motor Company
Honda Motor Company (HMC) is the second-largest Japanese automaker after Toyota and the world’s largest internal combustion engine manufacturer by volume. This series will help auto investors to become familiar with the key aspects of Honda’s business before investing in its stock and ADRs.
A Look at Toyota’s Key Leverage Ratios
At the end of most recent reported quarter, Toyota’s interest coverage ratio was 80.6x. This is far better than the GM’s interest coverage ratio of 15.6x and Ford’s ratio of 14.1x.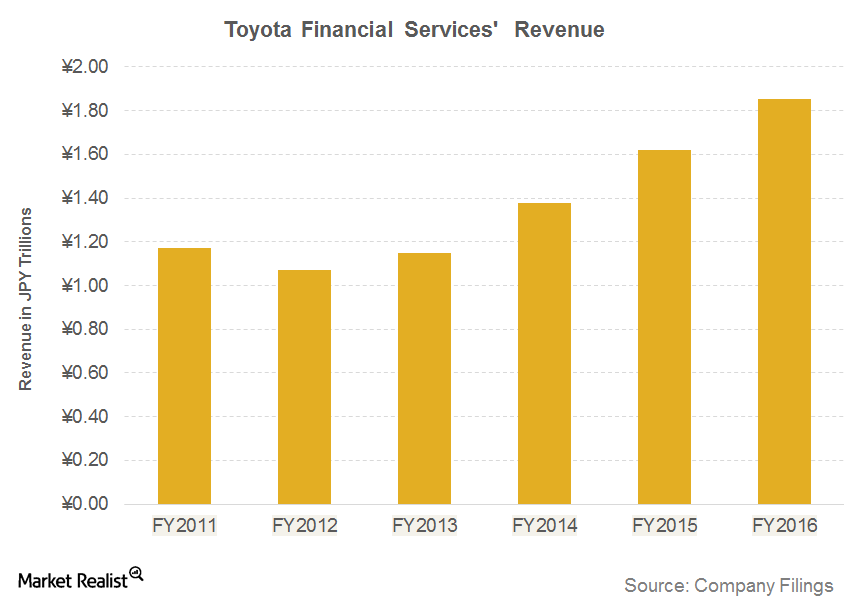
Toyota’s Financial Services Segment and Its Automotive Business
In the last five fiscal years, Toyota’s Financial Services’s revenues have grown by 73%. Rising revenues for the TFS segment reflects optimism in Toyota’s overall sales pattern.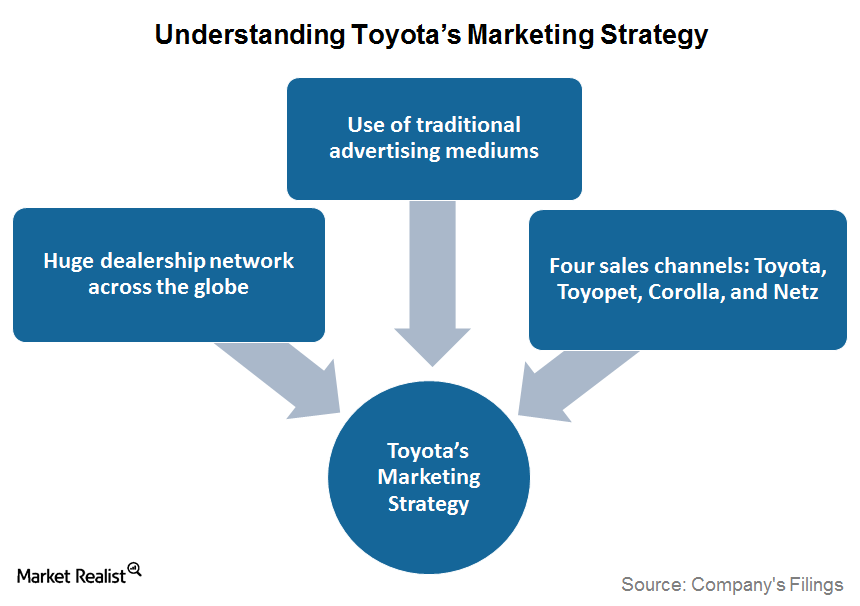
Understanding Toyota’s Marketing Strategy
Toyota (TM) has become one of the top ten biggest advertising spenders in the US. The company spent 435 billion Japanese yen, or 1.6% of its revenues, on advertising and sales promotions during fiscal 2015.
An Investor’s Guide to Toyota’s Valuation
On May 23, 2016, Toyota’s forward PE ratio, based on earnings forecasts for the next 12 months, stood at 8.0x, also much higher than Ford’s 6.2x and GM’s 5.3x.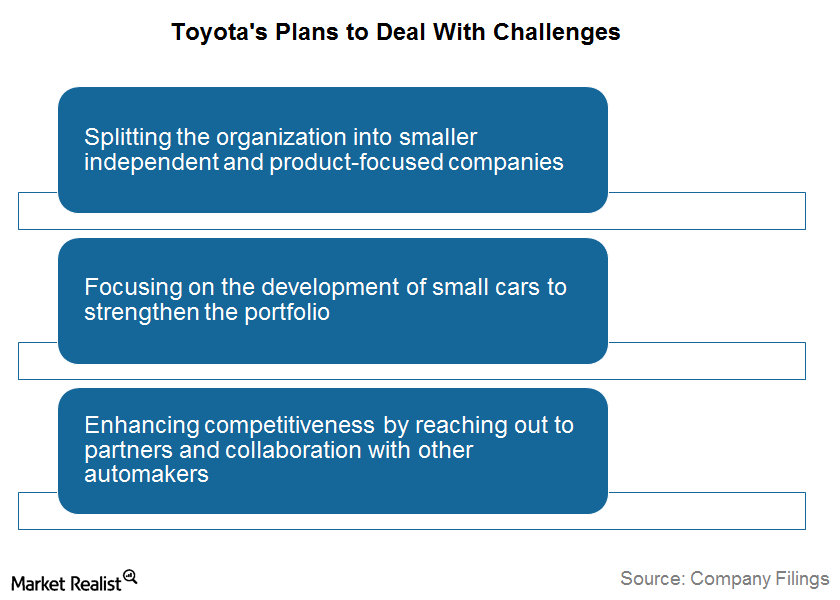
How Does Toyota Plan to Deal with Its Challenges?
With increasing environmental awareness across the globe, a delay in Toyota’s ability to deliver mainstream eco-friendly vehicles may restrict its future growth prospects.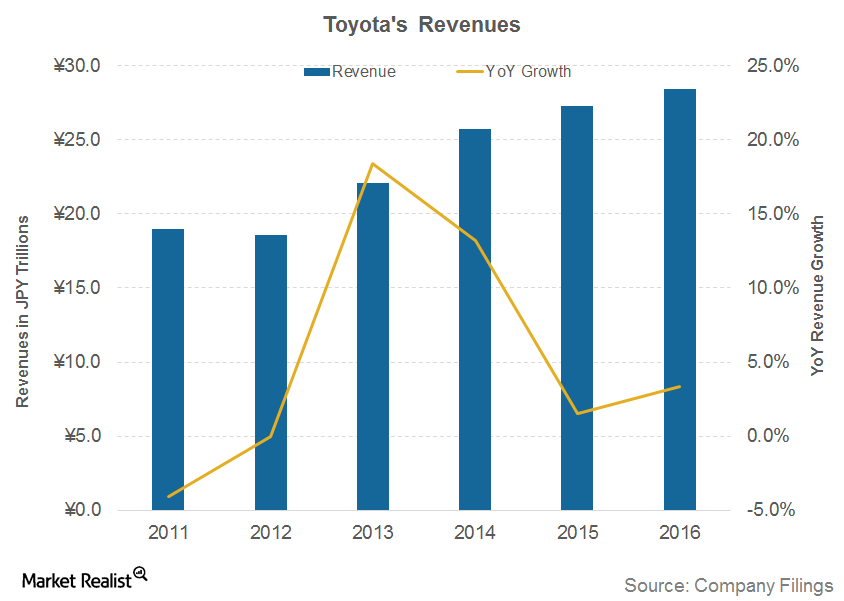
Analyzing Recent Trends in Toyota’s Revenue
According to a report published by Forbes in May 2015, Toyota was the eighth-largest company in the world by revenue. The company is not directly listed in the US, although its ADR is traded on the NYSE.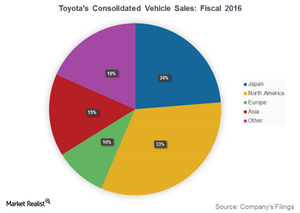
What Are the Key Markets for Toyota Motor Corporation?
Toyota (TM) has 53 overseas manufacturing companies in 28 countries and regions. Originally considered a regional auto manufacturer, Toyota has busted this myth by gaining a huge global market share, particularly in the US and Europe.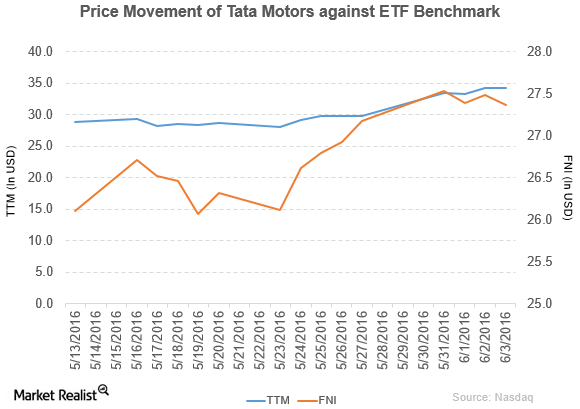
The Reason behind Tata Motors’ Complaint against Jiangling Motors
Price movement of Tata Motors Tata Motors (TTM) has a market cap of $22.1 billion. It rose by 0.32% to close at $34.28 per share on June 3, 2016. The stock’s weekly, monthly, and year-to-date (or YTD) price movements were 15.3%, 20.8%, and 16.3%, respectively, as of the same day. This means that TTM is […]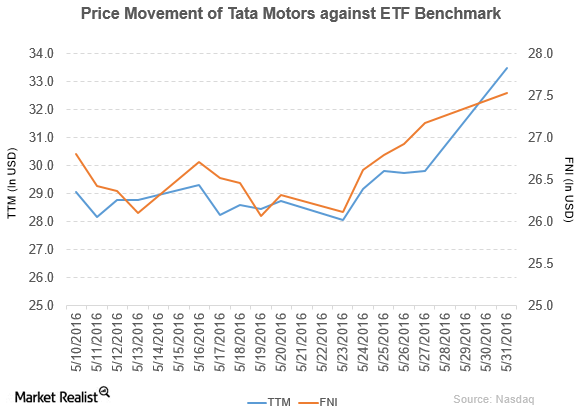
Why Tata Motors’ Top and Bottom Lines Rose in Fiscal 4Q16
Tata Motors (TTM) has a market capitalization of $21.6 billion. It rose by 12.4% to close at $33.49 per share on May 31, 2016.
How Research and Development Is Important to Toyota’s Business
In fiscal 2016 (April 1, 2015–March 31, 2016), Toyota spent ~3.7% of its revenue, or about 1,055 billion Japanese yen, on its R&D program for its vehicles.
