Charles Schwab Corp
Latest Charles Schwab Corp News and Updates
Charles Schwab Agrees to $187M Settlement — Who Gets the Money?
Charles Schwab has agreed to pay $187 million in a settlement surrounding its robo-advisor product. Who gets the payout? Here's what we know.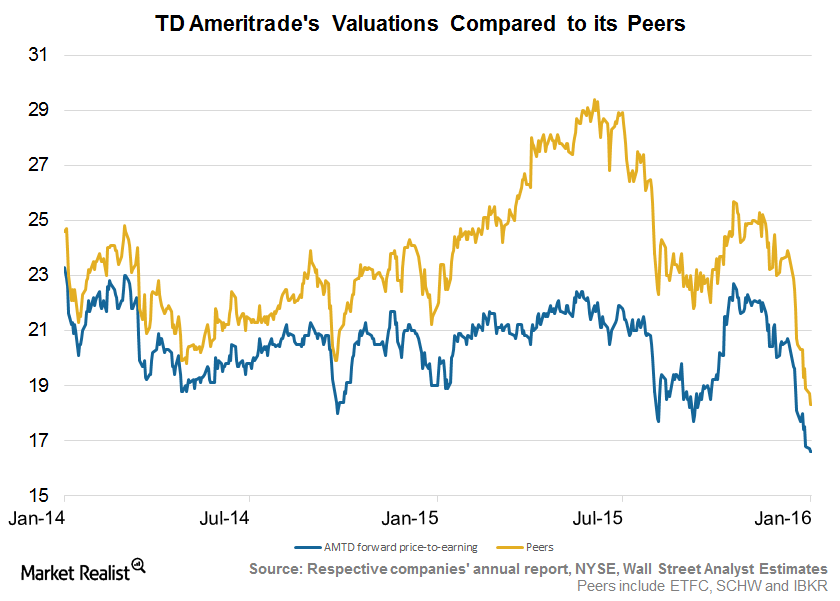
TD Ameritrade’s Valuation Falls alongside the Industry
Historically, TD Ameritrade traded at a discount to its peers because of average operating margins. The sector’s valuations fell in the recent past.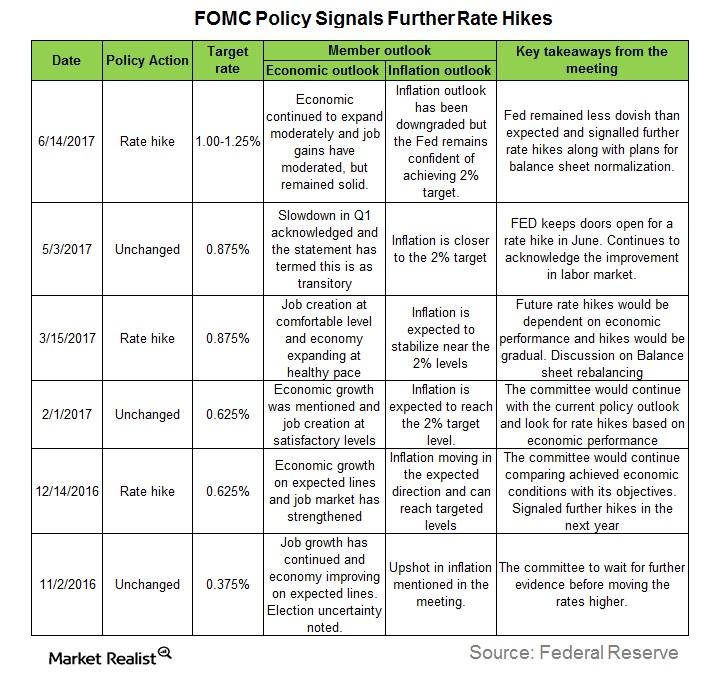
Is the Fed Sure What It’s Doing?
In this series, we’ll analyze Fed members’ comments in June 2017 to better understand their outlooks on the US economy and how they justify their hawkish or dovish stances.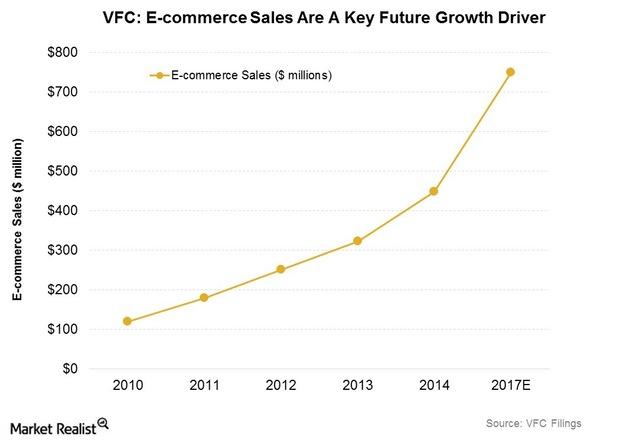
Will VF Corporation’s Vans Brand Spur Higher Growth in 3Q15?
VF Corporation saw sales of $2.5 billion in 2Q15, up 4.7% year-over-year. Its performance was boosted by top brands The North Face, Timberland, and Vans.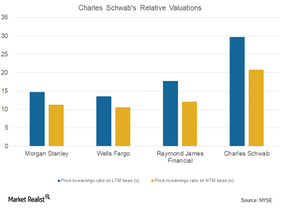
What’s Charles Schwab’s Valuation?
Charles Schwab (SCHW) has a price-to-earnings ratio of 20.80x on an NTM (next-12-month) basis.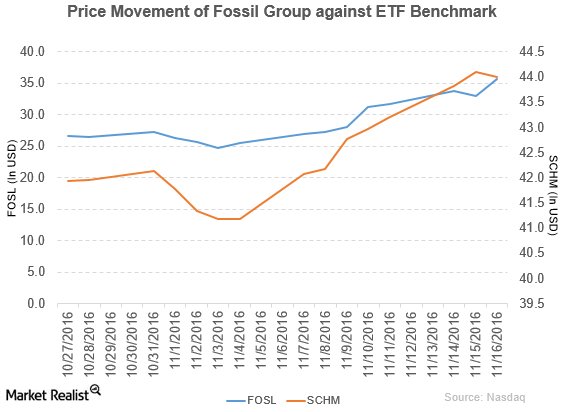
KeyBanc Capital Markets Upgrades Fossil to ‘Overweight’
Fossil Group (FOSL) has a market cap of $1.6 billion. It rose 8.4% to close at $35.70 per share on November 16, 2016.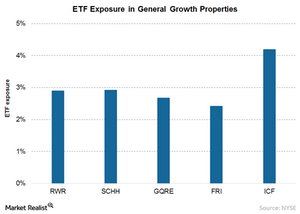
How to Invest in General Growth Properties through ETFs
General Growth Properties has a market cap of $22.1 billion, is part of S&P 500 index, and sees allocation in the major REIT-specific ETFs like ICF.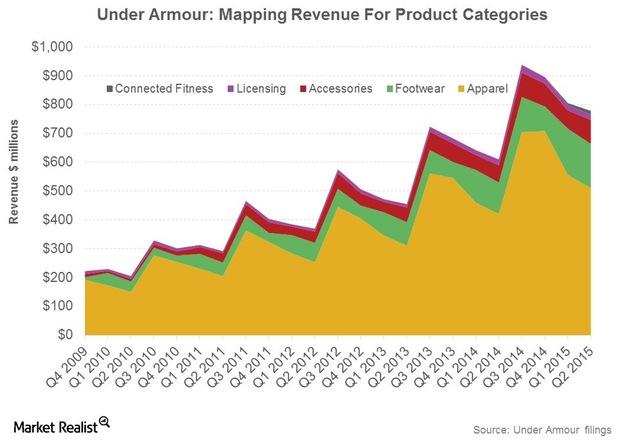
Under Armour’s Footwear Business versus Skechers and New Balance
Primarily an apparel player, Under Armour (UA) has stepped up its pace in entering new footwear categories.
How to Buy Schwab Stock Slices
In June, Charles Schwab introduced Schwab Stock Slices. Investors can own fractional shares of leading companies from the S&P 500 for as little as $5.
Charles Schwab and TD Ameritrade Merger Gets Closer
The merger between Charles Schwab and TD Ameritrade, two discount brokers, will have about $5 trillion in client assets. The deal will likely close by the end of 2020.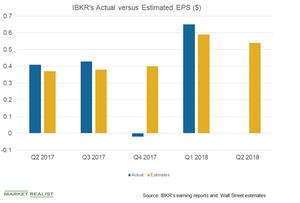
Brokerages in 2018: What to Expect
The final week of the second quarter might help brokerages, primarily because of higher client participation.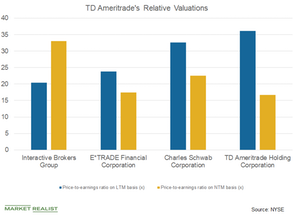
What Are TD Ameritrade’s Valuations?
TD Ameritrade’s (AMTD) PE ratio stood at 16.68x on a next 12-month basis, which implies discounted valuations.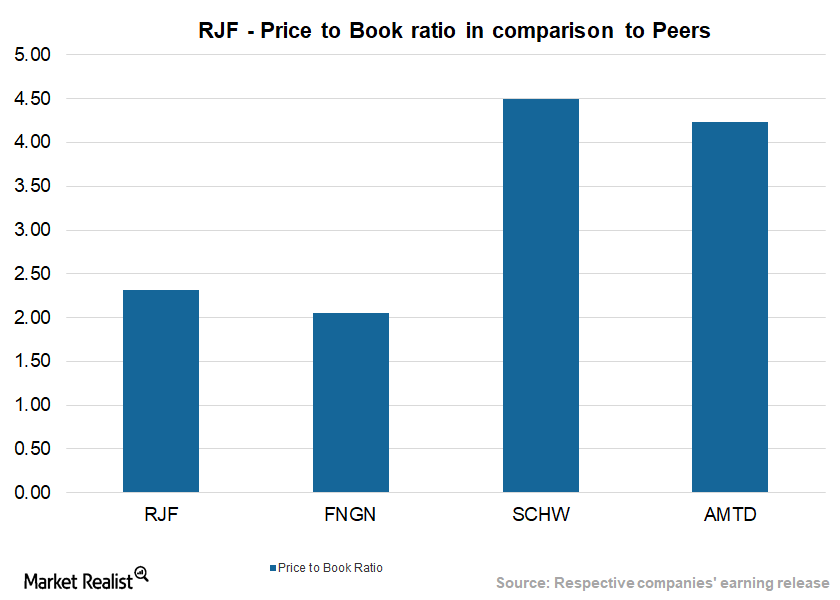
Raymond James Financial Compared to Its Peers
Raymond James Financial (RJF) generated a return of 4.8% in the last three months and 17.6% in the last year.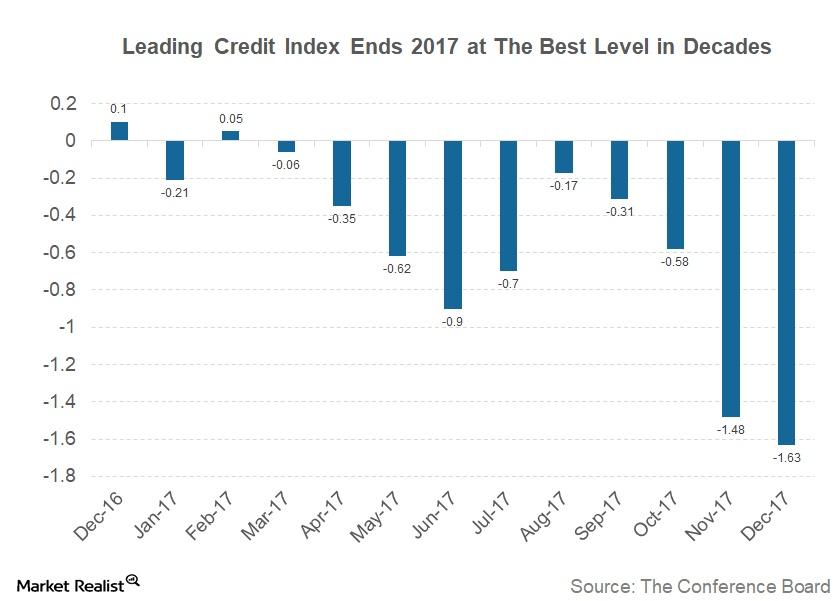
Is the Leading Credit Index Signaling Any Business Cycle Changes?
This constituent of the LEI is an economic model, constructed by modeling changes in six financial market instruments.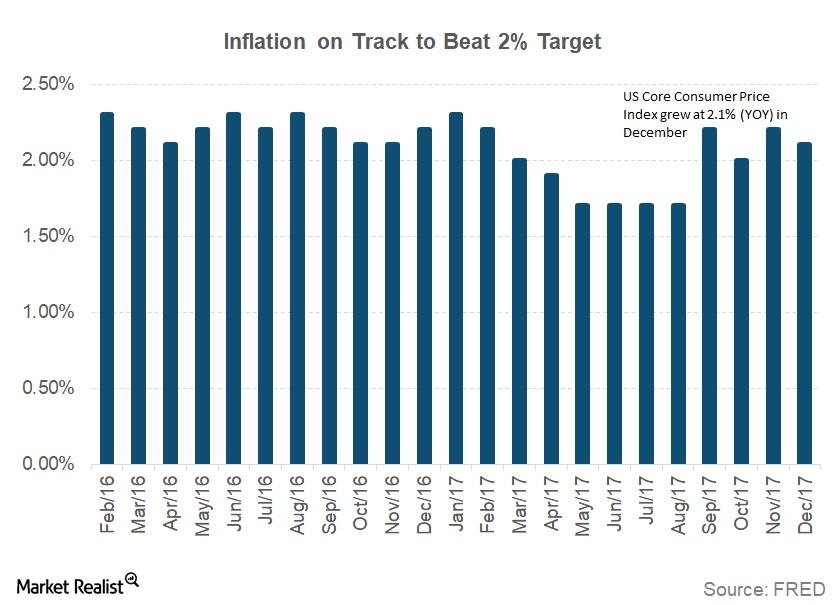
Why Did the Consumer Price Index Rise in December?
According to the December CPI report released by the U.S. Bureau of Labor Statistics on January 12, consumer prices in December increased 0.1%.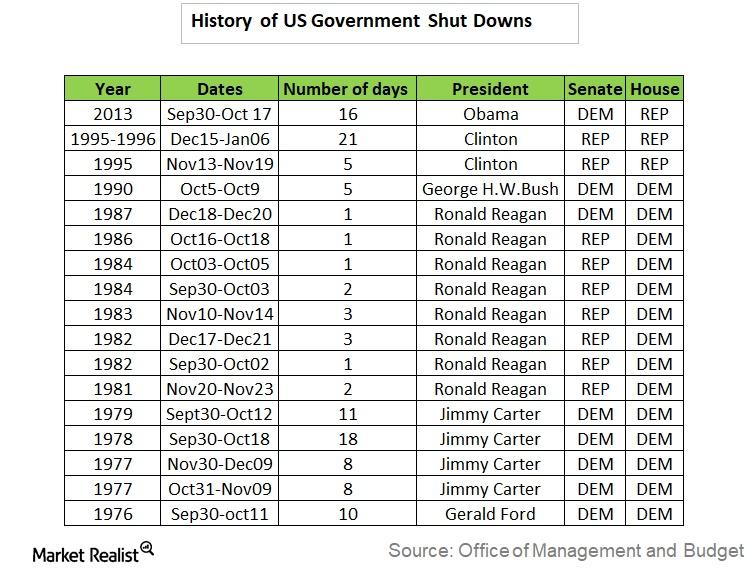
What Could Happen if the US Debt Ceiling Isn’t Raised
The failure of US Congress to raise the debt ceiling would result in a partial government shutdown. The US Treasury wouldn’t be able to issue any government debt, and it could end up borrowing from its retirement savings fund.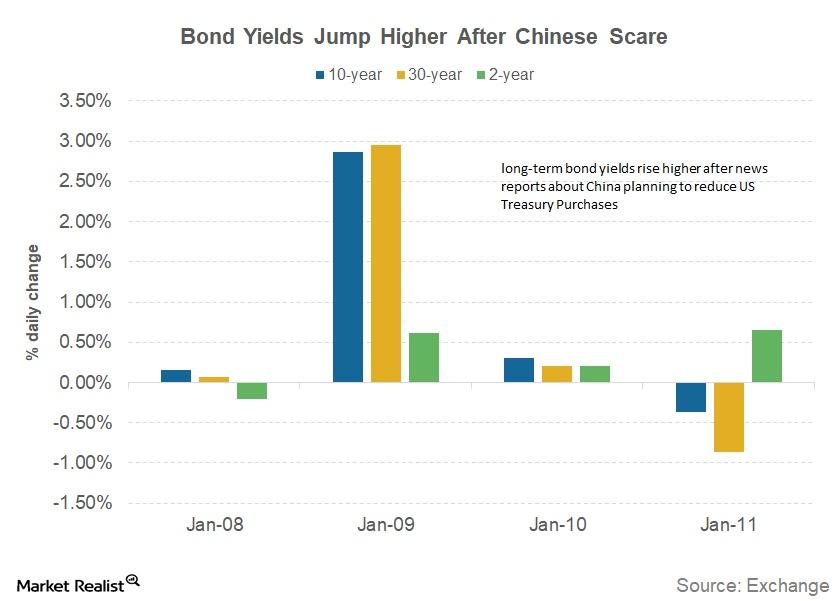
The US Bond Market and the Big Scare from China
On January 10, 2018, Bloomberg News broke a story that the Chinese government could be planning to slow down its purchases of US government debt (GOVT).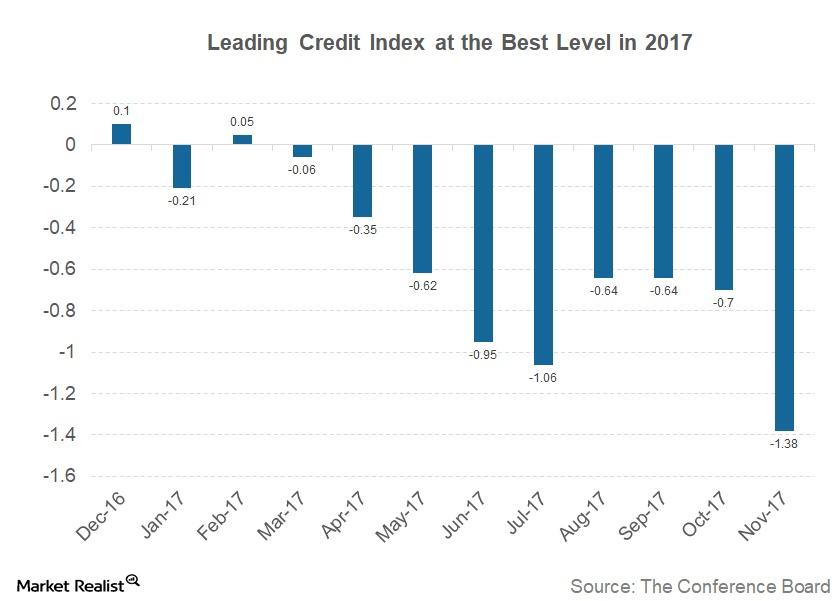
How the Leading Credit Index Tracks US Credit Conditions
Understanding the Leading Credit Index The Conference Board LCI (Leading Credit Index), a constituent in the LEI (Leading Economic Index), is published every month and tracks credit conditions in the US economy by following changes in six financial market instruments: the two-year swap (SHY) spread (real time) the three-month LIBOR[1.Intercontinental Exchange London Interbank Offered Rate] (SCHO) […]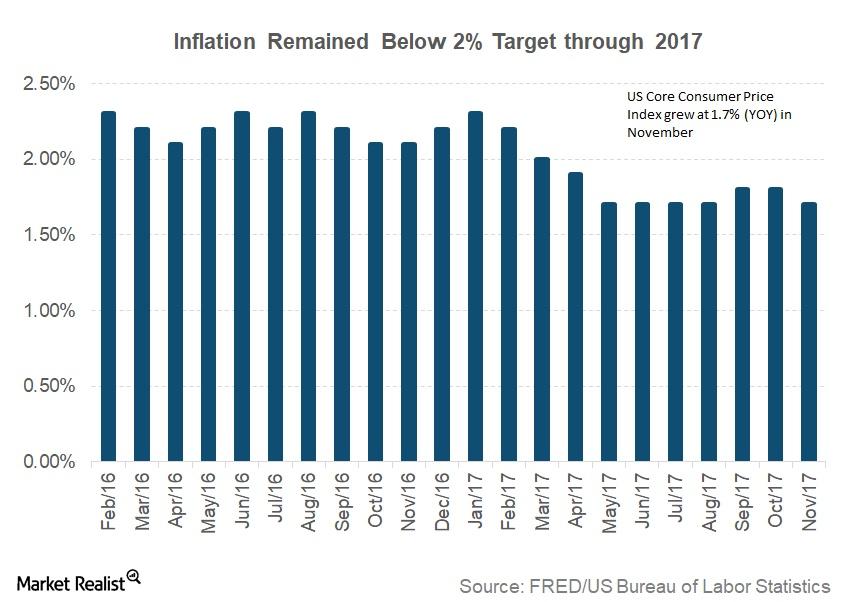
The Curious Case of Low Inflation in 2017
The last statement from the US Fed, which was released with its recent rate hike decision, cited lower levels of inflation but hopes that the inflation target could be achieved in 2018.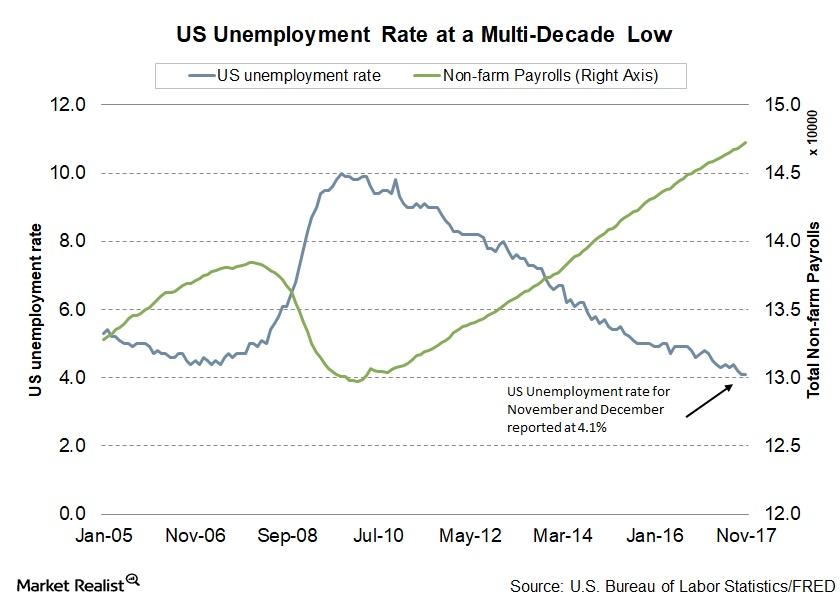
Will US Unemployment Rate Fall below 4% in 2017?
A lower unemployment rate is one of the key objectives of the Fed. In 2017, the unemployment rate fell, reaching 4.1% in its latest November reading.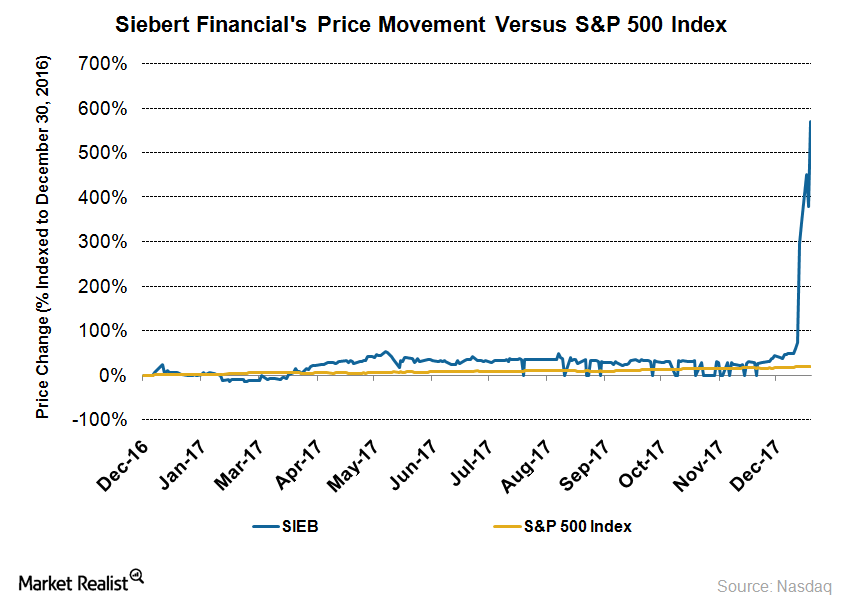
Overstock Invests $1 Million in Kennedy Cabot
tZERO buys 1% stake Overstock (OSTK) has invested $1 million in Kennedy Cabot, which will give it a 1% stake in the brokerage service company. Overstock made the investment through its subsidiary, tZERO. Kennedy Cabot is the parent organization of Siebert Financial (SIEB). It holds a ~90% stake in Siebert. The news offered a massive boost to […]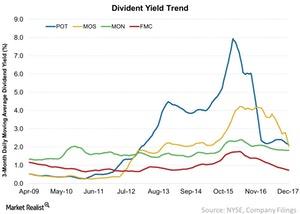
Digging Deeper into Agriculture Stocks’ Dividend Yields: Part 2
In this part of the series, we’ll look at the dividend yield trends for PotashCorp (POT), Monsanto (MON), Mosaic (MOS), and FMC (FMC).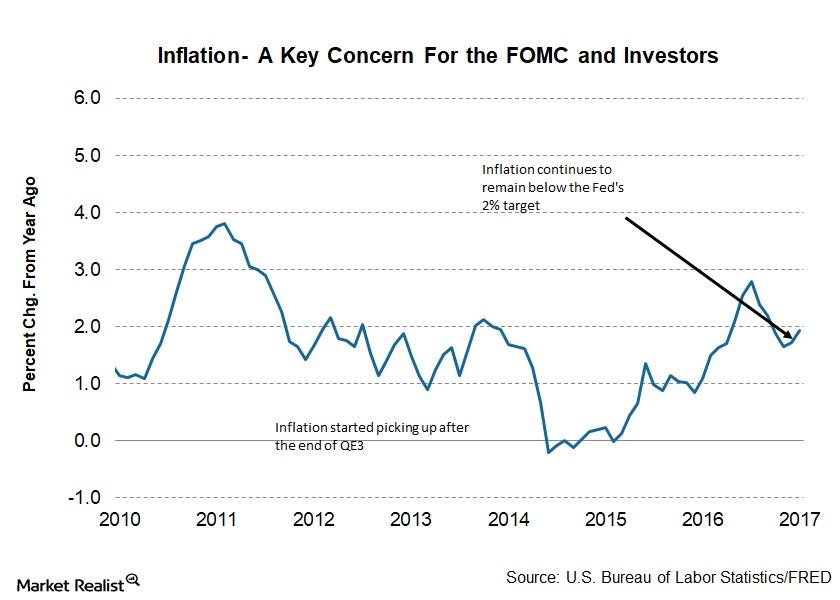
The Primary Cause of Yield Curve Flattening
Interest rates and inflation The pace of interest rate hikes and inflation rate growth have a profound influence on the US yield curve. The US Fed has been communicating its intent to increase interest rates from the current ultra-low level to a target rate of 2.5% over the next few years. The conditions required for […]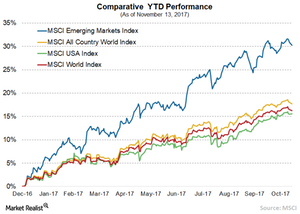
Why Emerging Markets Are Rallying
There are a lot of reasons behind the sharp rally in EMs (SCHE). The prominent reason is that the GDP growth in many of these nations has improved in the last few quarters partially on the back of the rise in commodity prices like copper and oil.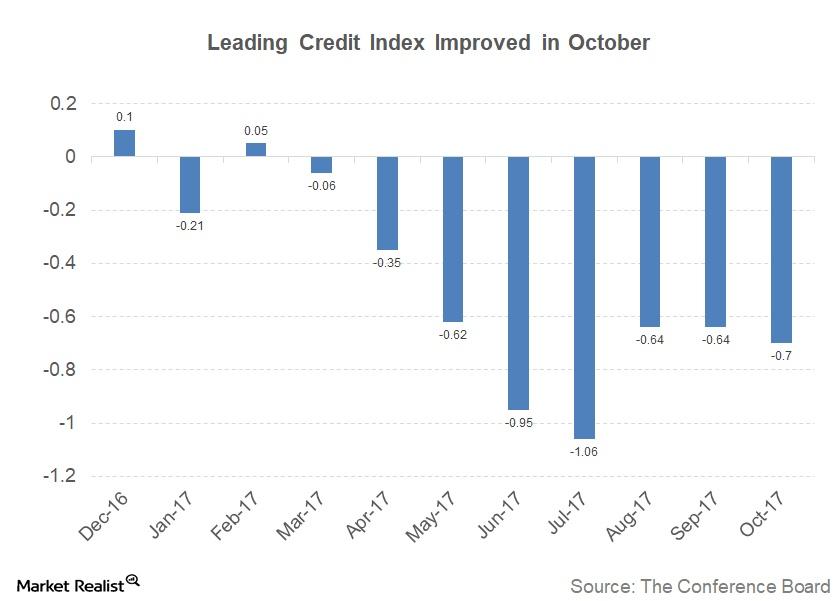
The Leading Credit Index: October Update
The Leading Credit Index for October was reported to be -0.70, improving from the revised September reading of -0.64.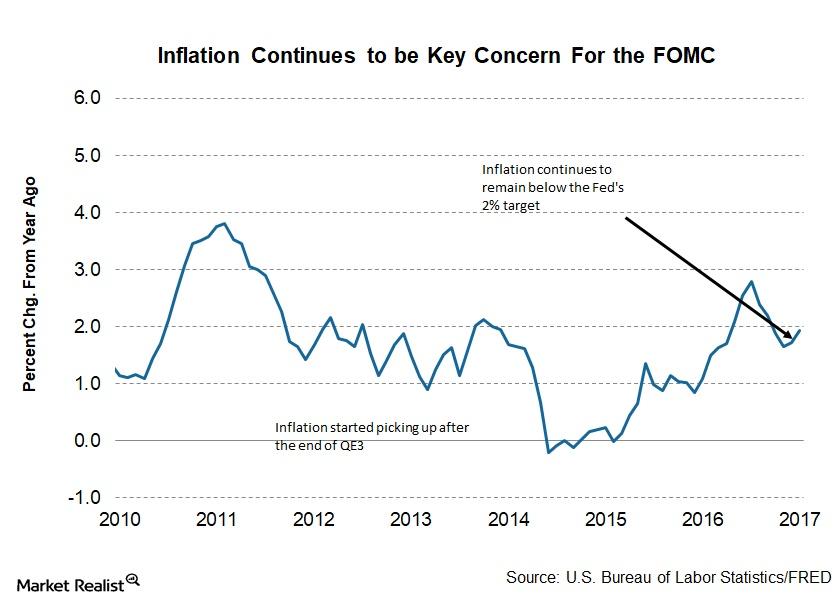
The FOMC’s Outlook for the US Economy
As per economic projections prepared by the FOMC, US real GDP is expected to improve in the final quarter of this year.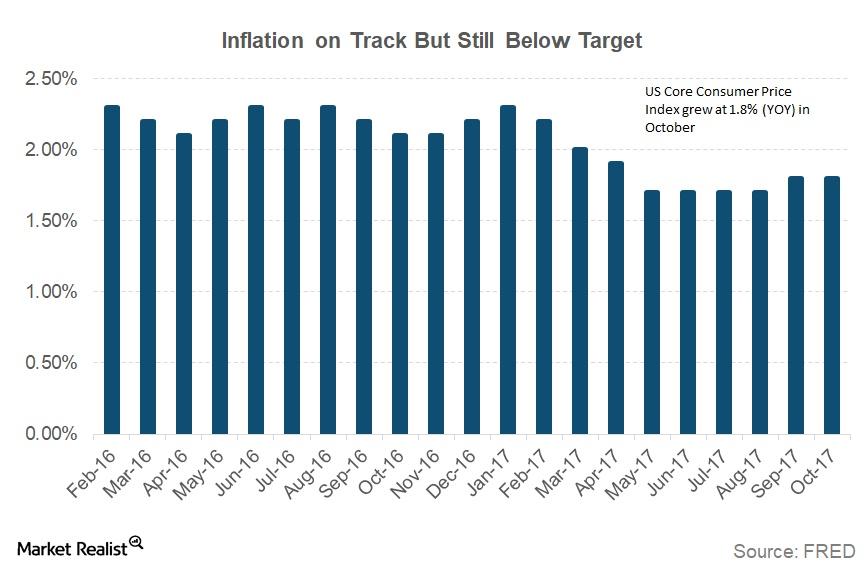
Chart in Focus: The Consumer Price Index Rose in October
The Fed is expected to increase the target funds rate by 0.25% at its December meeting.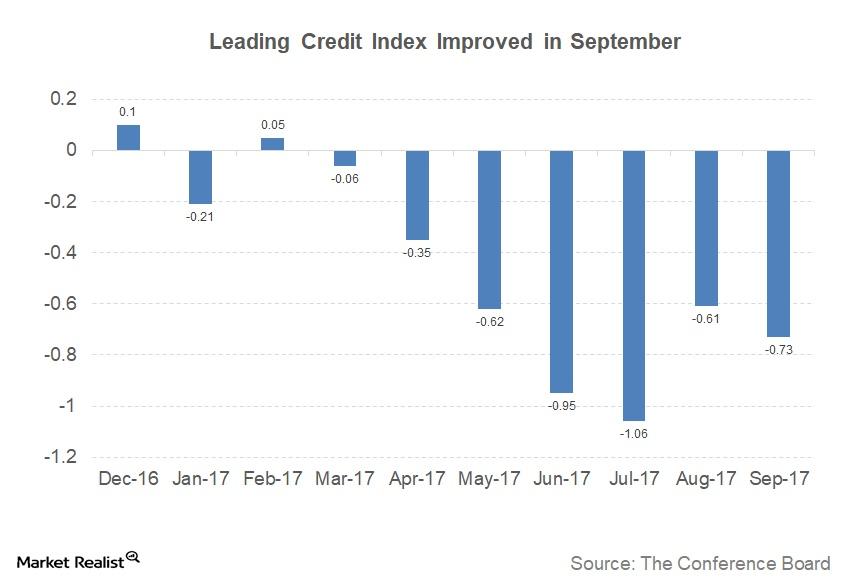
Understanding the Leading Credit Index for September 2017
The Leading Credit Index is an economic model that’s modeled on the performance of six major financial market instruments.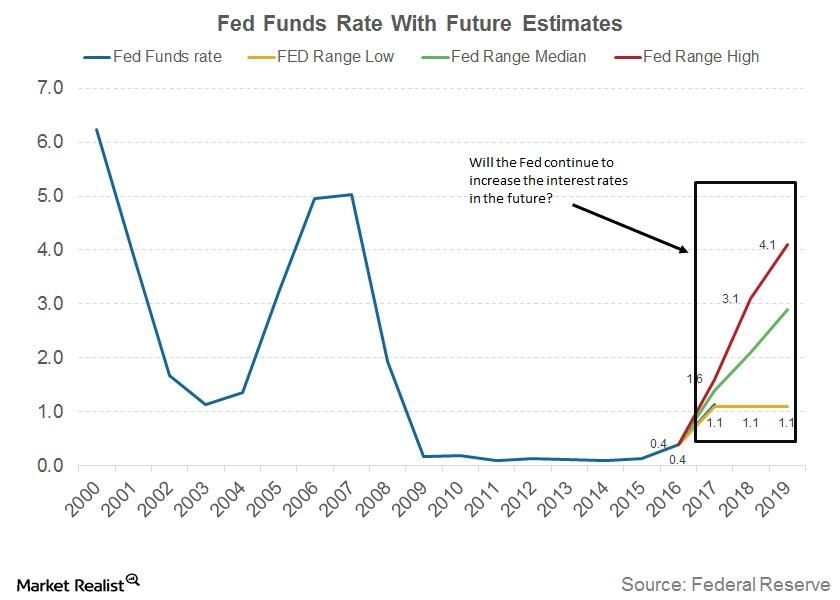
Why a December Rate Hike Shouldn’t Be Taken for Granted
Not all members of the FOMC, according to the minutes of the meeting, were on the same page with respect to a December interest rate hike.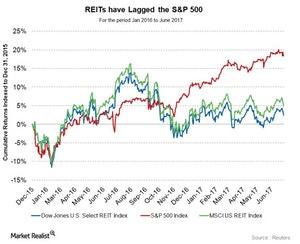
What Investors Should Consider before Investing in REITs
A REIT (or real estate investment trust) is a company that owns and manages income-producing real estate.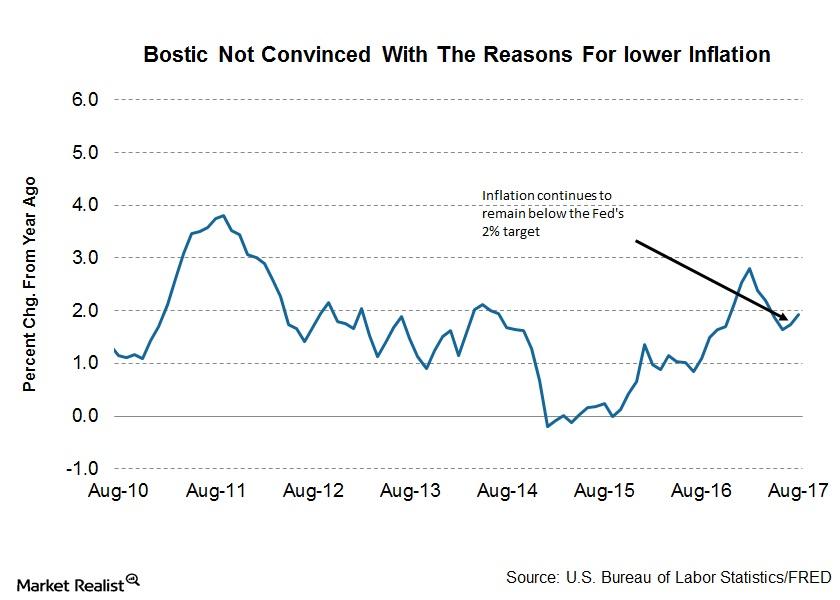
Why FOMC’s Raphael Bostic Is Not Happy with Low Inflation Explanations
Bostic dealt with various reasons that have been cited as reasons for the lower level of inflation—even questioning the common ones.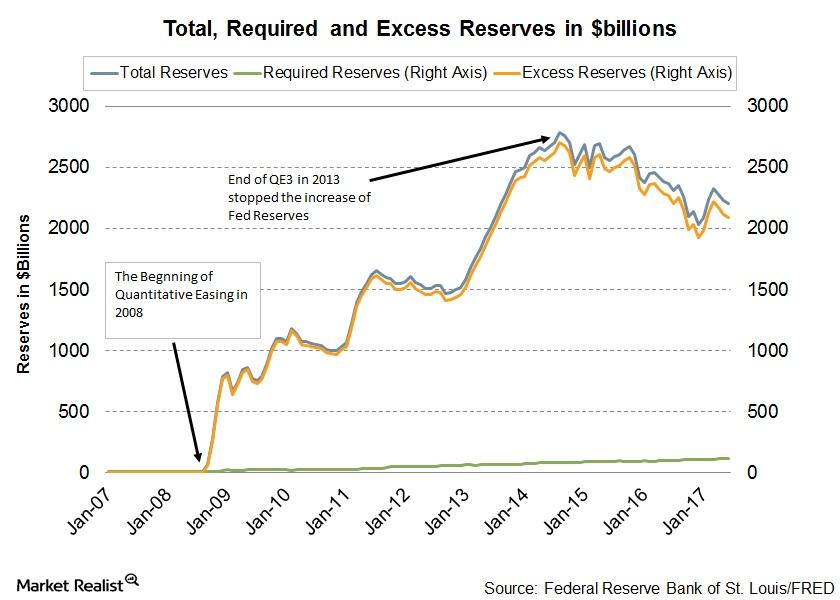
Why FOMC’s John Williams Sees No Impact of Balance Sheet Unwinding on Markets
In the long run, Williams said it would be difficult to predict how markets would react to the Fed’s balance sheet unwinding program.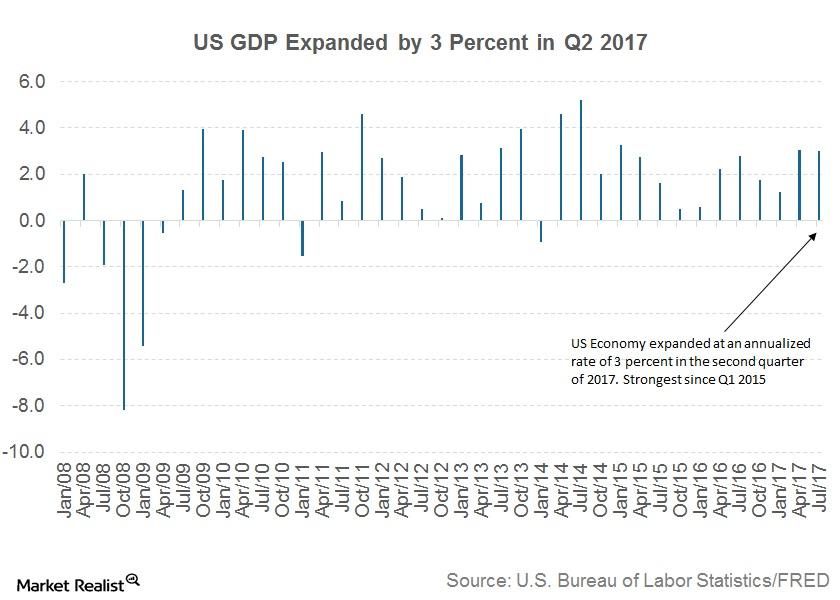
FOMC’s James Bullard Has Three Questions for US Monetary Policy
Bullard said that the current growth rate in the US economy is likely to remain consistent with recent quarterly growth—near the 2% mark.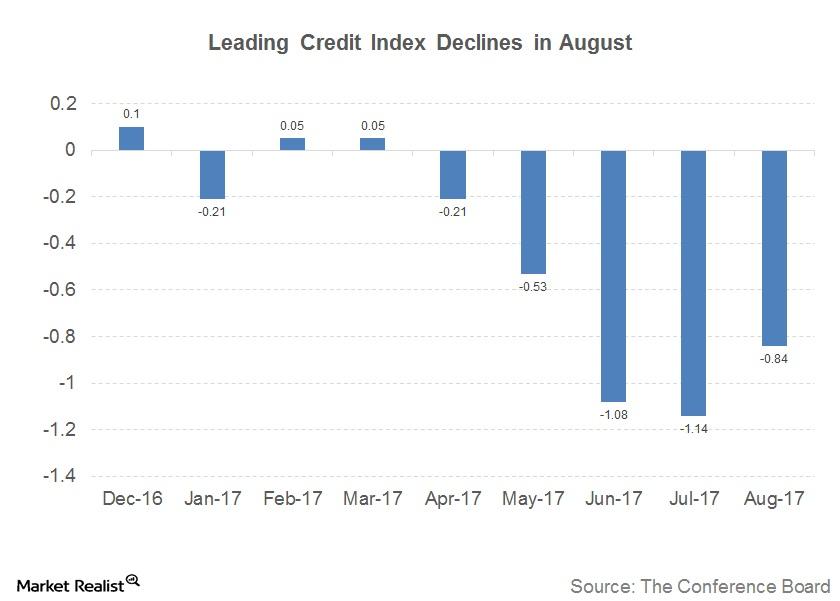
Understanding the Leading Credit Index
Understanding the Leading Credit Index The Conference Board LCI (Leading Credit Index), a constituent of the LEI (Leading Economic Index), is constructed based on the performance of six financial market instruments. These components track lending conditions in the US economy. Performance of the LCI Improving credit conditions are considered positive for the economy. When the LCI […]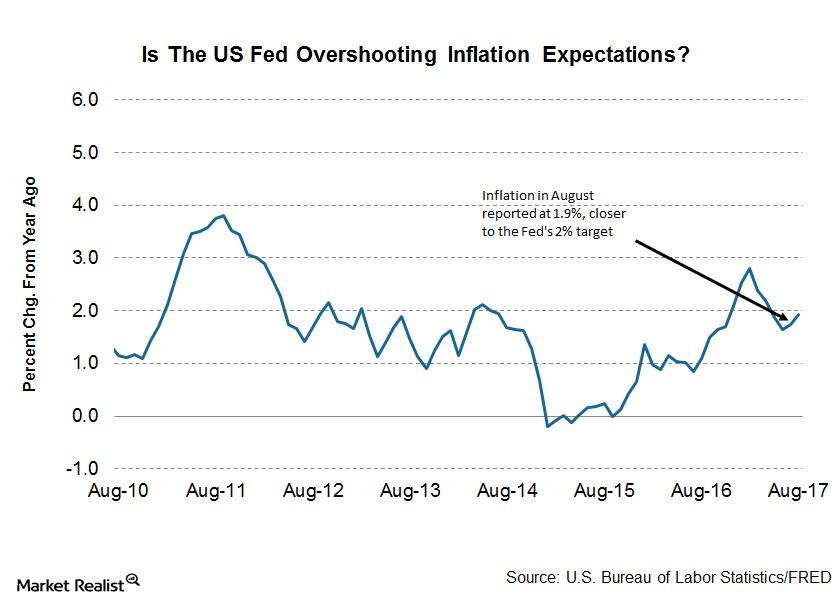
Do Markets Agree with Janet Yellen on Low Inflation?
In her post-meeting press conference, US Federal Reserve Chair Janet Yellen seemed less worried than expected about the current state of US inflation.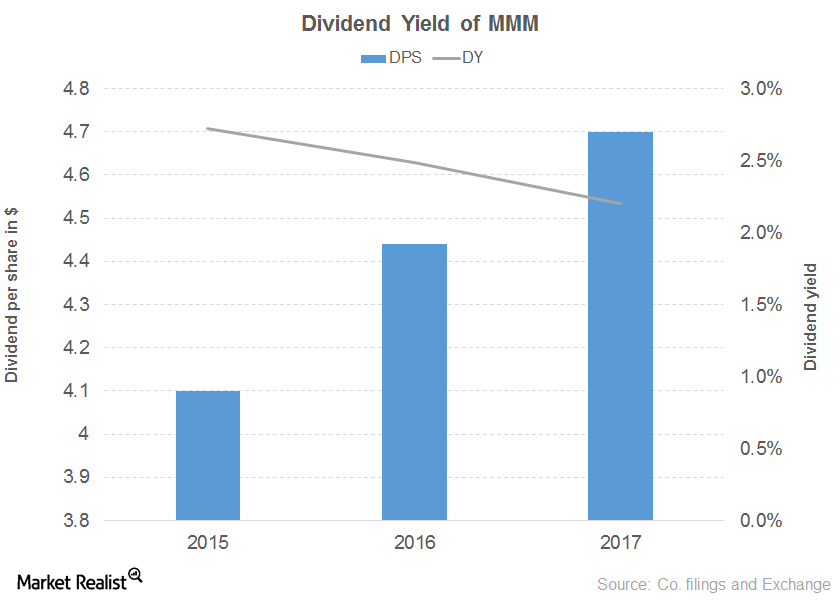
How Does 3M’s Dividend Yield Curve Look?
3M has recorded a 3.0% revenue growth in the first half of 2017, driven by growth in every segment and flat growth in the consumer segment.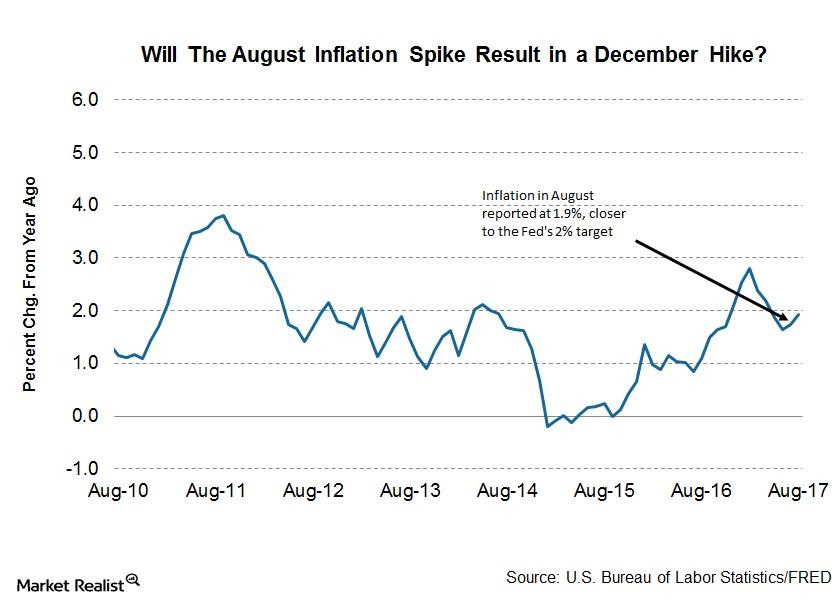
Is the Uptick in August Inflation Enough for a Fed Hike in December?
Slow US inflation growth has been a concern for the US Fed and was one of the key reasons that the Fed raised interest rates only twice in 2017.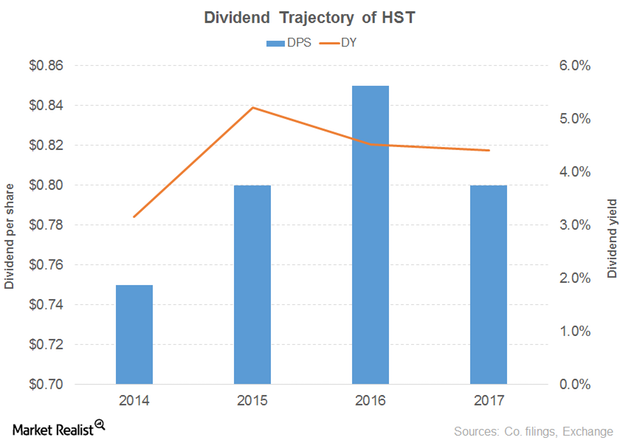
Host Hotels & Resorts’ Dividend Yield over the Years
Revenue and earnings Host Hotels & Resorts (HST), a hotel REIT, is involved in the possession and operation of US hotel properties. The company’s revenue was almost flat in 2015 and 2016, driven by rooms and food and beverages. Its operating costs and expenses rose 1%–2% in 2015 and 2016., while its interest expenses fell 32% […]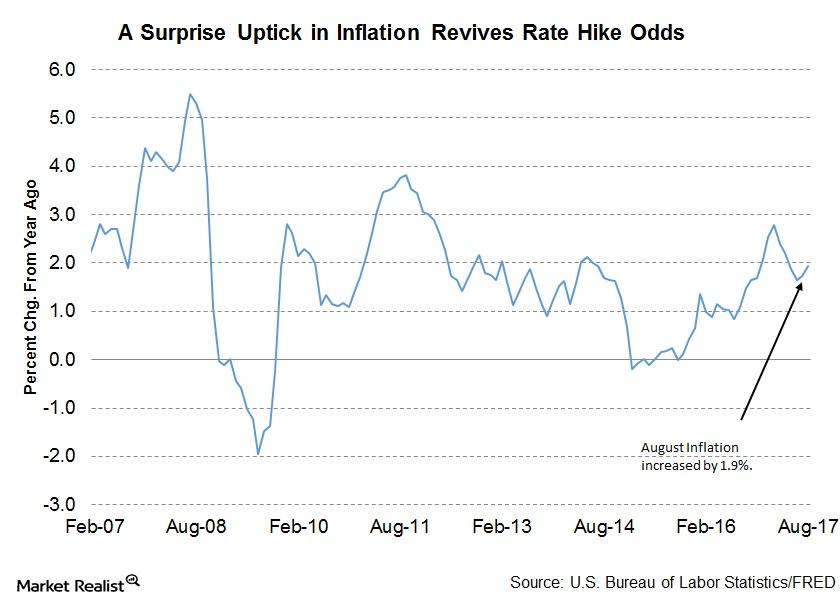
Will the Sudden Rise in Inflation Change the US Fed’s Outlook?
The consumer price inflation (CPI) data reported on Thursday indicated an increase of 0.4% in August. The year-over-year rate improved from 1.7% to 1.9% for August.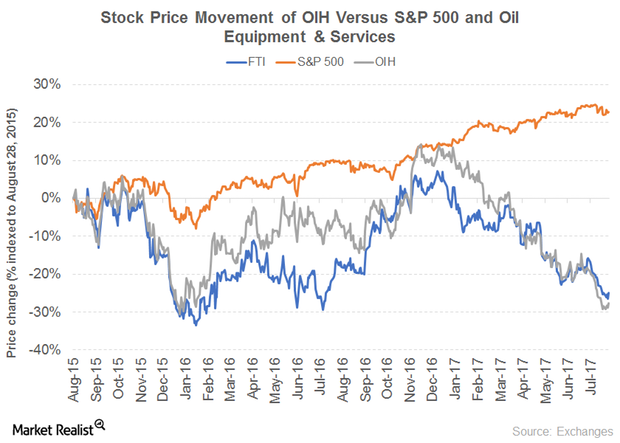
What Could Drive TechnipFMC’s Dividend Yield
How TechnipFMC intends to maintain its yield FMC Technologies and Technip merged to become TechnipFMC (FTI) in 2017, an international provider of subsea, onshore, offshore, and surface projects. The synergy aims to combat the challenges of low oil prices and a challenging outlook through cost cutting and the enhancement of efficiency. The company recorded 51% revenue […]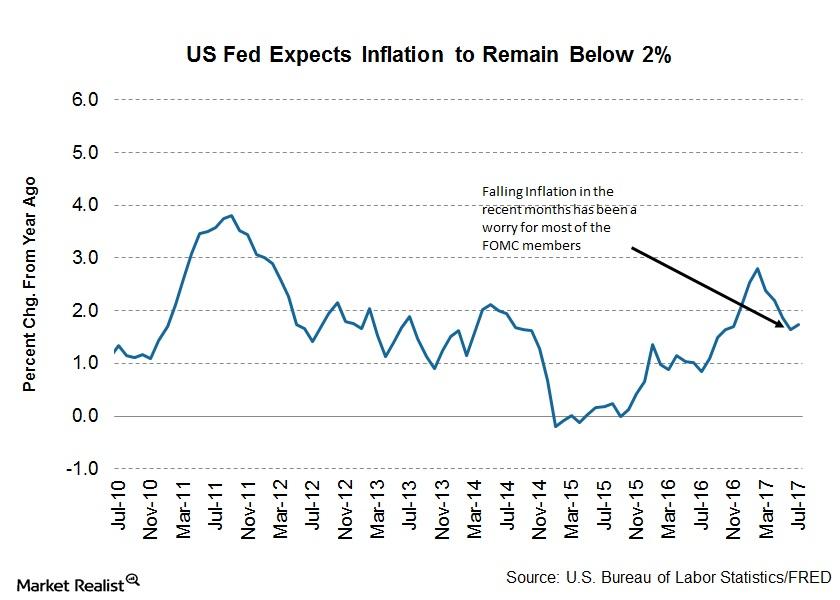
Here’s Why the US Inflation Rate Is Troubling the Fed
In its latest monetary policy statement, the Fed admitted it would take longer than expected for inflation to reach its 2.0% target.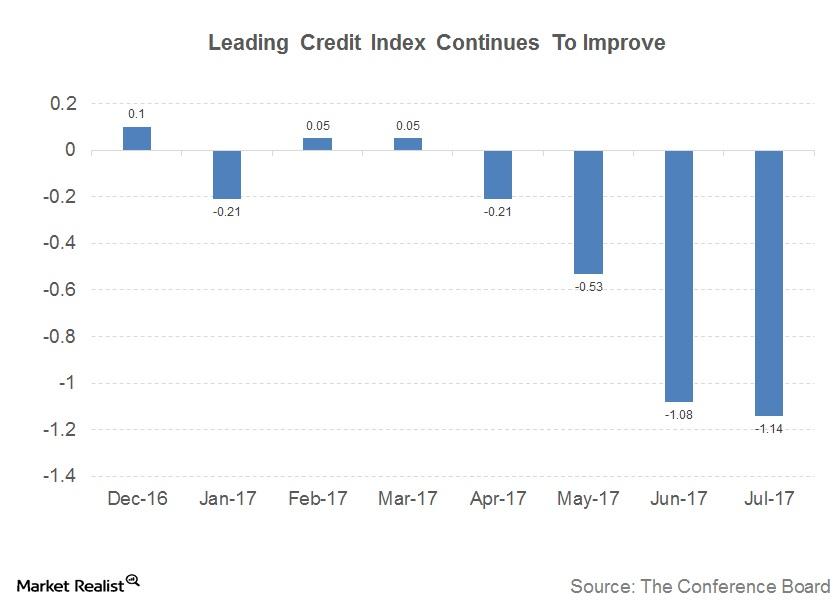
What Financial Markets Predict for the US Economy
Understanding the Leading Credit Index The Conference Board Leading Credit Index (or LCI), which tracks lending conditions in the economy, is reported monthly. The index has six constituents: 2-Year Swap Spread (SHY) (real time) LIBOR[1.London Interbank Offered Rate] 3-month (SCHO) less 3-month Treasury-bill (VGSH) yield spread (real time) debit balances in margin accounts at broker dealers […]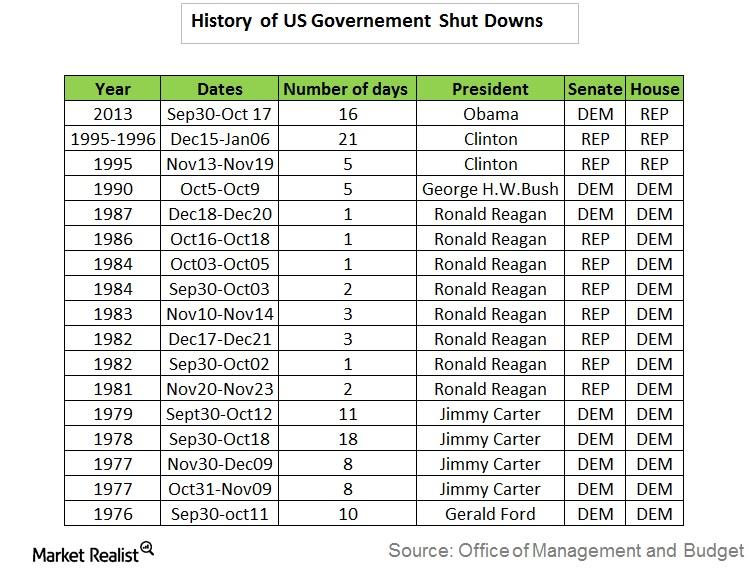
Why the US Government Has Been Shut Down Before
A failure to raise the debt ceiling will likely result in a US government shutdown and a default by the US, which would be catastrophic for the global economy and financial markets (VTI) (USMV).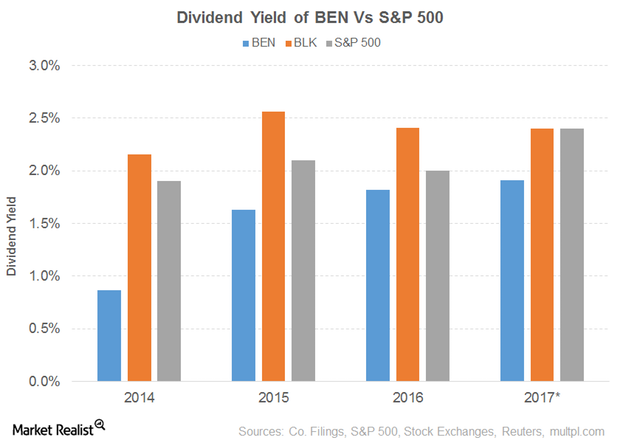
Dividend Yield of Franklin Resources
Franklin Resources (BEN) has recorded consistent growth in dividends since at least March 1982.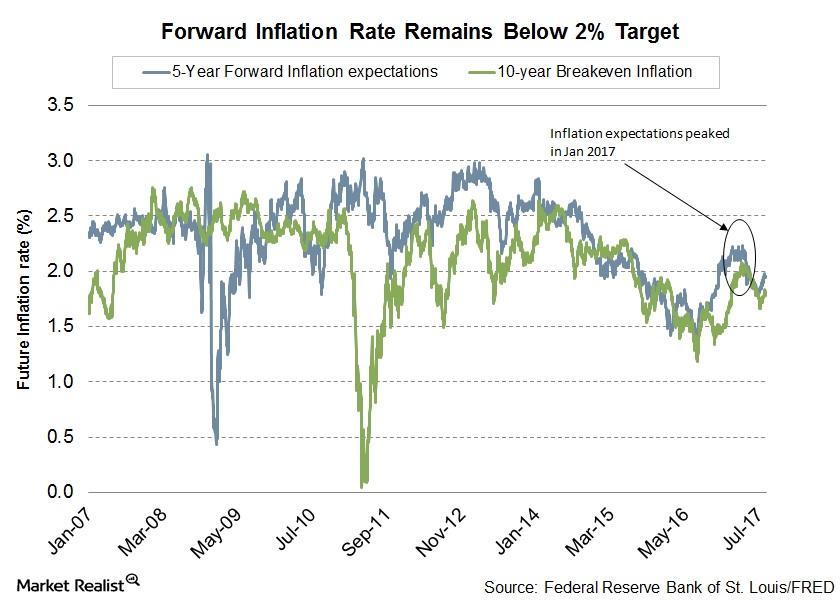
Will the Fed Repeat Its Taper Tantrum Mistakes?
In this cycle of expansion after the great recession, the Fed has started the process of monetary tightening.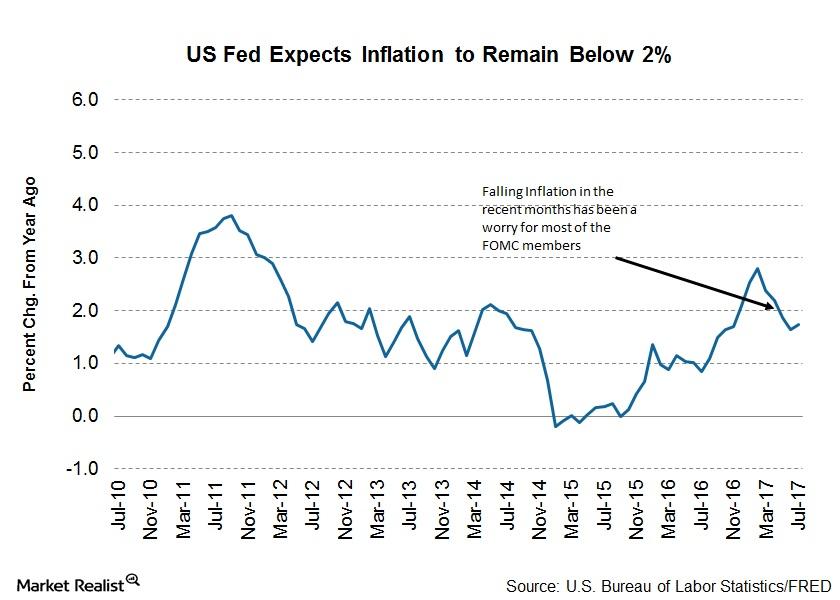
Why Inflation Remains a Huge Concern for FOMC Members
Members of the FOMC (Federal Open Market Committee) attributed the recent slowdown in inflation growth to idiosyncratic factors.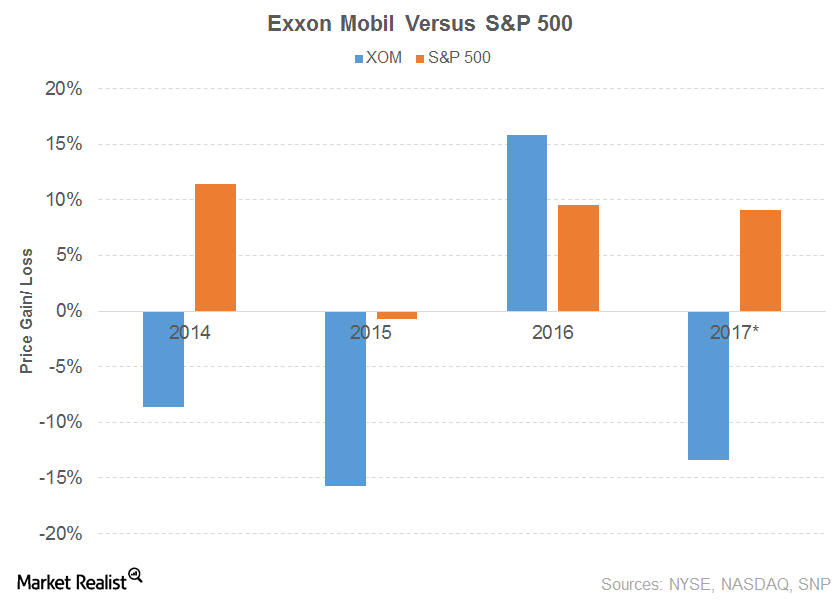
ExxonMobil’s Journey as a Dividend Aristocrat
ExxonMobil’s (XOM) story is similar to Chevron’s. The company’s sales and other operating revenue for 2016 fell 16.0%.
Should We Be Worried about Greenspan’s Bond Market Warning?
Greenspan cites rapid inflation growth as the reason for a bond market collapse. But the markets and Fed officials think otherwise.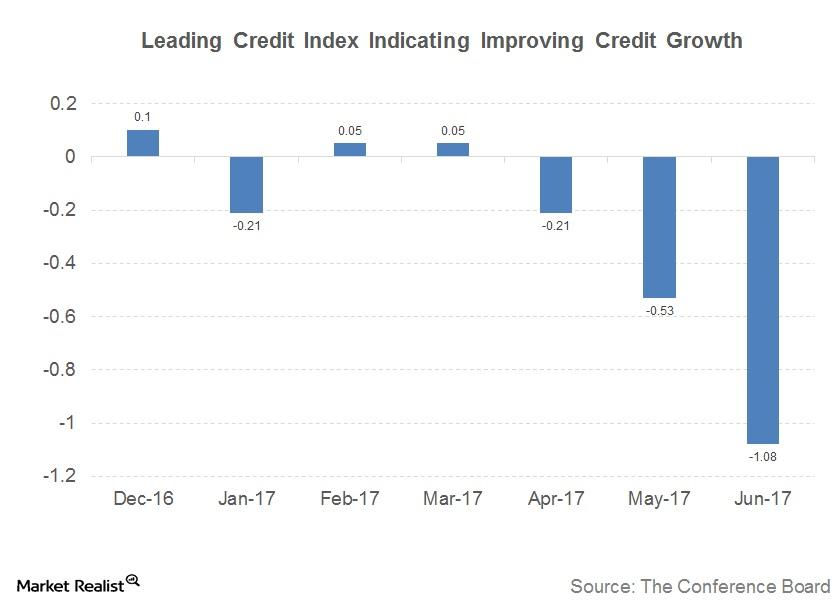
What the Conference Board LEI Tells Us about the Market
The Leading Credit Index is one of the constituents of The Conference Board Leading Economic Index (or LEI), which is reported by The Conference Board on a monthly basis.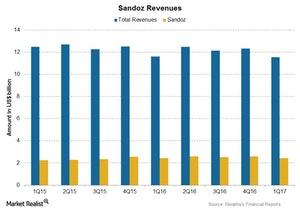
Novartis’s 2Q17 Estimates: How Sandoz Might Perform
Revenues for Sandoz are expected to report operational growth in 2Q17 following an increased demand for biopharmaceuticals.