
Adam Jones
I have been writing for Market Realist since 2014. I currently cover the cannabis sector, and I was drawn to the cannabis industry almost two years ago, when it was just emerging. I was fascinated by the variety of applications this single plant can have.
In addition, I like to explore different industries and am particularly interested in discovering good stocks. In the past, I've also covered the agricultural fertilizer and restaurant sectors.
When I'm not writing for Market Realist, I love reading books based on real-life events. I also enjoy reading biographies of people who have inspired the world in some way.
Disclosure: I am in full compliance with all ethics and other policies for Market Realist research analysts. I am not invested in securities that I cover on Market Realist.
More From Adam Jones
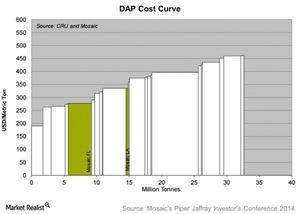
Where Does Mosaic Stand on the Cost Curve for Its Fertilizers?
Fertilizer prices and input costs affect all players in the industry. Survival and profitability come down to where a company stands on the cost curve.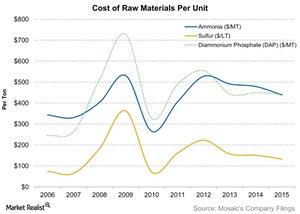
How Has Mosaic Done in Terms of Raw Material Costs?
Mosaic purchases certain raw materials at fixed costs to be consumed over time, but the selling prices of its finished goods can fluctuate rapidly.
Who Are Mosaic’s Customers and How Does It Reach Them?
Mosaic doesn’t sell directly to farmers. Its customers include cooperatives, wholesale distributors, retail chains, and independent retailers.
How Phosphate Fertilizer Prices Are Changing Trends
In the 2010–2011 planting season, phosphate fertilizers accounted for about 23% of total NPK fertilizers consumed globally.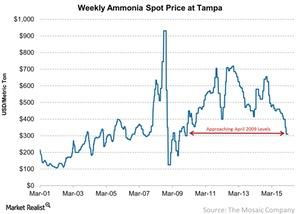
Ammonia Prices Fell Slightly from the Previous Week
Ammonia was trading at $310 per metric ton as of the week ending March 4, 2016. It fell $1 from the previous week ending February 26, 2016.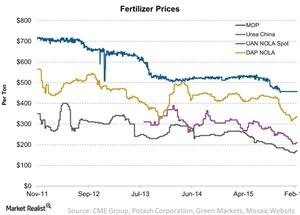
An Update on NPK Fertilizer Price Trends
Fertilizer prices have fallen significantly over the years. But more recently, prices are showing a trend reversal for urea, UAN, and phosphate fertilizer.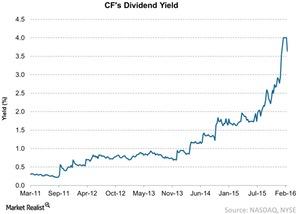
Checking in with CF Industries’ Dividend Yield
As of February 19, CF Industries pays a quarterly dividend of $0.3 per share. In 2015, it paid an annual dividend per share of $3.6—down from $5 in 2014.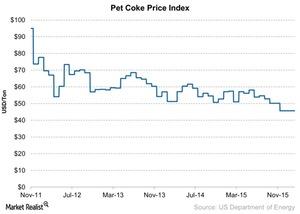
What’s Happening to Pet Coke Prices?
Coal, or petroleum coke, is widely used by nitrogen fertilizers producers in China. Declining coal prices negatively impact natural gas-based producers.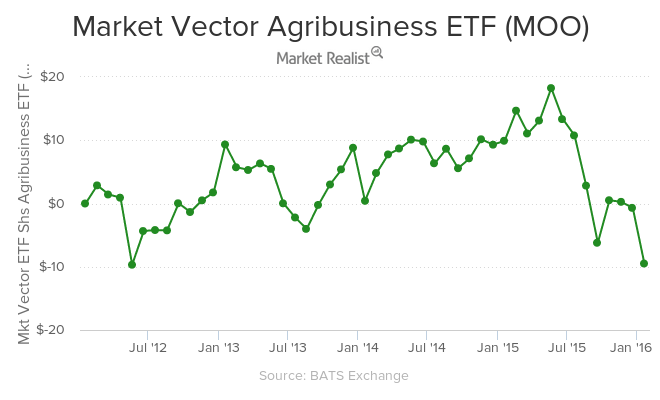
The Prevalent Price of Potash in 2016
As of January 19, 2016, the VanEck Vectors Agribusiness ETF (MOO) returned -12.7% in 2015. YTD as of January 19, the ETF is down by 8%.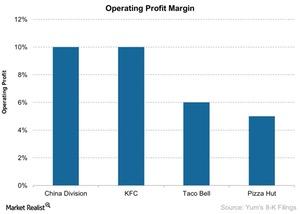
The Operating Profit Margins for Yum! Brands in 2016
Let’s examine the management’s target for the restaurant operating margins for each of Yum! Brands’ divisions in 2016. Please note that the data excludes India.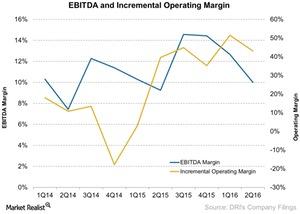
How Darden’s Incremental Margins Have Expanded
A company’s incremental operating margin is calculated as the change in operating income divided by the change in revenue over a period.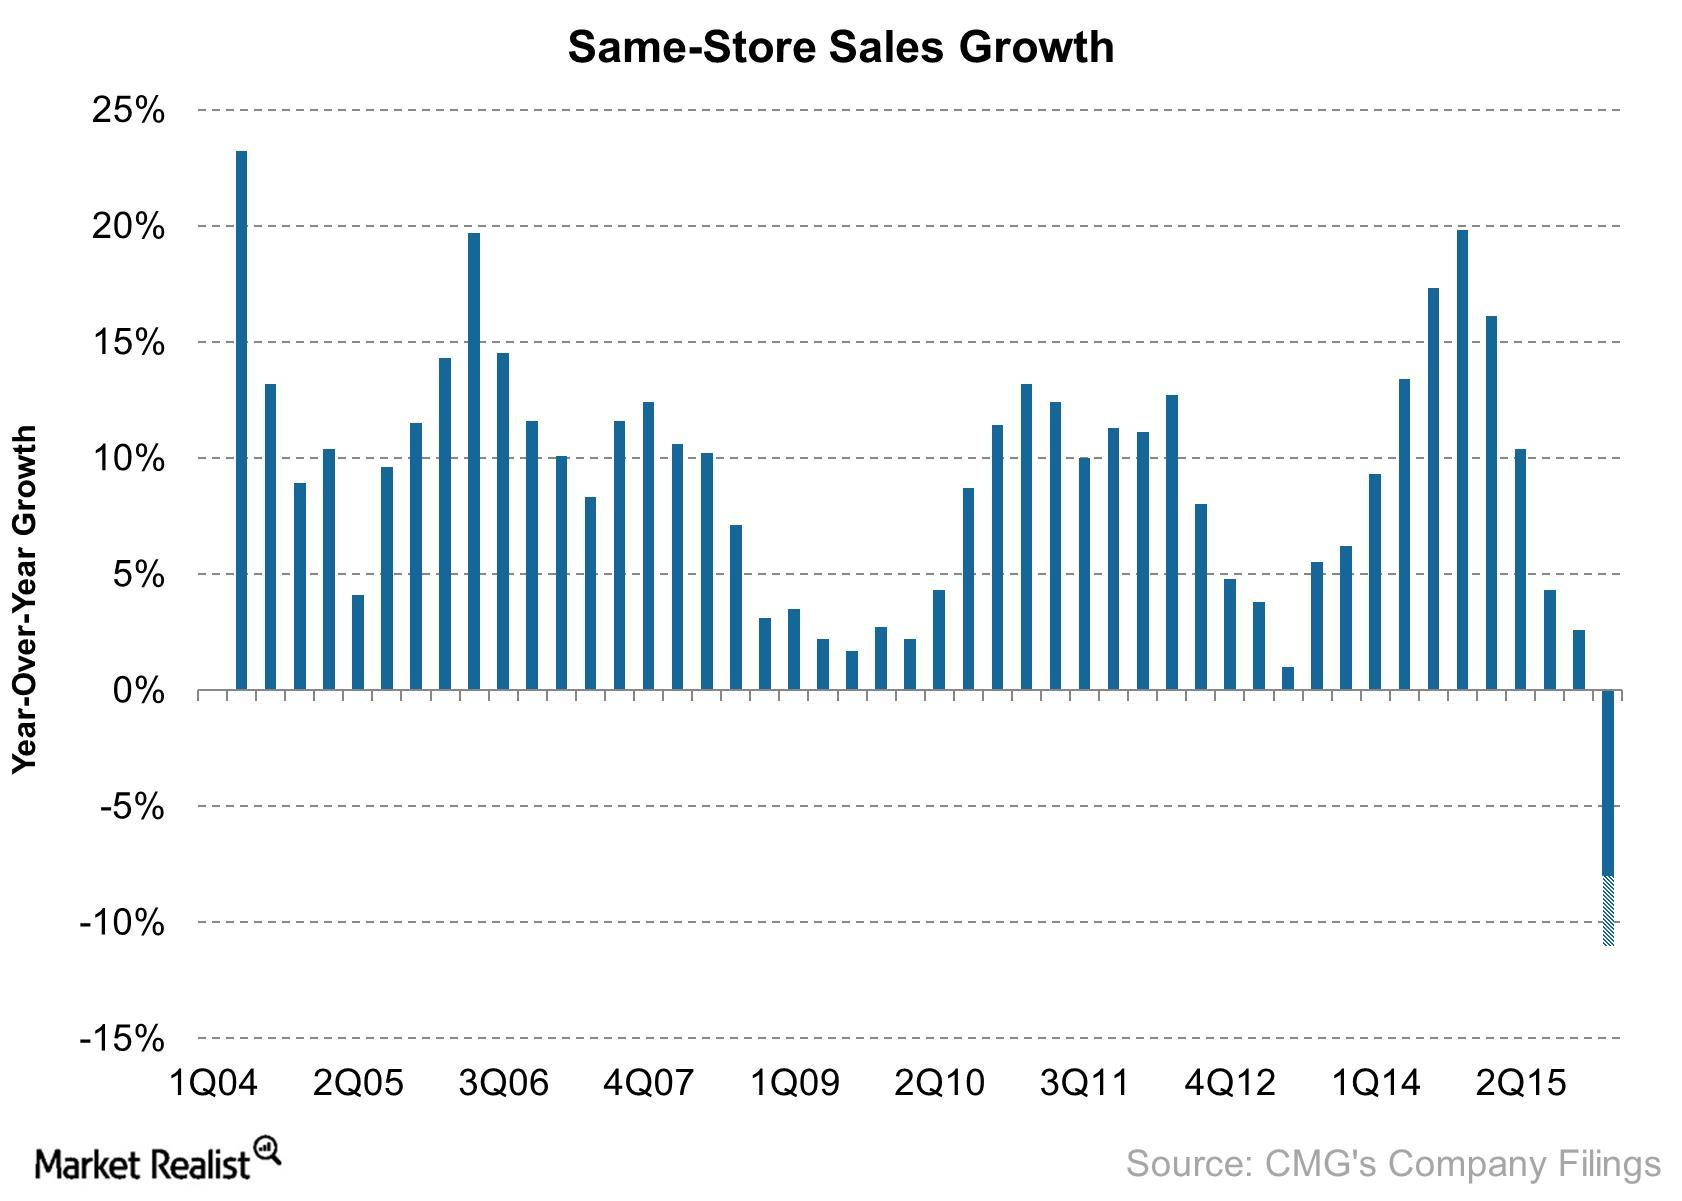
Chipotle May Report First Negative Same-Store Sales Growth in 4Q15
Chipotle expects its 4Q15 same-store sales growth to range from -8% to -11%. This would be the first time in almost ten years the company expects to report negative same-store sales growth.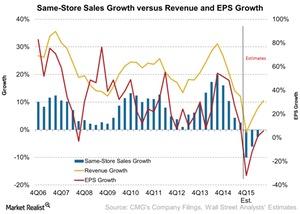
How Much Could the E. Coli Outbreak Affect Chipotle?
When the first cases of E. coli were linked to Chipotle, the company shut down 43 of its restaurants for a week.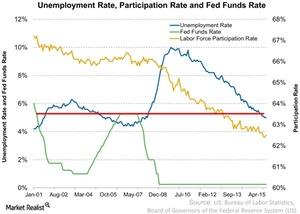
Why Unemployment Rate Matters to Restaurants
While the latest unemployment rate indicates that the US economy is healthy, it’s important to remember that the labor force participation fell over time.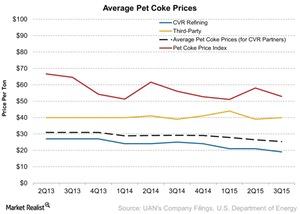
How CVR Partners Benefits from Pet Coke Prices
Unlike other companies, CVR Partners (UAN) uses petroleum coke, or pet coke, to produce nitrogen fertilizers.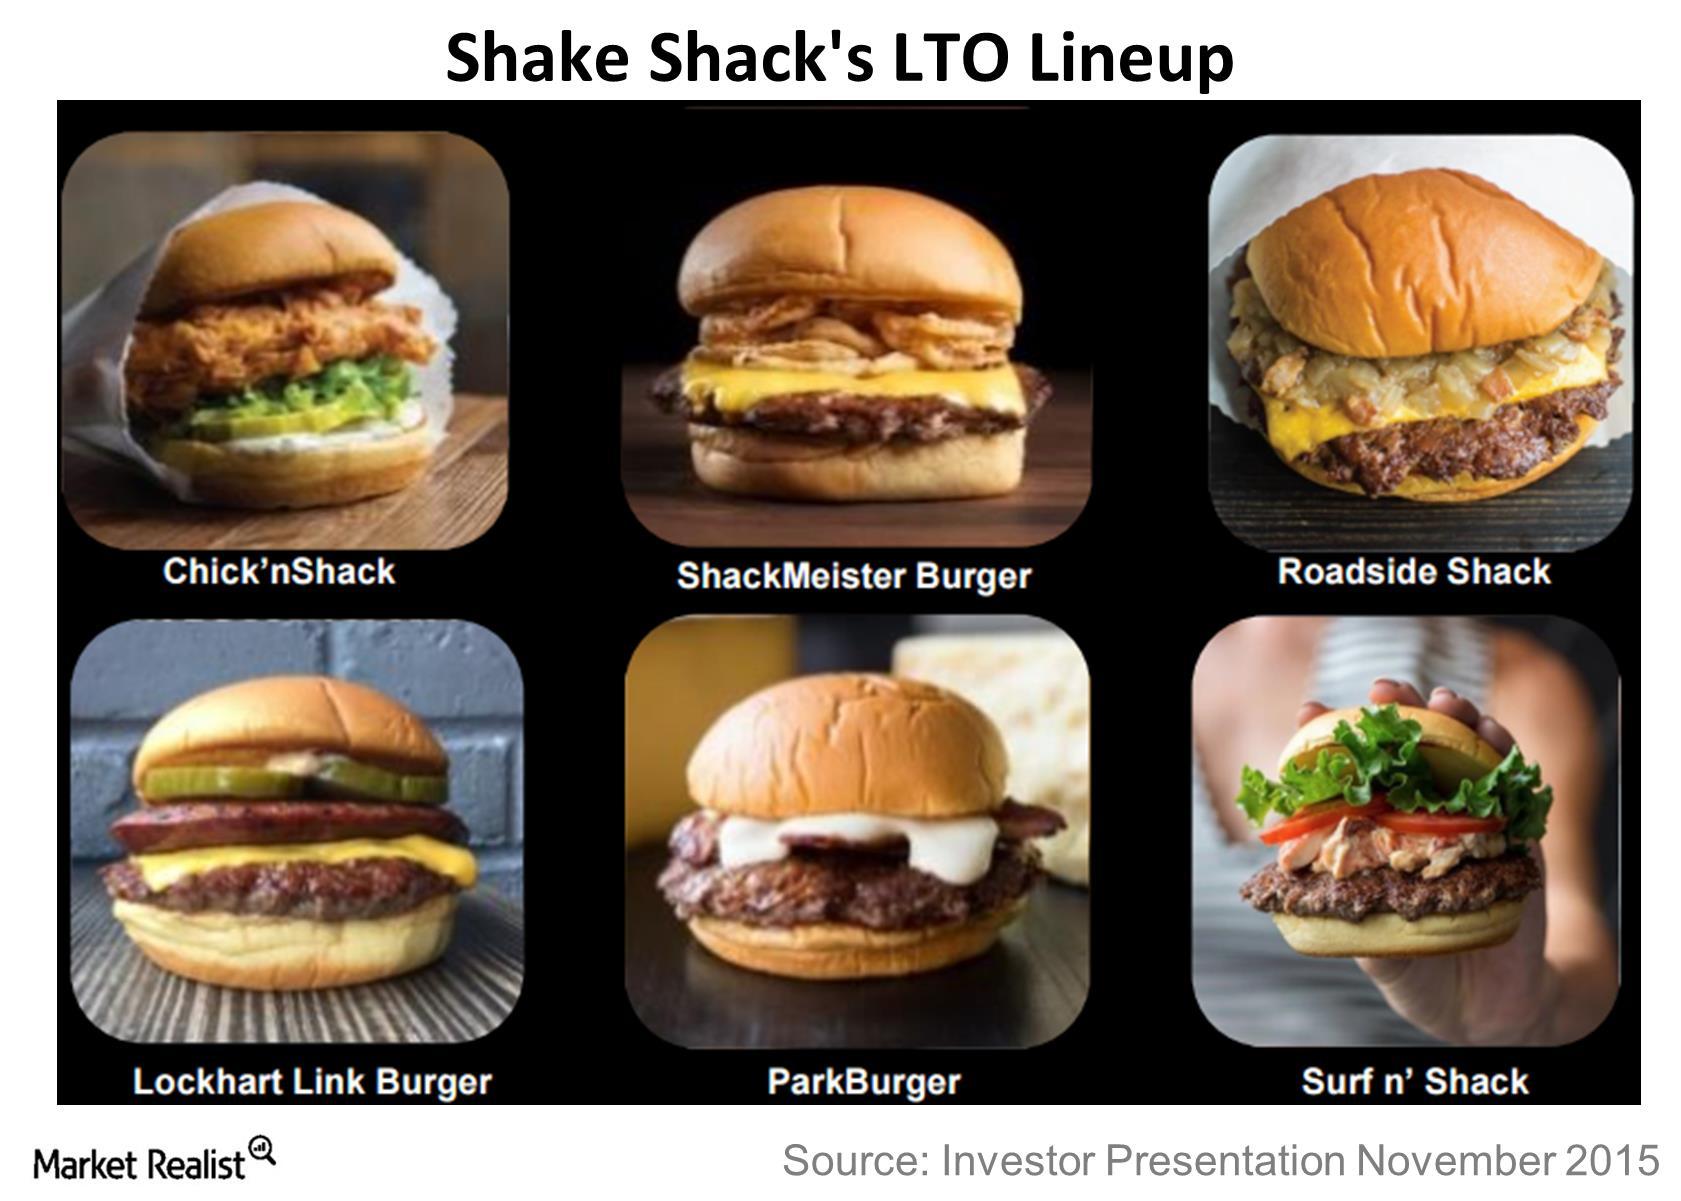
How Limited-Time Offers Can Help Shake Shack’s Top Line
Shake Shack stated that its limited-time offers, the ShackMeister Burger and Roadside Shack, have been “big drivers” for its ticket and traffic growth.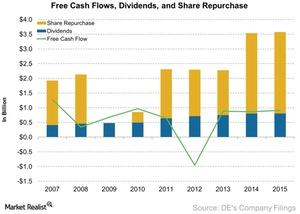
Analyzing Deere’s Free Cash Flow Growth and Cash Management
One of the ways to calculate free cash flows is by deducting capital expenditures from the company’s operating cash flows.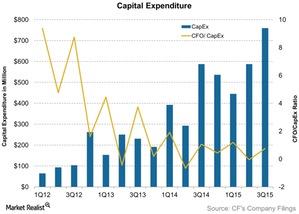
What is CF Industries’ Capital Expenditures Ratio Telling Us?
CF Industries’ cash flow to capital expenditure ratio has been falling. CF Industries’ cash flow to capital expenditure ratio stands at 0.75 as of 3Q15.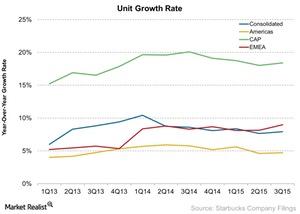
Why the CAP Segment Is the Next Big Market for Starbucks
Starbucks has about 5,239 restaurants in the CAP segment. It’s growing units at an average of 18.4% compared to the rest of the regions.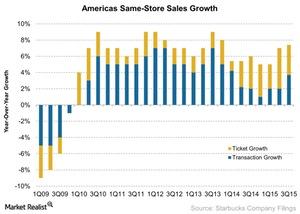
What to Expect from Starbucks’ Same-Store Sales Growth in 4Q15
Same-store sales growth is one of the key revenue drivers for a restaurant company like Starbucks (SBUX), McDonald’s (MCD), and Darden Restaurants (DRI).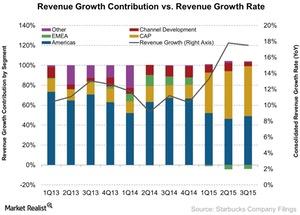
Starbucks’ Key Segments for Its 4Q15 Earnings
Starbucks (SBUX) operates restaurants in 65 countries around the world. However, 83% of its revenue comes from the Americas and the CAP segments.
Will McDonald’s Separate Its Real Estate Portfolio?
One of the key reasons why McDonald’s (MCD) stock has remained firm is because of its real estate portfolio.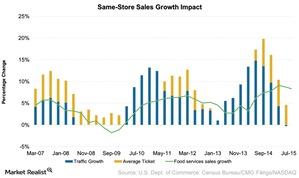
Will Chipotle Report Low Same-Store Sales Growth in 3Q15?
Chipotle (CMG) experienced tremendous same-store sales growth in 2014, with most of its quarters reporting a double-digit growth.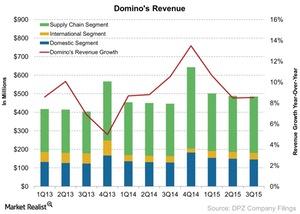
Why US Economic Activity Is Important to Domino’s Pizza
Although Domino’s is spread over 75 countries, most of the company’s revenue comes from domestic markets and is more sensitive to economic conditions in the US.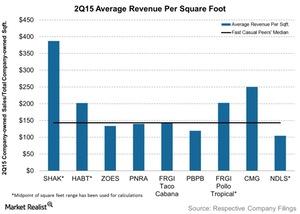
Comp: Average Revenue per Square Foot of Fast Casual Restaurants
Average revenue per square foot gives us insight into how efficiently a company is able to generate sales. Naturally, the higher the number, the better.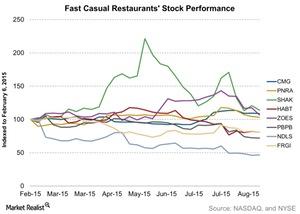
A Comparative Analysis of 8 US Fast Casual Restaurants
In this series, we will delve into a comparative analysis of eight restaurants under the fast casual category.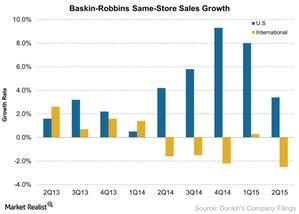
Why a Weak 2Q15 for Baskin-Robbins May Not Be a Negative Signal
In 2Q15, Baskin-Robbins’s US same-store sales growth rate fell to 3.4% compared to 4.2% a year ago. This was driven by ongoing promotions and discounts and a 75% increase in online cake ordering.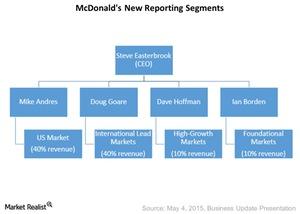
Is McDonald’s Turnaround Plan Working?
McDonald’s (MCD) turnaround plan, which went into effect on July 1, 2015, will take several months to yield results as far as the company’s performance goes.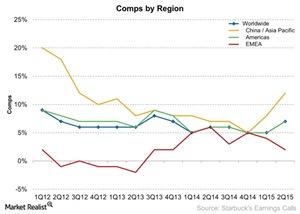
How Starbucks Is Leveraging Its Star Rewards Program
According to Starbucks (SBUX) management, the company’s My Starbucks Reward program helps increase customer loyalty.
Technology: The Driving Force behind Domino’s Pizza
Domino’s continues its investment in the technology space with its recent launch of Domino’s pizza delivery tracker available on Apple Watch.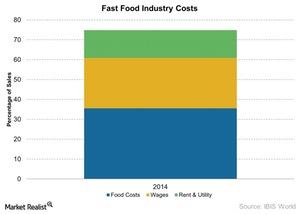
How Commodities Play an Important Role in the Restaurant Industry
Agricultural and livestock commodities such as corn, coffee, beef, pork, chicken, and cheese play an important role in the restaurant business, as demand and supply factors impact prices.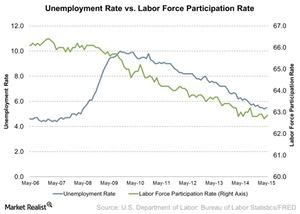
How Unemployment and Labor Participation Rates Affect Restaurants
A tight labor market with low unemployment and participation rates puts pressure on restaurant companies to raise wages to retain their employees.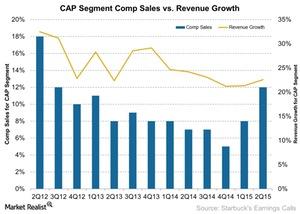
Starbucks Makes China Another Feather in Its Cap in 2015
There’s strong acceptance of the Starbucks loyalty program in China, with 40% of transactions completed using the Starbucks card.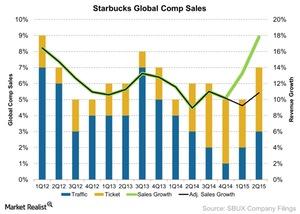
Starbucks Relies on Comps to Drive Revenue Growth
The Americas and the CAP (China, Asia-Pacific) segments have been the biggest contributors toward Starbucks global comps growth.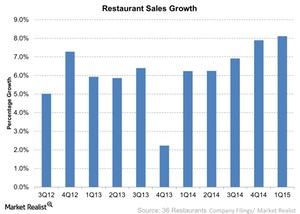
Factors That Influence the Restaurant Industry
Over the past 12 months, the restaurant industry has experienced significant sales growth. In this series, we’ll look at certain indicators that investors in this sector should track.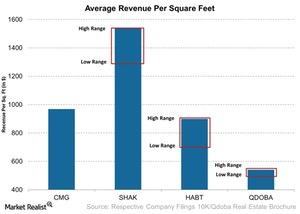
Chipotle’s Revenue Per Square Foot: Two Times More than Qdoba’s
Chipotle’s average restaurant size is about 2,550 square feet. With an average restaurant volume of $2.4 million, the revenue per square foot comes to $969.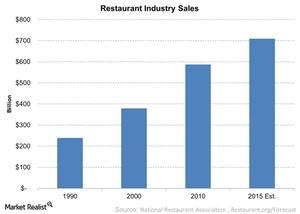
Key Indicators for Restaurant Industry Growth
Restaurant industry sales have experienced growth in the past 12 months. Sales are poised to grow to $709 billion.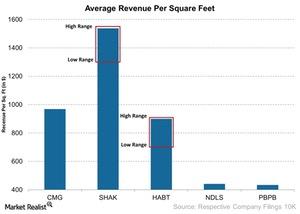
How Shake Shack’s Revenue Per Square Foot Compares with Peers
The recent rally in Shake Shack’s share prices—without any new catalyst—may indicate that investors are optimistic about the company’s prospects.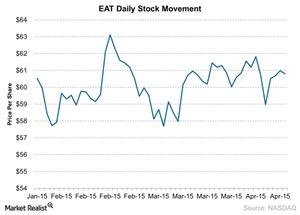
Brinker International Up 3.9% Since Its Previous Earnings Release
EAT should release its 3Q15 earnings on April 21. YTD, the stock increased 3.9% as of April 14 and has increased ~1% since its previous earnings release.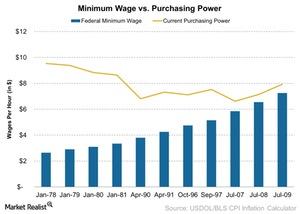
The Eroding Purchasing Power of the Minimum Wage Worker
While the absolute minimum wage has increased, when adjusted for inflation in 2015, its purchasing power has declined.
Dunkin’ Brands Diversifies Its Daypart Focus
Dunkin’ Brands is now expanding into the afternoon daypart in order to win customers in a different daypart and improve sales leverage.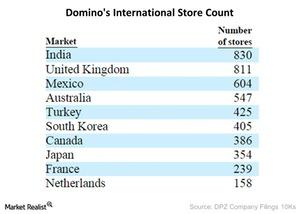
Domino’s Pizza and Its Master Franchise Model
The master franchise agreement gives the master franchisee operating rights to a supply chain in a given international region.
Why Domino’s Pizza Has So Much Debt
Domino’s debt is high because it was the product of a leveraged buyout. The latest recapitalization happened in 2012, leaving it with $1.57 billion in debt.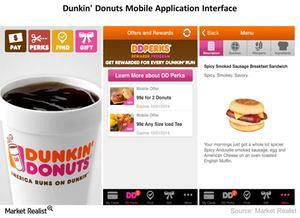
How Dunkin Donuts Is Embracing Technology
Dunikin’ is embracing technology with a phone app that allows you to search Dunkin’ Donuts locations, see nutritional information, and gift Dunkin’ treats.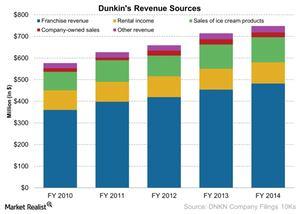
What are Dunkin’ Brands’ Five Sources of Revenue?
Dunkin’ Brands’ (DNKN) sources of revenue include franchise revenue, sale of ice cream products, company-owned sales, rental income, and other income.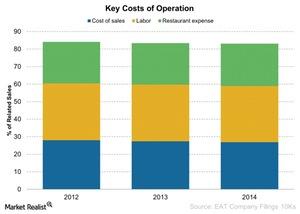
Brinker International’s Key Costs of Operations
Brinker incurs key costs of operations to run its company-owned restaurants, including cost of sales, labor and related costs, and rent and other costs.
Dunkin’ Brands Has a Nearly 100% Franchise Model
Benefits to a franchise model include low need for capital, more focus on brand in marketing and menus, and a potential to penetrate faster into the market.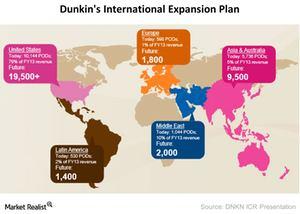
Dunkin’ Brands’ International Development Plan
As of December 2013, Dunkin’ Brands had 5,736 points of distribution (or POD). In its International Development Plan, it plans to expand that to 9,500.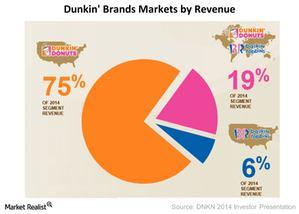
US Market Still the Biggest for Dunkin’ Brands
Dunkin’ Donuts is Dunkin’ Brands’ most important brand, with 77% of the revenue or $568 million in 2014. Of this, $548 million was from the US market.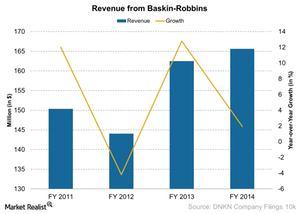
Baskin-Robbins’ Four Year Revenue Trend
As of 2014, there were about 2,500 Baskin-Robbins locations in the United States and about 5,000 locations in the international market.