Schlumberger NV
Latest Schlumberger NV News and Updates
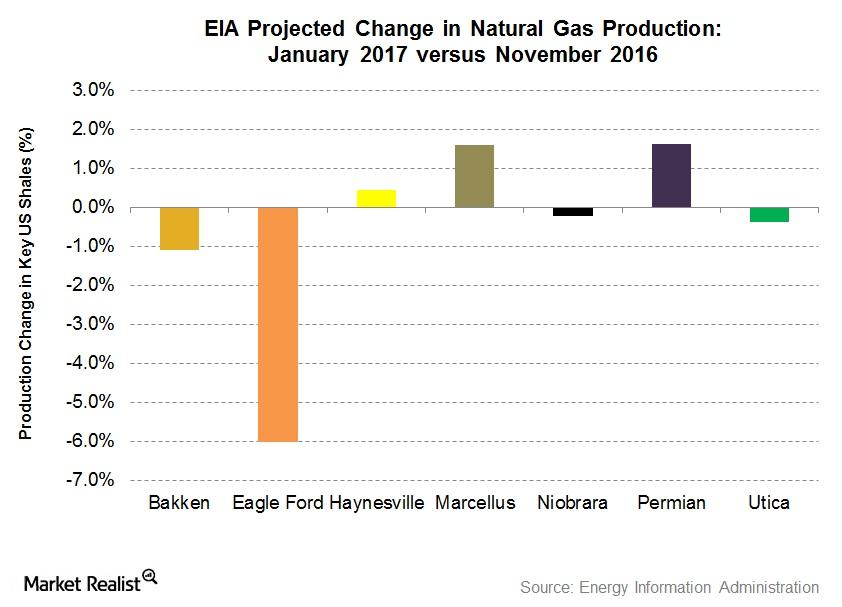
January 2017 EIA Estimates: US Shale Gas Production Could Fall
The EIA expects less natural gas production at four key US shales by January 2017 compared to November 2016. It expects production to rise at three key US shales.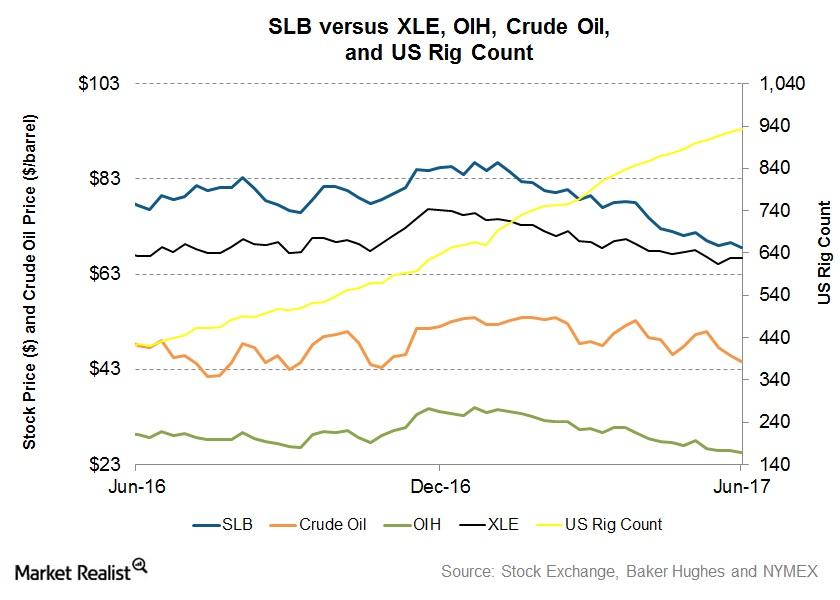
Inside Schlumberger’s 1-Year Returns as of June 16
Schlumberger’s trailing-one-year stock price has fallen 12% as of June 16, 2017, while XLE, the broader energy industry ETF, has fallen 3%.Energy & Utilities Why improvement in Libya pushed down the crude price last week
For most of the last two years, WTI crude oil has been range-bound between ~$85 per barrel and ~$110 per barrel.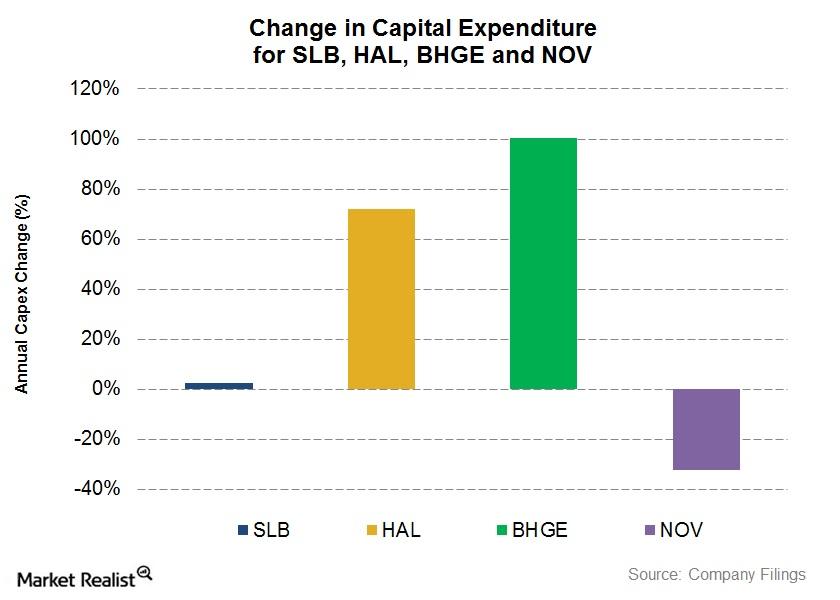
SLB, HAL, NOV, and BHGE: Comparing the Capex Growth
National Oilwell Varco’s (NOV) capital expenditure or capex fell ~32% in fiscal 2017—compared to its capex spend in fiscal 2016.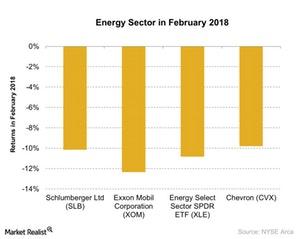
What Put Pressure on the Energy Sector in February 2018?
The US energy sector was badly affected by the recent market sell-off in February 2018.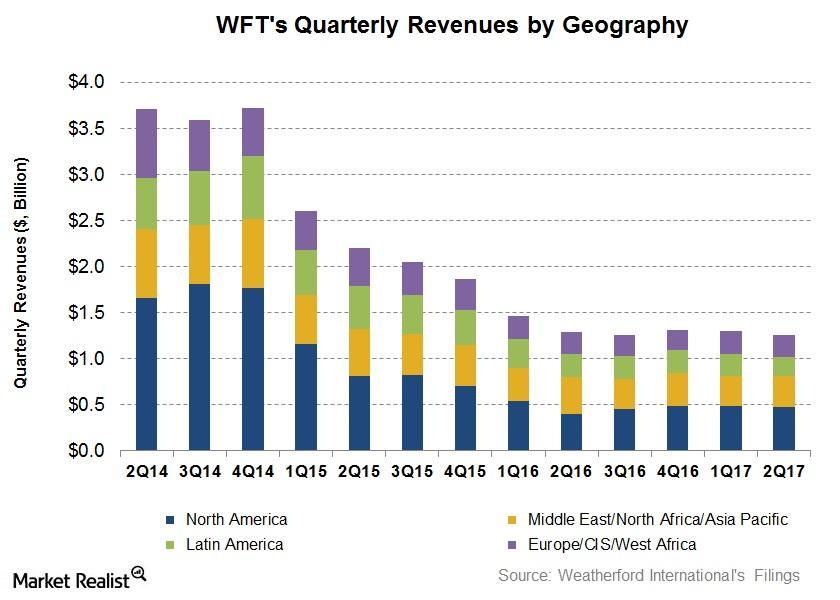
Weatherford International’s Value Drivers in 2Q17
Revenues from Weatherford International’s (WFT) Latin American region fell the most by 18.5% from 2Q16 to 2Q17.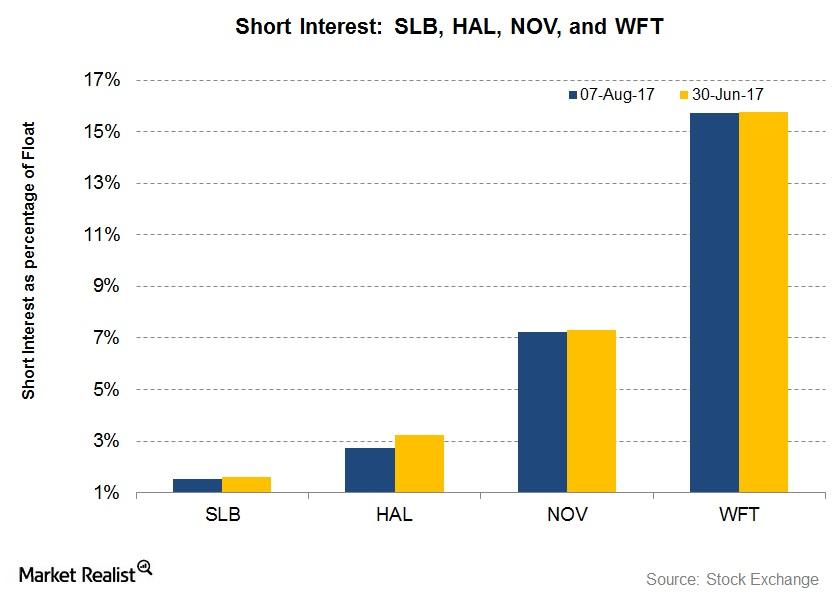
Short Interest in SLB, HAL, WFT, and NOV after 2Q17
The short interest in Schlumberger (SLB), as a percentage of its float, is 1.5% as of August 7, 2017—compared to 1.6% as of June 30, 2017.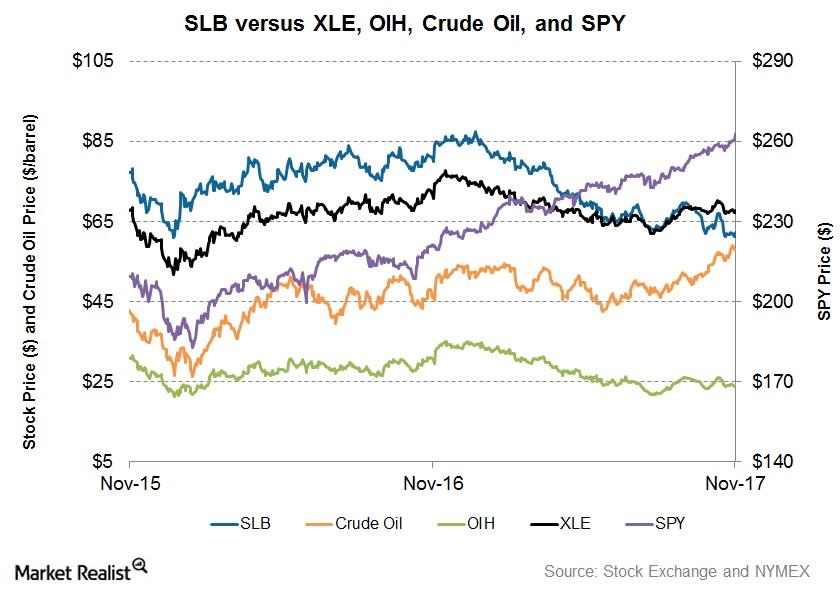
What Are Schlumberger’s SPM Project Plans?
In the past one year, SLB has performed nearly in line with the industry ETF and has hugely underperformed the broader market index.
A quick overview of oil and gas field services biz Schlumberger
Schlumberger Limited is a Houston-based energy company. It provides technology, integrated project management, and information solutions to oil and gas exploration and production (or E&P) companies around the world.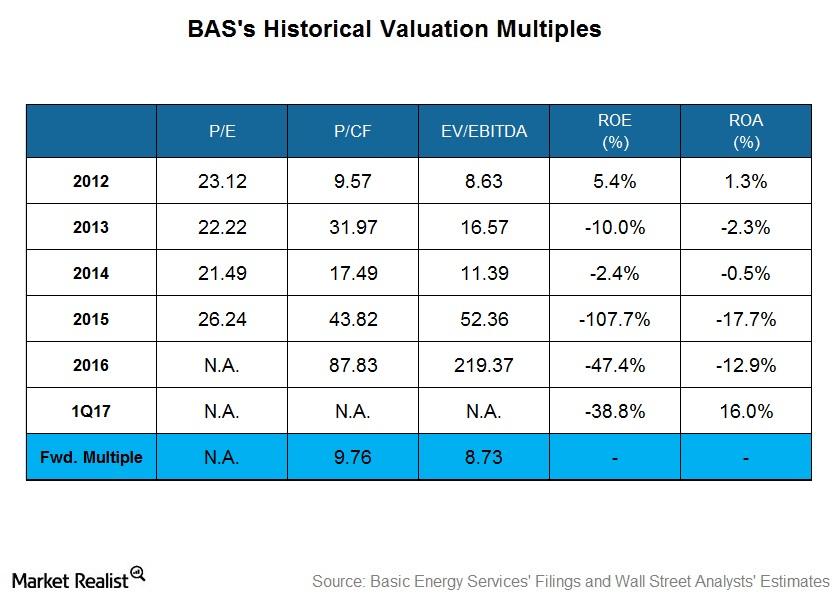
What Does Basic Energy Services’ Historical Valuation Suggest?
On March 31, 2017, Basic Energy Services’ (BAS) stock price had fallen 6% from December 30, 2016.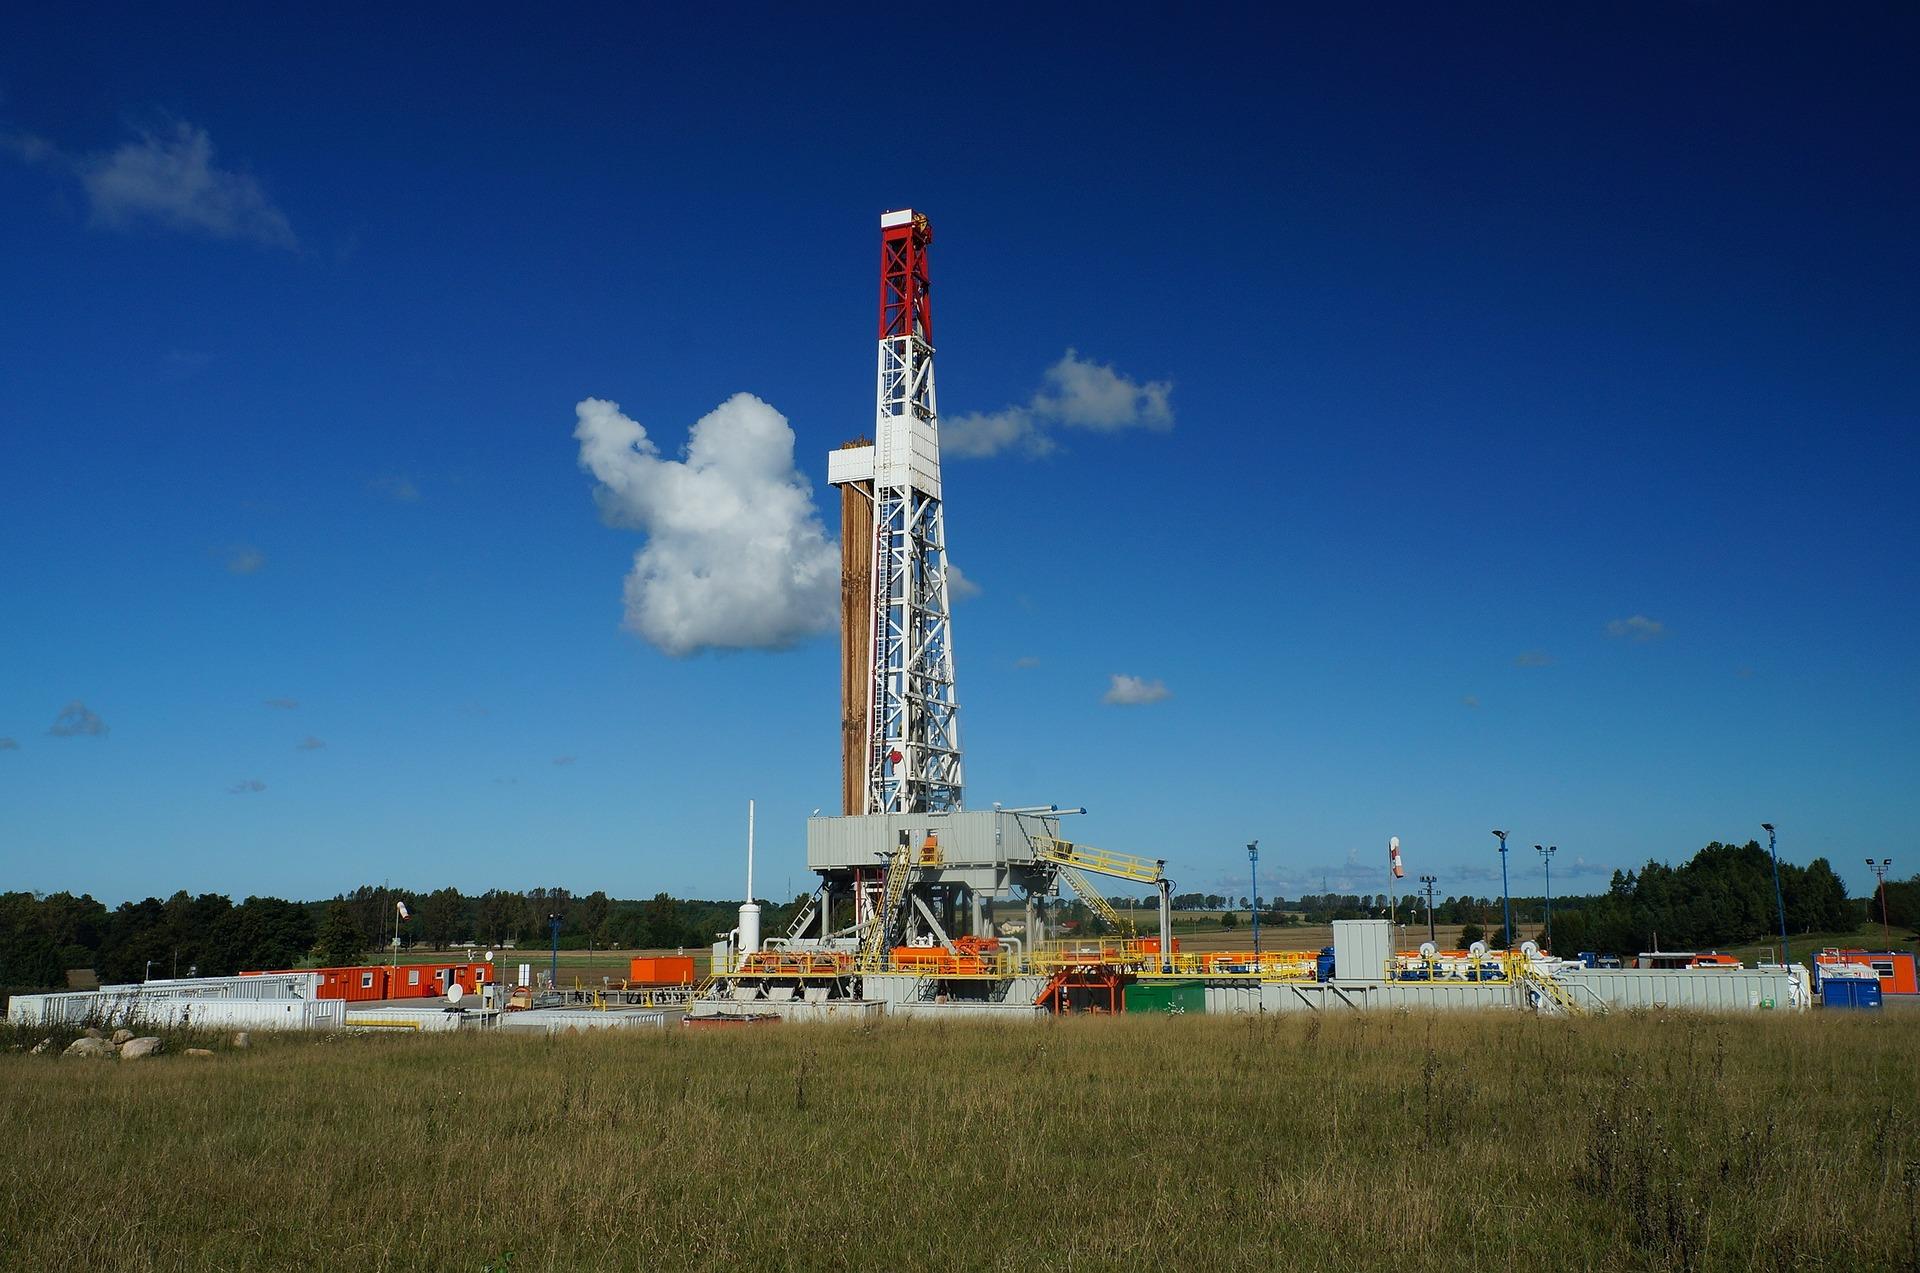
Schlumberger and Halliburton Compared to the Industry
By market capitalization, Schlumberger is the largest OFS company. Schlumberger’s stock price has declined 4% since May 3, 2017.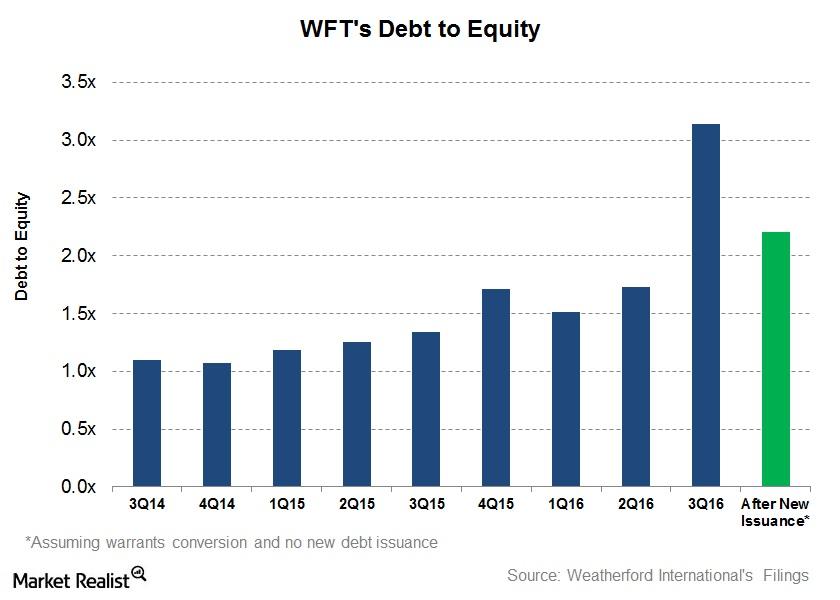
Weatherford International Issues Stocks Again
On November 16, Weatherford International (WFT), an oilfield equipment and services company, disclosed that it issued 84.5 million ordinary stocks.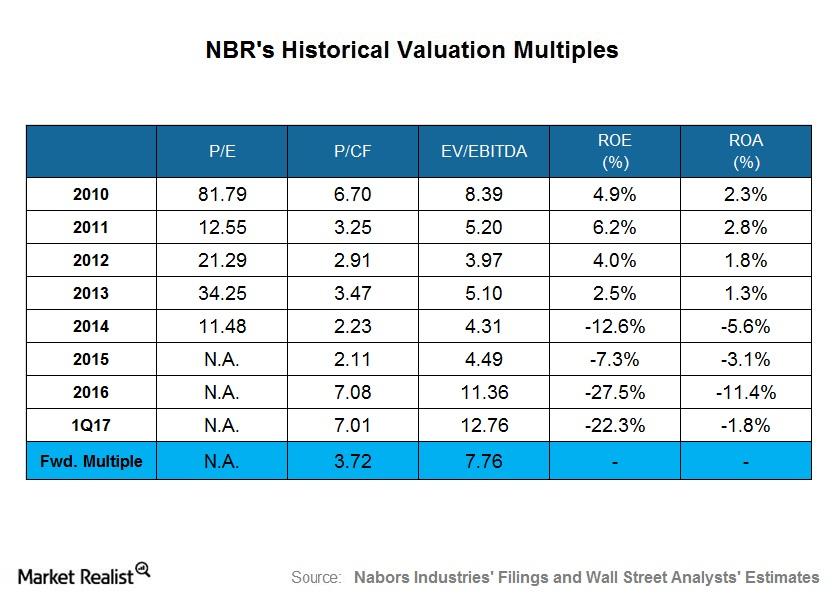
What Nabors Industries’ Historical Valuation Suggests
On March 31, 2017, Nabors Industries (NBR) stock was 20.0% lower than it was on December 30, 2016. In 1Q17, NBR’s adjusted earnings were negative.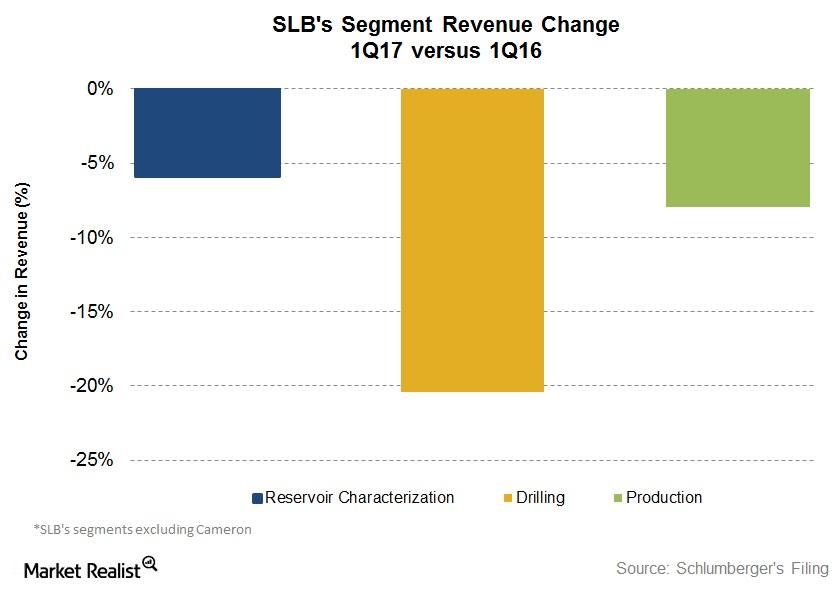
Analyzing Schlumberger’s Growth Drivers in 1Q17
Schlumberger’s (SLB) Drilling segment witnessed the highest revenue fall of 20% in 1Q17—compared to 1Q16. Its Production segment fell ~8%.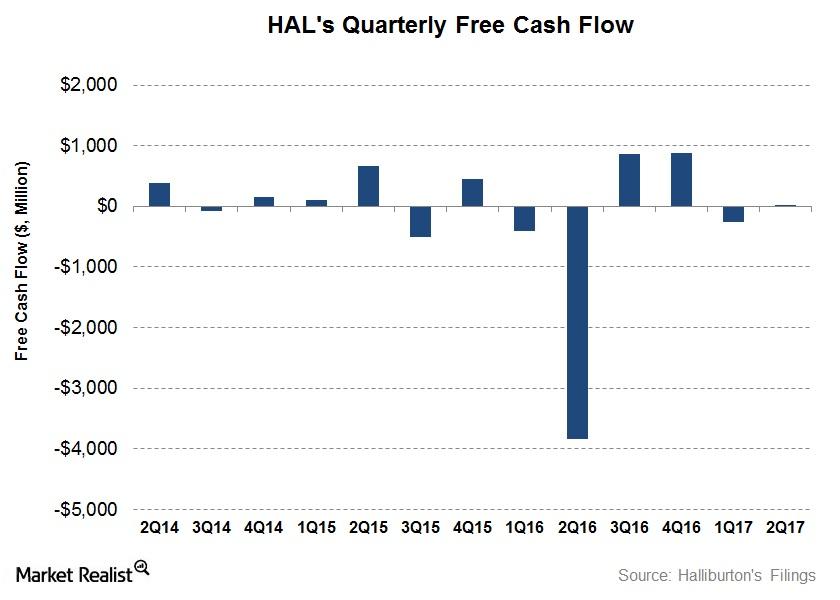
How Halliburton’s Free Cash Flow Turned Around in 2Q17
Halliburton’s (HAL) cash from operating activities (or CFO) in 2Q17 was a huge improvement over 2Q16 as well as an increase over 1Q17.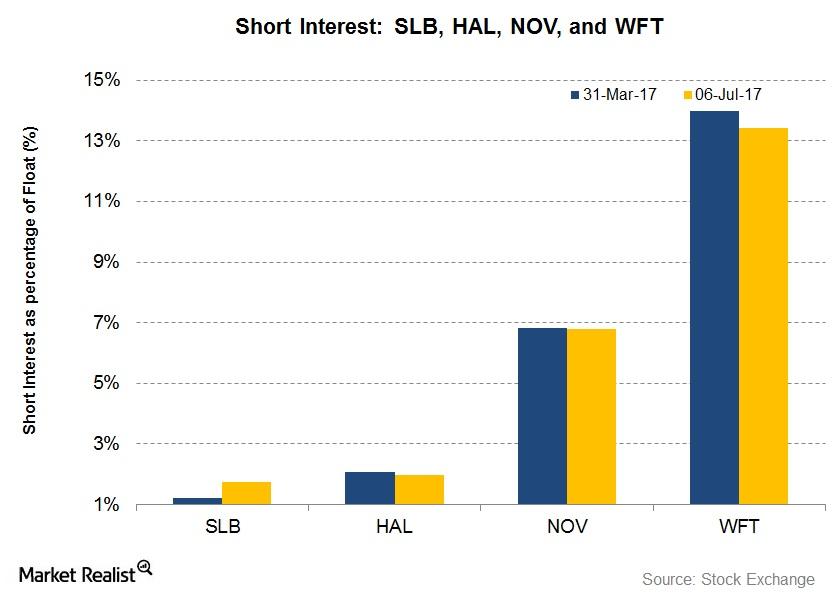
What’s the Short Interest in Large OFS Companies on July 6?
Short interest in Schlumberger (SLB) as a percentage of its float is 1.2% as of July 6, 2017, compared to 1.2% as of March 31, 2017.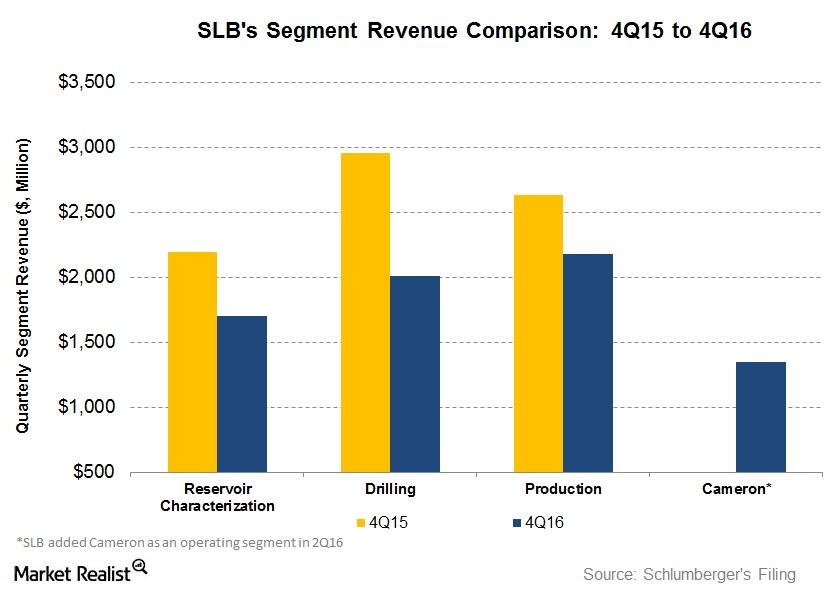
What Could Drive Schlumberger’s Performance in 1Q17 and Beyond?
Schlumberger’s (SLB) Drilling segment witnessed the highest revenue fall of 32% in 4Q16 compared to 3Q16.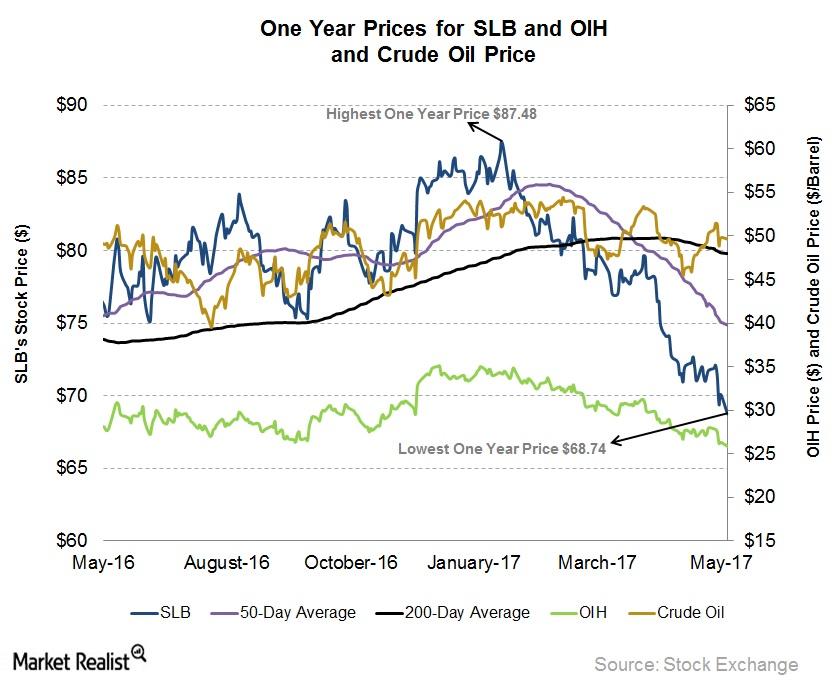
Why Schlumberger’s Stock Price Is Bearish
In the past year, Schlumberger’s stock price rose until January 2017. Schlumberger’s revenue fell slowly in the four quarters leading up to 1Q17.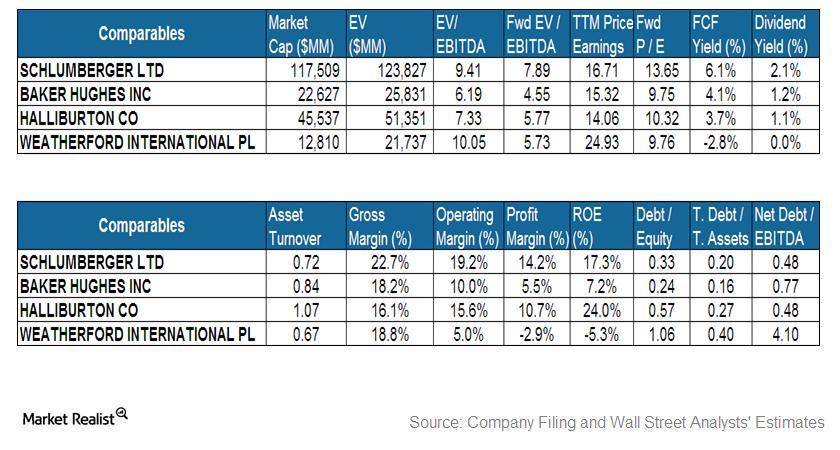
Must-read comparison: Schlumberger and its peers
Schlumberger’s yearly price-to-earnings ratio is in line with the group. Haliburton has the lowest price-to-earnings ratio.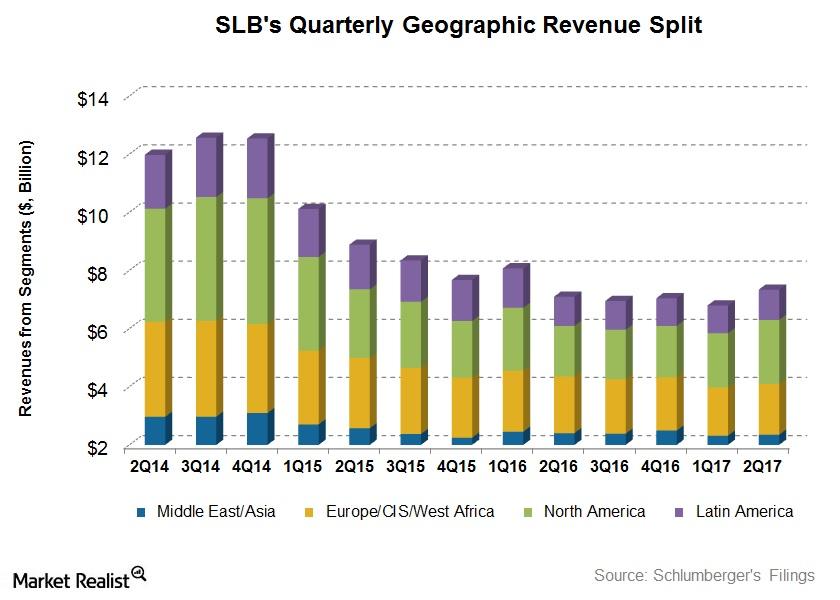
What Were Schlumberger’s Drivers in 2Q17?
In 2Q17, Schlumberger reported a net loss of ~$74 million—a sharp improvement compared to 2Q16 when it reported a net loss of $2.16 billion.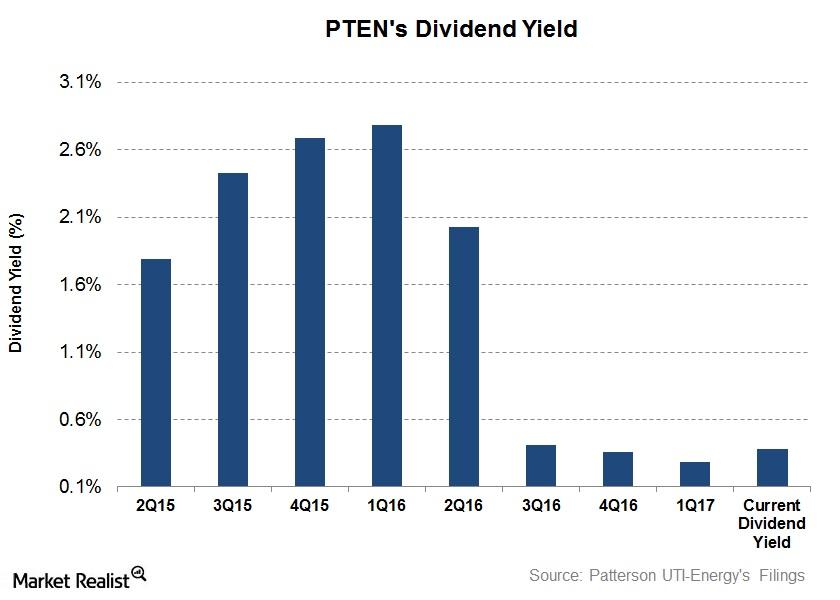
Patterson-UTI Energy’s Dividend Yield on June 2
Patterson-UTI Energy’s (PTEN) dividend yield fell to 0.29% on March 31, 2017. Since then, its dividend yield has risen to 0.38% as of June 2, 2017.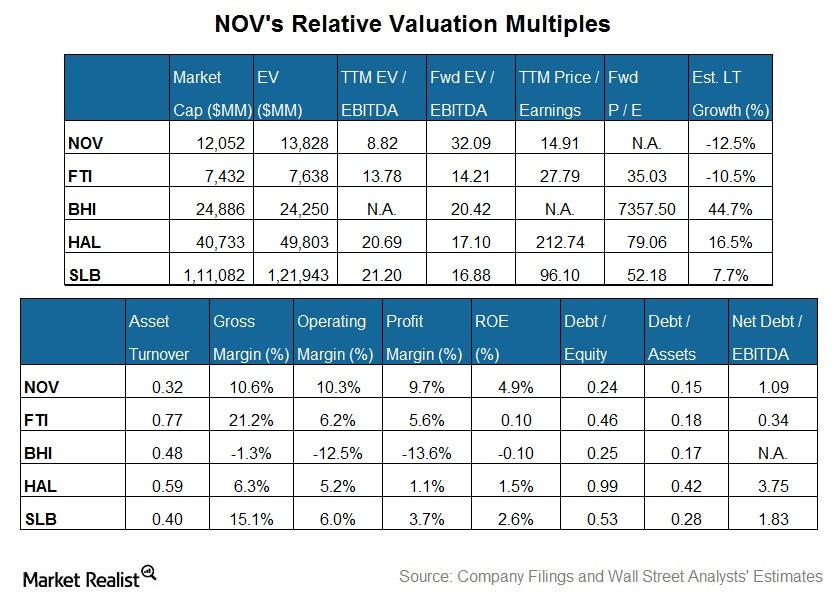
How National Oilwell Varco’s Valuation Stacks Up with Peers
National Oilwell Varco’s TTM PE (price-to-earnings) multiple of ~15x is lower than its peer average in the group.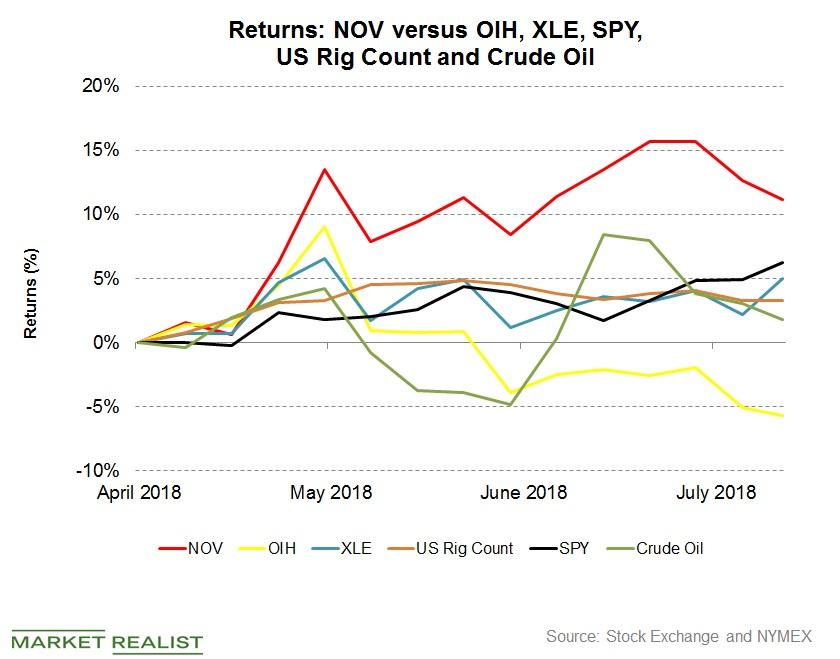
National Oilwell Varco’s Q2 2018 Earnings and the Market
Since April 26 when National Oilwell Varco released its Q1 2018 financial results, NOV stock has risen 10%.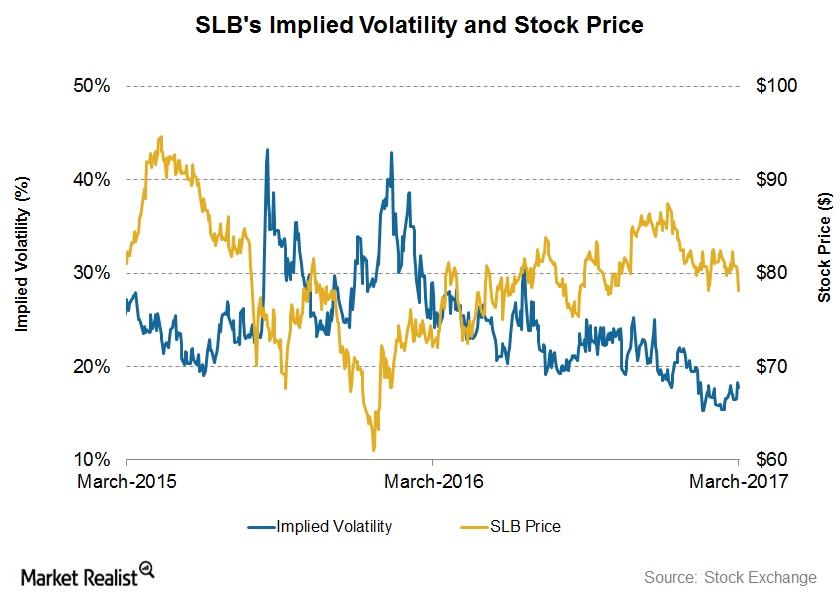
Schlumberger by Implication: Reading Implied Volatility
On March 10, 2017, Schlumberger’s (SLB) implied volatility was 17.7%, having fallen from 19% since its 4Q16 financial results were announced on January 20.
Schlumberger and Cameron International: a Complementary Team
Schlumberger and Cameron are contemplating a merger because their drilling and production systems would be integrated from “pore to pipeline.”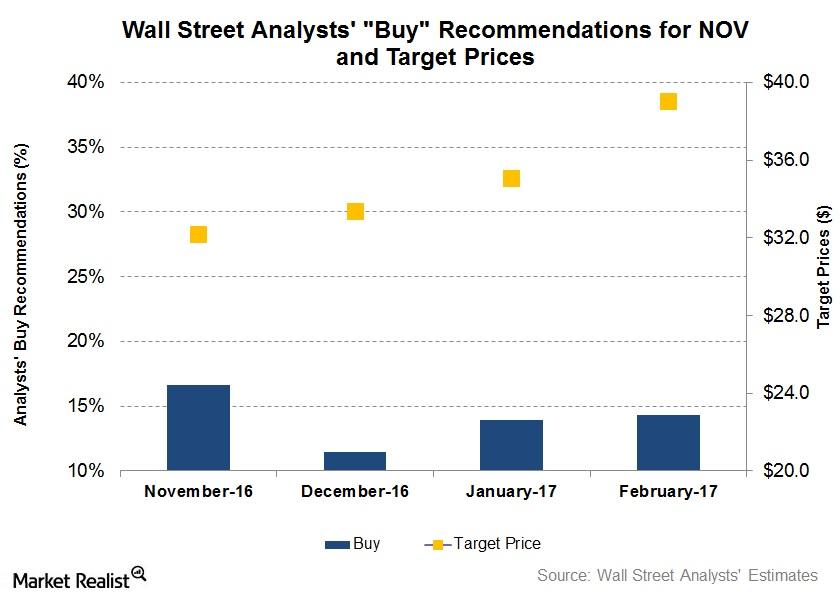
Wall Street Analysts’ Forecasts for National Oilwell Varco
On February 24, ~14% of the analysts tracking National Oilwell Varco rated it as a “buy,” ~74% rated it as a “hold,” and 12% rated it as a “sell.”
Analyzing Weatherford International’s 2Q17 Performance
In 1H17, Weatherford’s revenues fell 8%—compared to 1H16. It managed to lower its net losses significantly during this period.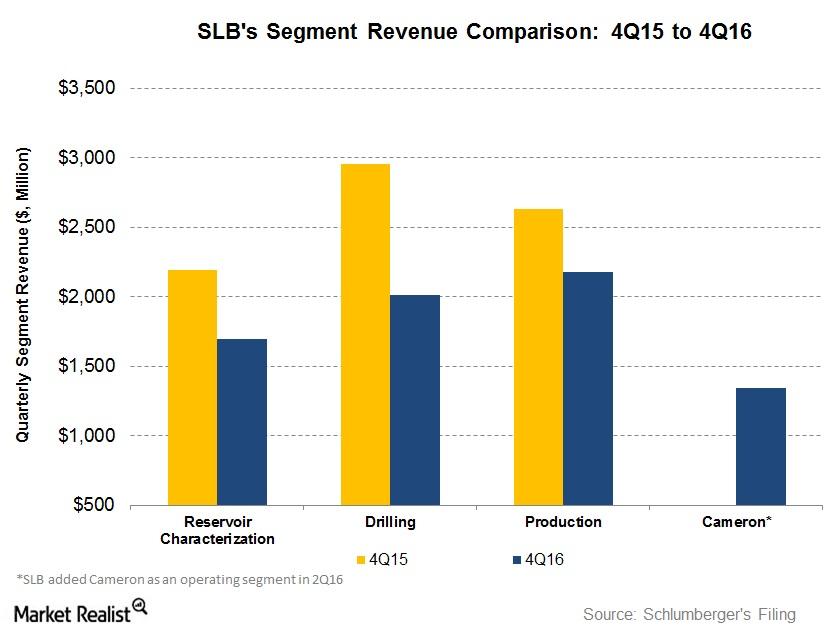
Analyzing the Factors Affecting Schlumberger’s Revenue
Schlumberger’s Drilling segment witnessed the highest revenue fall at 32% in 4Q16 compared to 4Q15. The segment was followed by the Reservoir Characterization and Production segments.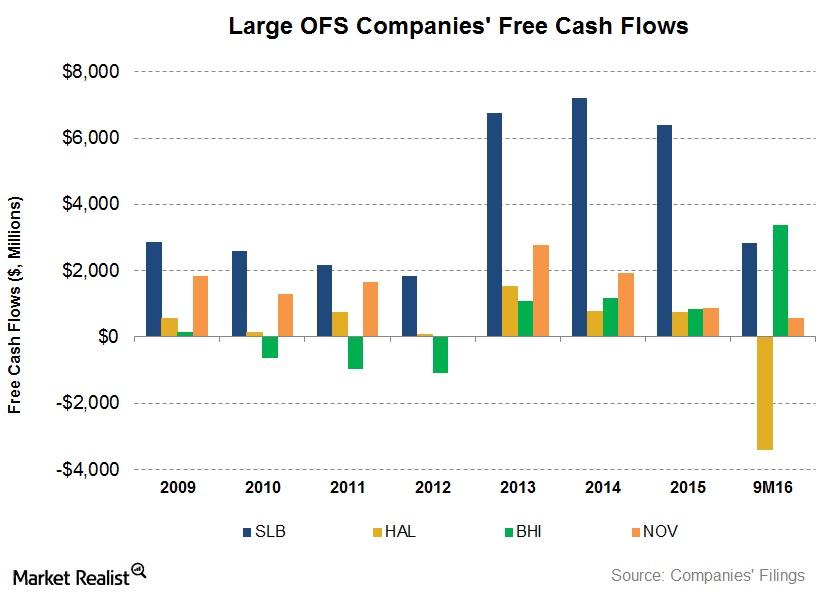
Free Cash Flow Trends: Are OFS Companies Burning Cash?
Many oilfield equipment and services (or OFS) companies’ cash flows have taken a beating following the energy price weakness in the past two years.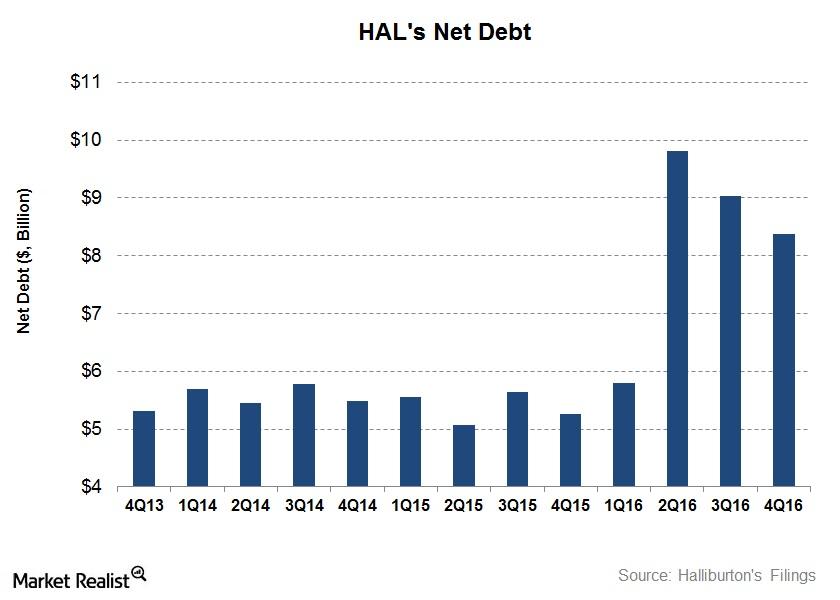
A Look at What’s Happening to Halliburton’s Debt
In 4Q16, Halliburton’s total debt fell 19% compared to a year earlier, and its cash and marketable securities fell 60%. In effect, its net debt rose 59% to ~$8.4 billion as of December 30, 2016.
Get Real: Boeing’s Scandal Leads to Speculation
In today’s Get Real, we saw that Boeing is caught in a massive scandal. Chipotle investors are in a good place and Ford is looking to EVs.
The US Energy Sector: An Overview
To understand the US energy sector, it’s essential first to understand the country’s energy needs. The US uses various energy sources to meet its energy needs.
Can the US-China Trade War Spiral into a Crude Oil War?
Although the US doesn’t export much crude oil to China, the additional supply of cheap Iranian oil could pressure both Brent and WTI crude prices.
How US Production Is Affecting WTI Crude Oil Prices
Between February 11, 2016, and July 15, 2019, WTI crude oil prices rose 127.3%. The United States Oil Fund LP (USO) gained 53.9% in the period.
Why Is Halliburton’s Valuation Attractive?
Halliburton (HAL) is trading at a forward EV-to-EBITDA multiple of ~8.1x, which is lower than its five-year average multiple of 10.2x.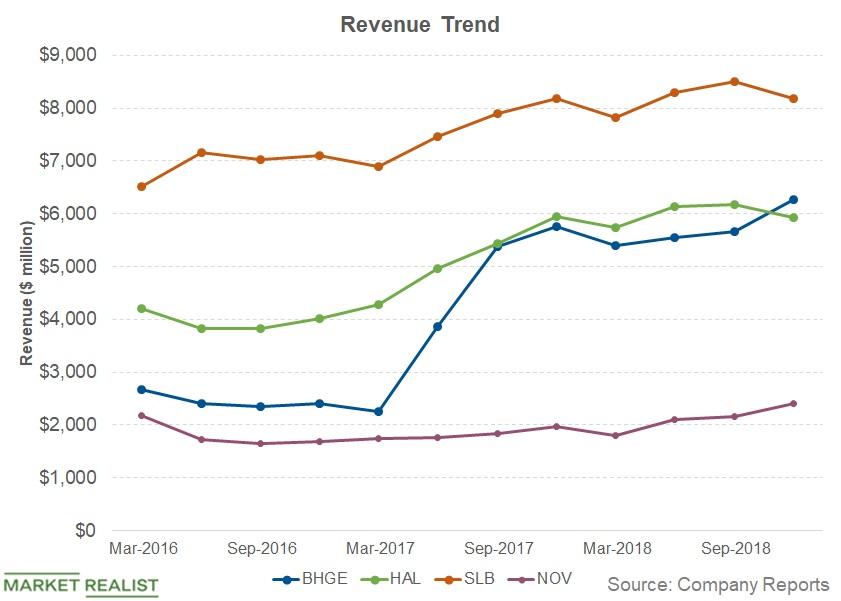
SLB, HAL, BHGE, and NOV: Analyzing the Revenue Trends
Halliburton (HAL) and National Oilwell Varco (NOV) recorded 16% revenue growth in 2018—compared to 2017.
Schlumberger’s Stock Price Forecast this Week
Schlumberger’s (SLB) first-quarter financial results were released on April 20. Between April 20 and June 15, Schlumberger’s implied volatility fell from 24.1% to 22%.
Why Weatherford’s 1Q18 Earnings Beat Estimates
Weatherford International released its 1Q18 earnings results today.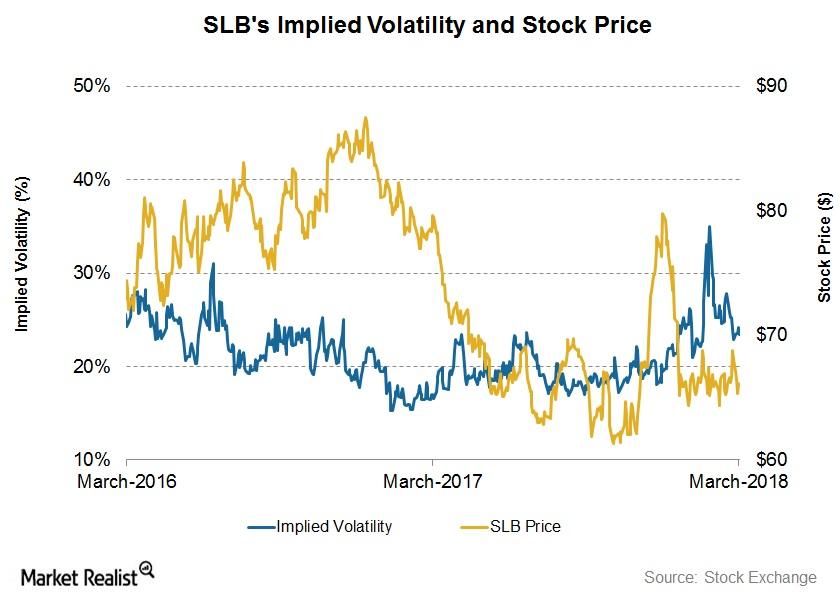
What’s Schlumberger’s 7-Day Stock Price Forecast?
On January 19, 2018, Schlumberger’s (SLB) 4Q17 financial results were released.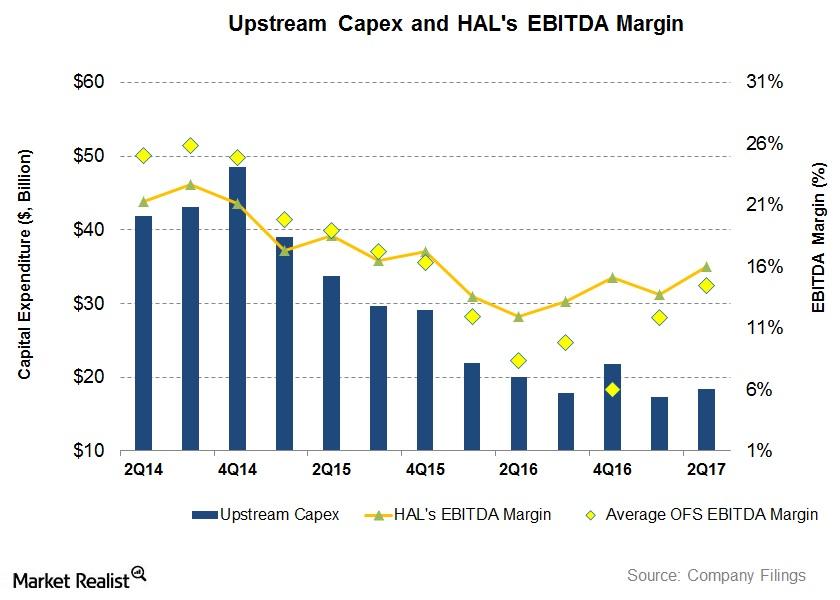
What Halliburton’s Margin Has to Do with Upstream Operators’ Capex
From 2Q16 to 2Q17, Halliburton’s (HAL) EBITDA margin (or EBITDA as a percentage of revenues) rose from 12% to 16%.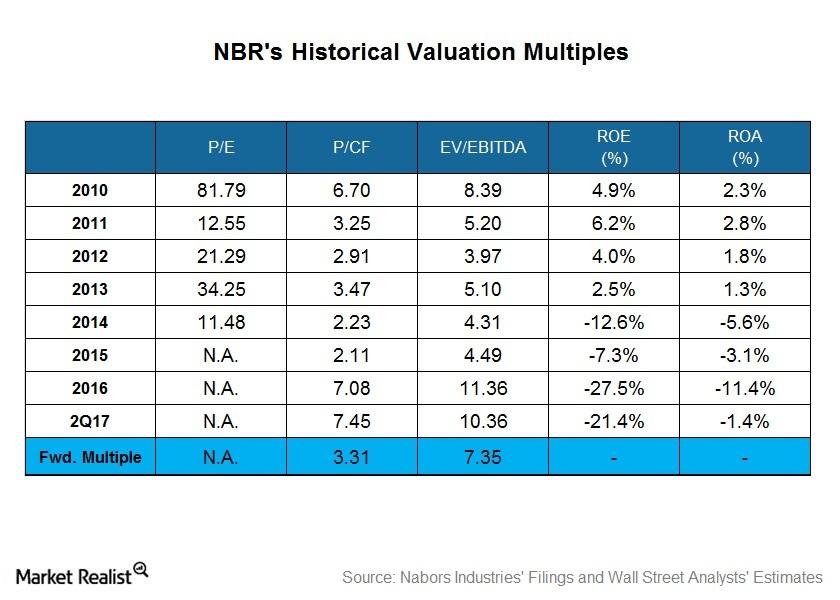
What Does Nabors Industries’ Historical Valuation Suggest?
Nabors Industries’ PE multiple was not meaningful in 2015 and 2016 as a result of negative adjusted earnings during this period.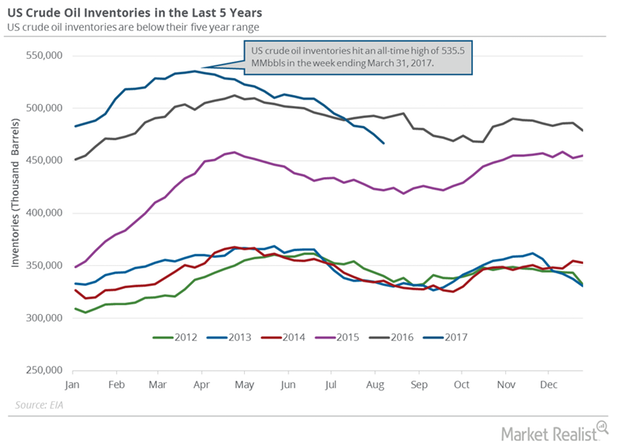
US Crude Oil Inventories: Biggest Draw since September 2016
The EIA reported that US crude oil inventories fell by 8.9 MMbbls or 1.8% to 466.4 MMbbls on August 4–11, 2017—the biggest draw since September 2016.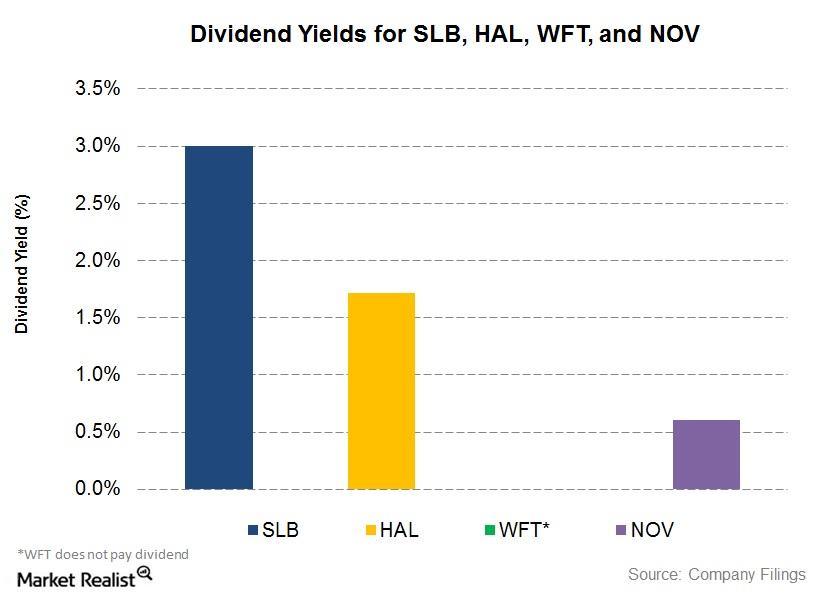
Dividend Yield in 2Q17: Comparing SLB, HAL, and NOV
Schlumberger’s (SLB) quarterly dividend per share remained unchanged from 2Q16 to 2Q17. In 2Q17, Schlumberger’s quarterly DPS is $0.50.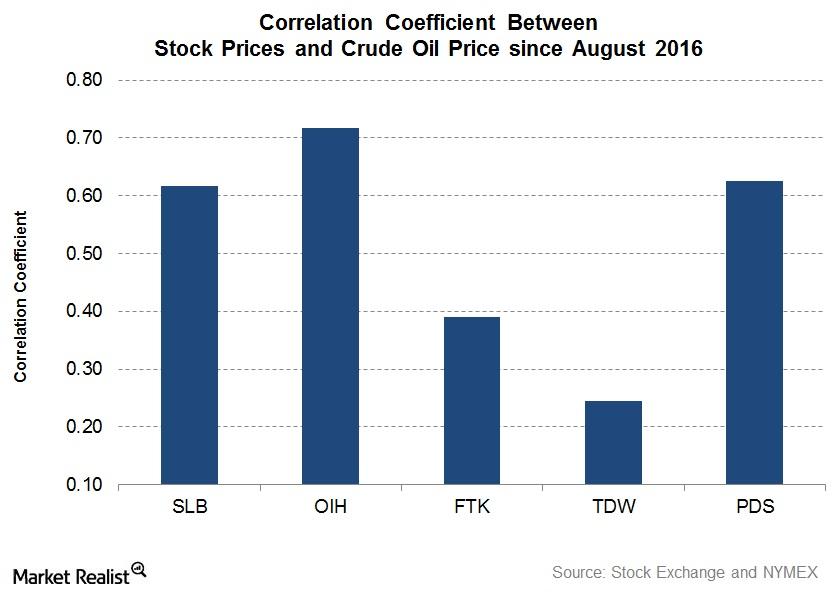
How Schlumberger Correlates with Crude Oil
The correlation coefficient between the West Texas Intermediate (or WTI) crude oil price and Schlumberger’s (SLB) stock price between August 4, 2016, and August 4, 2017, is 0.62.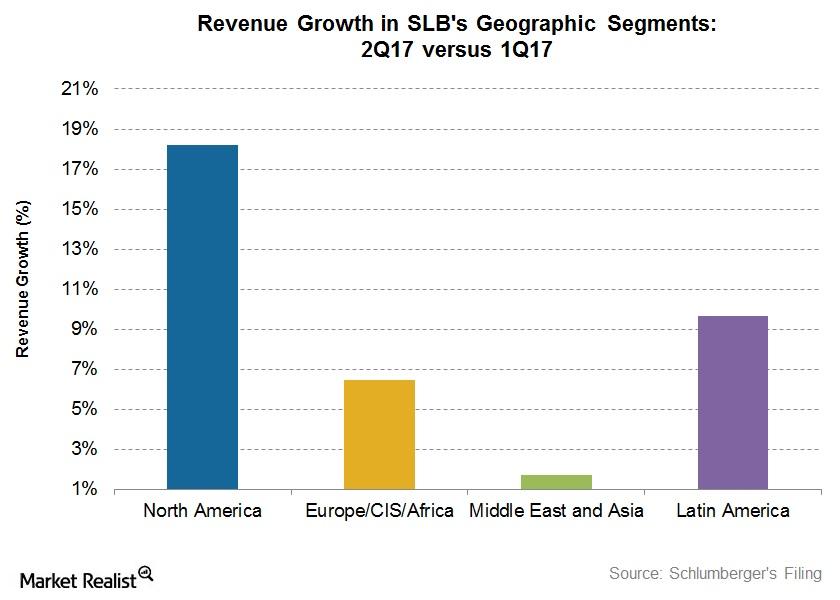
Analyzing Schlumberger’s Growth Drivers in 2Q17
Schlumberger’s (SLB) Production segment witnessed the highest revenue growth (17.6% rise) in 2Q17 over 2Q16.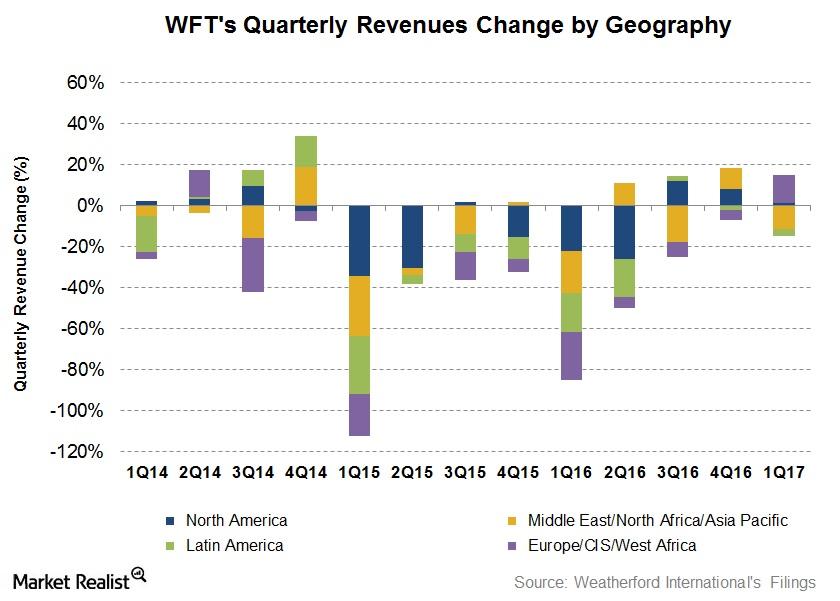
What Are Weatherford International’s Growth Drivers in 1Q17?
In 1Q17, Weatherford International’s net loss was $443 million.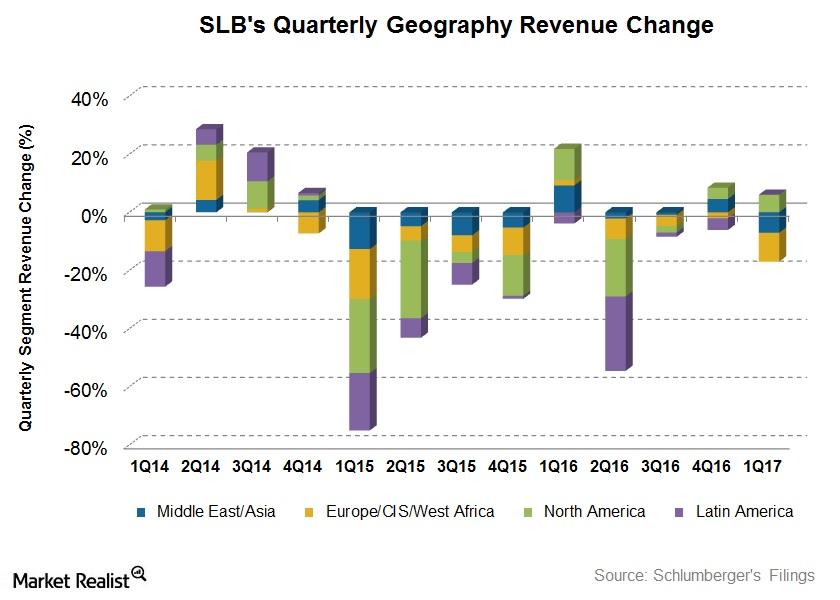
What Drove Schlumberger in 1Q17
Schlumberger’s 1Q17 revenue by geography From 4Q16 to 1Q17, Schlumberger (SLB) witnessed 6% revenue growth in North America, while it saw a steep revenue decline of ~10% in the Europe/CIS[1.Commonwealth of Independent States]/West Africa region. Schlumberger’s revenue from Latin America was resilient in 1Q17, remaining unchanged from 4Q16. Schlumberger accounts for 6.5% of the ProShares […]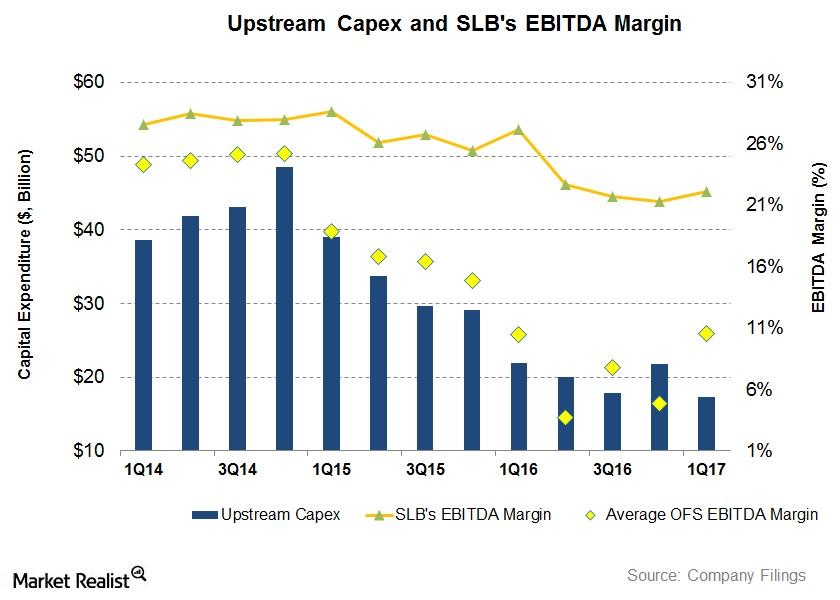
Upstream Operators’ Capex Could Impact Schlumberger’s Margin
Schlumberger’s EBITDA margin was impacted negatively as upstream companies slashed their budgets. From 1Q16 to 1Q17, Schlumberger’s EBITDA margin fell.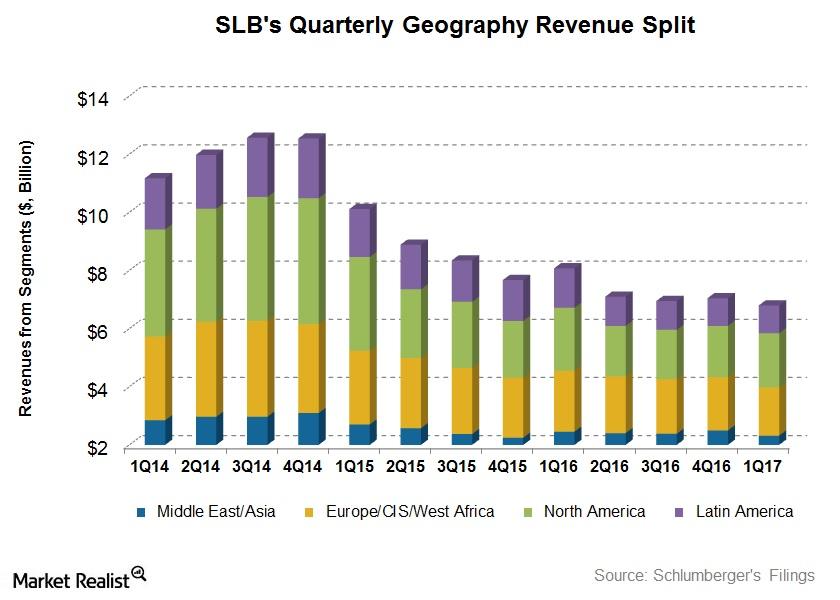
What Were Schlumberger’s Drivers in 1Q17?
Schlumberger’s (SLB) Latin America region witnessed the highest revenue decline (30% fall) in 1Q17—compared to 1Q16.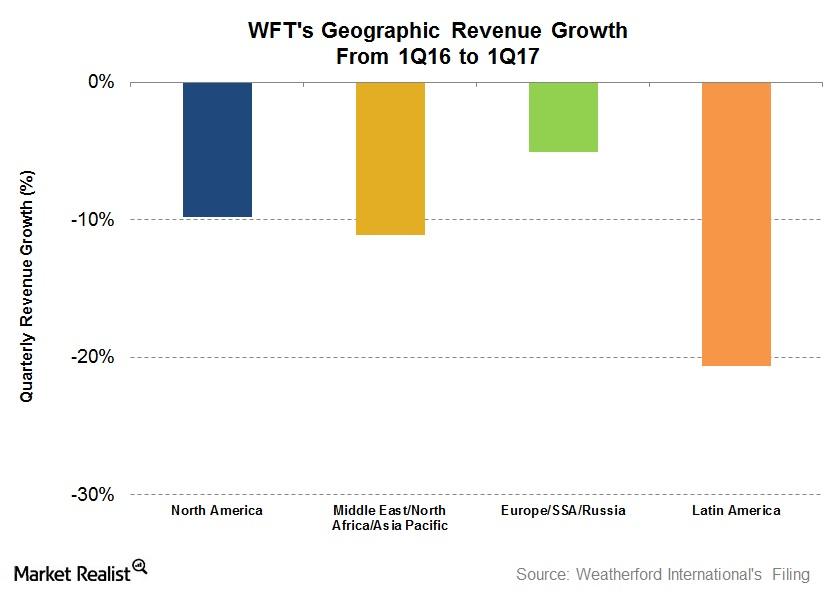
What Impacted Weatherford’s 1Q17 Performance?
Weatherford’s North America region’s 1Q17 operating loss improved to $18 million—compared its operating loss of $128 million last year.
