US Crude Oil Inventories: Biggest Draw since September 2016
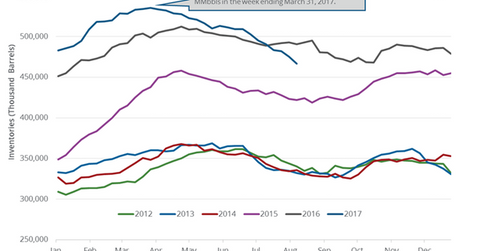
The EIA reported that US crude oil inventories fell by 8.9 MMbbls or 1.8% to 466.4 MMbbls on August 4–11, 2017—the biggest draw since September 2016.
Aug. 17 2017, Published 10:00 a.m. ET

Crude oil prices
September WTI (West Texas Intermediate) crude oil futures (RYE) (IEZ) (OIH) contracts rose 0.1% to $46.8 per barrel in electronic trading at 2:05 AM EST on August 17, 2017. Prices rose due to short covering.
Top energy companies by volume
Higher crude oil (ERY) (ERX) prices have a positive impact on energy producers. The top energy companies’ returns by volume (or shares traded) as of August 16, 2017, are mentioned below:
EIA’s crude oil inventories
The EIA (U.S. Energy Information Administration) released its weekly crude oil and gasoline inventory report on August 16, 2017. The EIA reported that US crude oil inventories fell by 8.9 MMbbls (million barrels) or 1.8% to 466.4 MMbbls on August 4–11, 2017—the biggest draw since September 2016. Inventories fell by 23.9 MMbbls or 4.8% from the same period in 2016.
According to a market survey, US crude oil inventories could have fallen by 3.1 MMbbls on August 4–11, 2017. US crude oil (XLE) (XOP) prices fell on August 16, 2017, despite the large fall in inventories.
US crude oil inventories by region
The EIA divides the US into five storage regions. We’ll assess the changes in crude oil inventories on August 4–11, 2017.
- East Coast – rose by 0.2 MMbbls to 15.2 MMbbls
- Midwest – rose by 0.1 MMbbls to 144 MMbbls
- Gulf Coast – fell by 7.2 MMbbls to 238.1 MMbbls
- Rocky Mountain – rose by 0.4 MMbbls to 22.2 MMbbls
- West Coast – fell by 2.5 MMbbls to 46.7 MMbbls
Impact of US crude oil inventories
US crude oil inventories are below the five-year average. They’re at the lowest level since January 22, 2016. Inventories have fallen 13% from the peak. An expectation of a fall in US crude oil inventories would support crude oil (DIG) (OIH) prices.
In the next part, we’ll look at why US crude oil production is at a two-year high.
