
Gordon Kristopher
Disclosure: I am in full compliance with all ethics and other policies for Market Realist research analysts. I am not invested in securities that I cover on Market Realist.
More From Gordon Kristopher
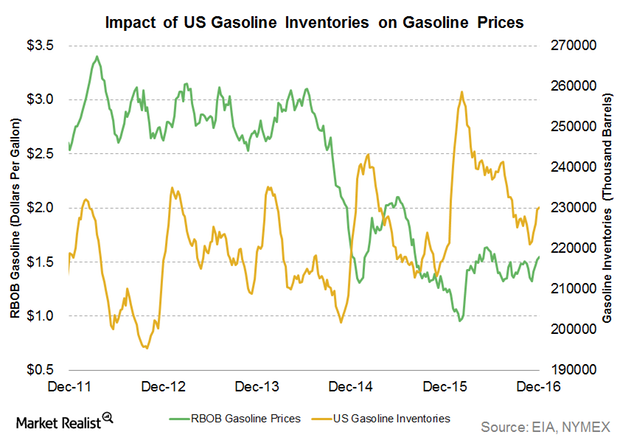
Will Gasoline Inventories Impact Gasoline and Crude Oil Prices?
The API released its weekly inventory report on December 28, 2016. It estimates that US gasoline inventories fell by 2.8 MMbbls from December 16–23, 2016.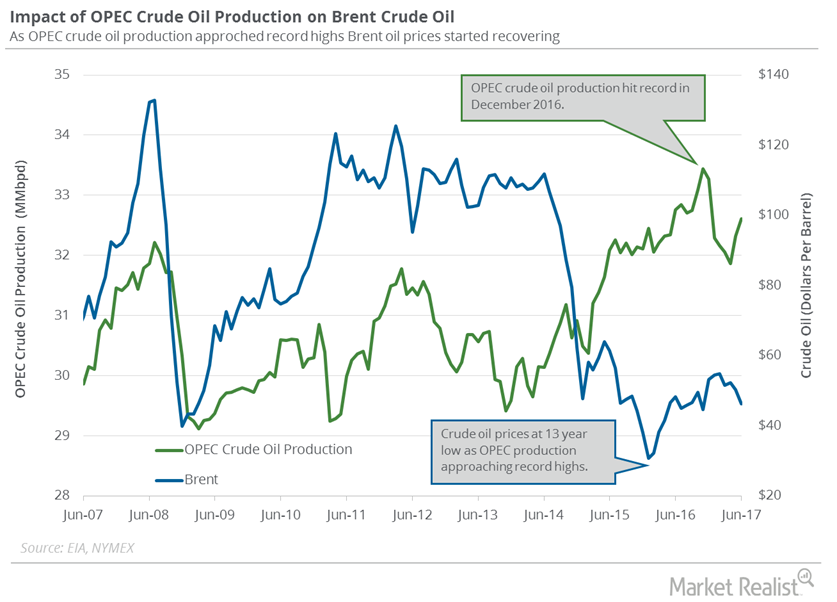
What to Expect from OPEC’s Crude Oil Production in August 2017
October WTI (or West Texas Intermediate) crude oil (USO) (UCO) futures contracts rose 0.4% and were trading at $47.73 per barrel in electronic trade at 2:00 AM EST on August 22, 2017.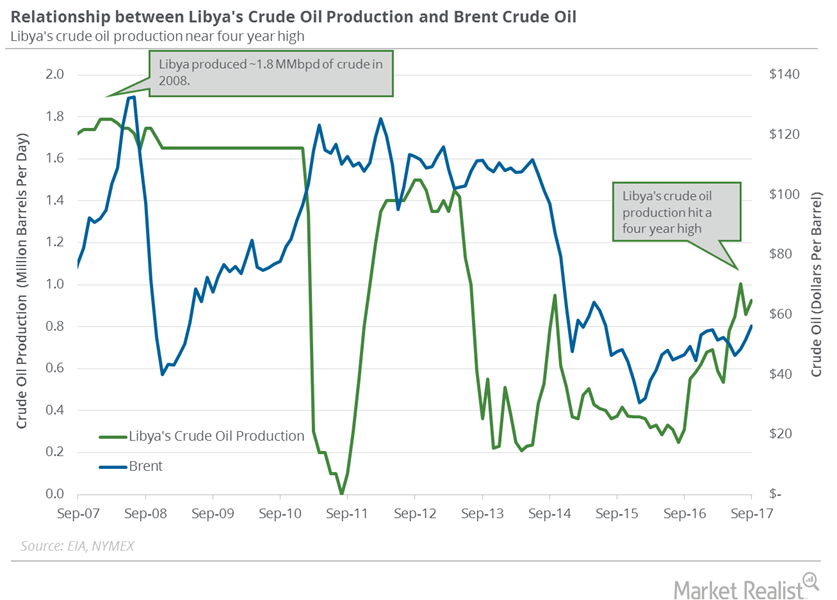
Libya’s Crude Oil Production: Time to Sell Oil Futures?
Libya plans to pump 1.25 million barrels per day of crude oil by December 2017. An increase in Libya’s crude oil production could weigh on oil prices.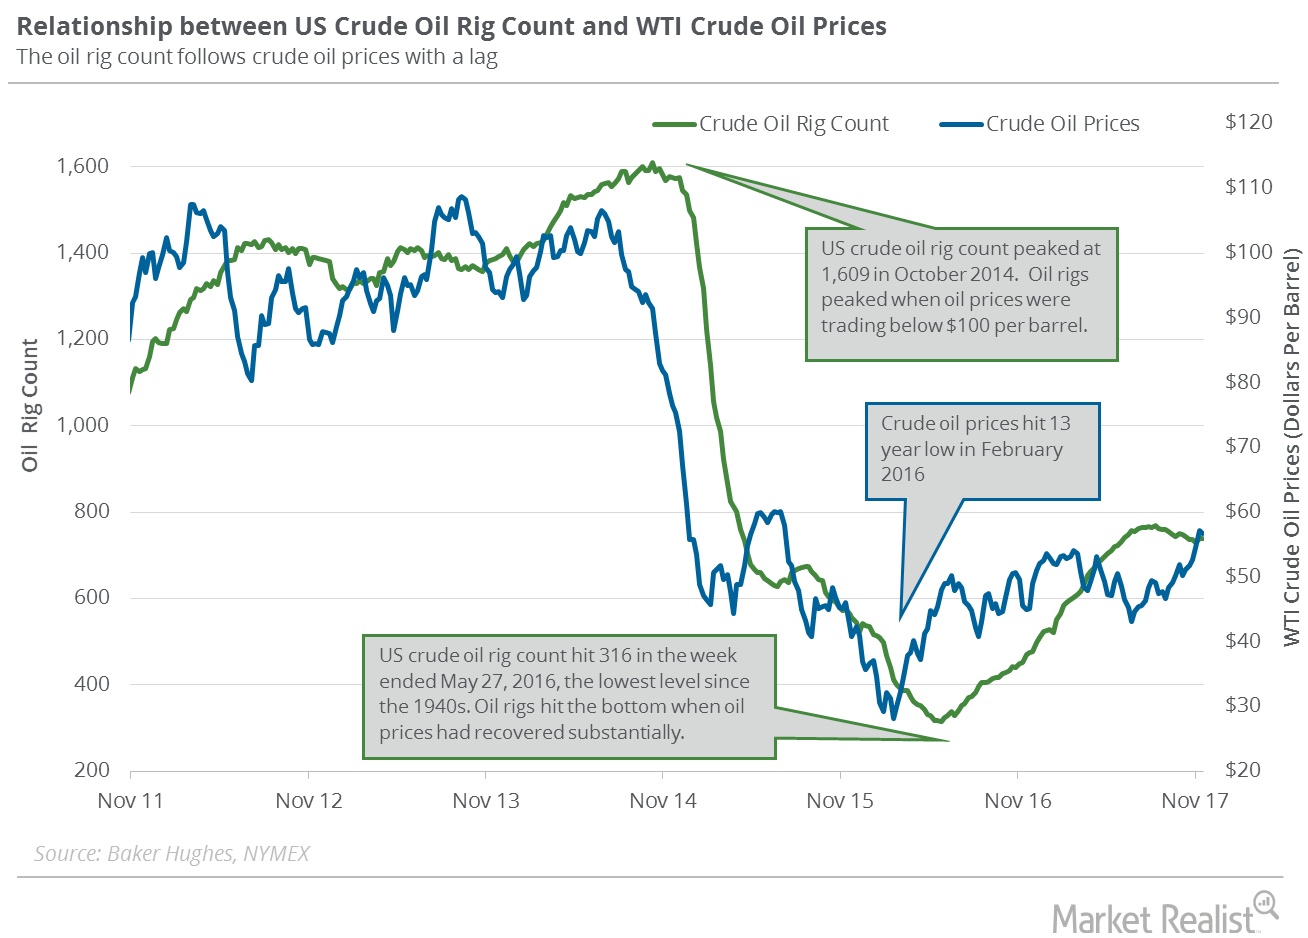
US Crude Oil Rigs Are Near 3-Month High
Baker Hughes, a GE company, published its weekly US crude oil rig report on December 1, 2017.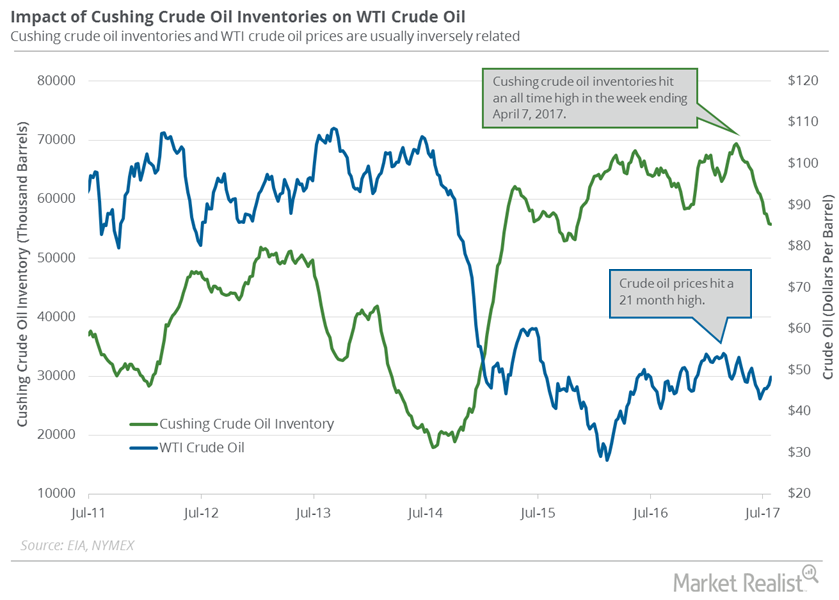
Cushing Inventories Rise for the First Time in 12 Weeks
Cushing is the largest crude oil storage hub in the United States. A market survey estimates that Cushing inventories fell from August 4 to August 11.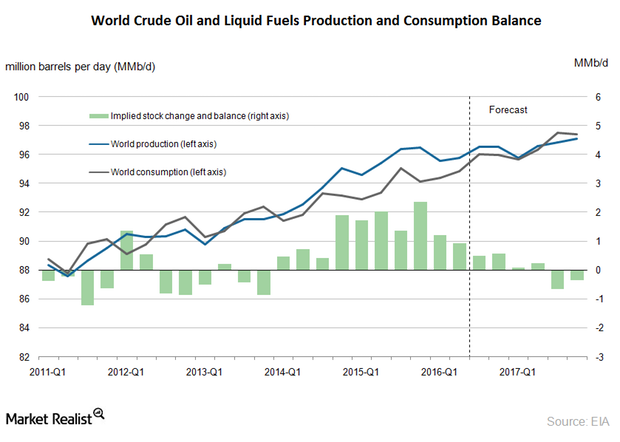
Global Crude Oil Supply and Demand Could Balance in 2017
The EIA estimates that the global crude oil supply could outstrip demand by 1.1 MMbpd (million barrels per day) in 2H16—compared to 2.2 MMbpd in 1H16.
Crude Oil Prices Rally Due to Short Covering
WTI (West Texas Intermediate) crude oil futures contracts for January delivery rose slightly by 0.4% and closed at $43.04 per barrel on Wednesday.
US Distillate Inventories Rose for the Sixth Time in 7 Weeks
US distillate inventories increased for the sixth time in the last seven weeks. The inventories rose ~11% in the last seven weeks.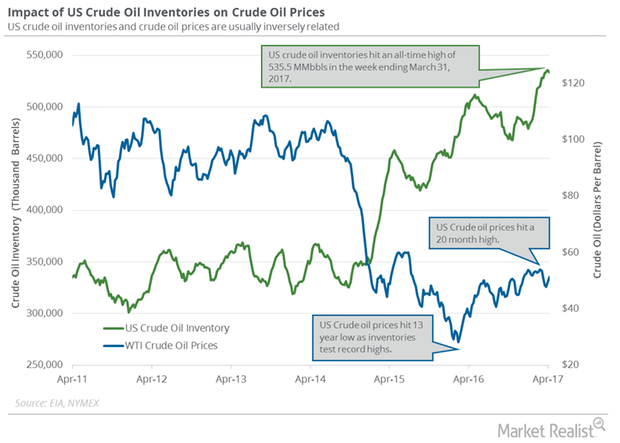
Energy Calendar for Oil and Gas Traders: April 17–21
The energy sector contributed to ~6.6% of the S&P 500 (SPY) (SPX-INDEX) on April 13, 2017. Oil and gas are major parts of the energy sector.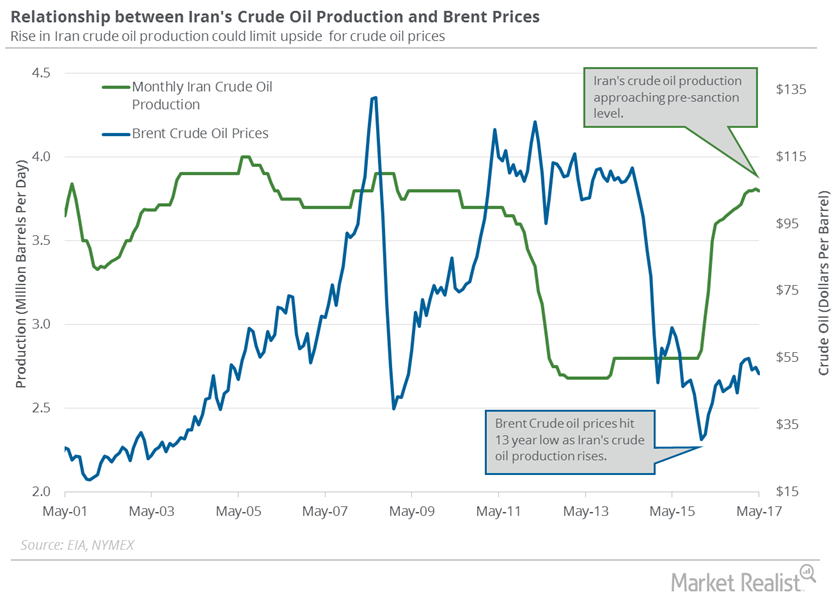
Iran’s Crude Oil Exports Could Impact Crude Oil Prices
The rise in crude oil export capacity suggests that Iran’s getting ready for a massive increase in crude oil production in 2018.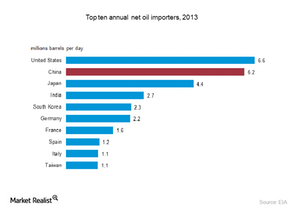
Who will drive crude oil consumption?
Current lower oil prices and growth from China, India, the United States and Asia Pacific countries will drive crude oil consumption in the long term.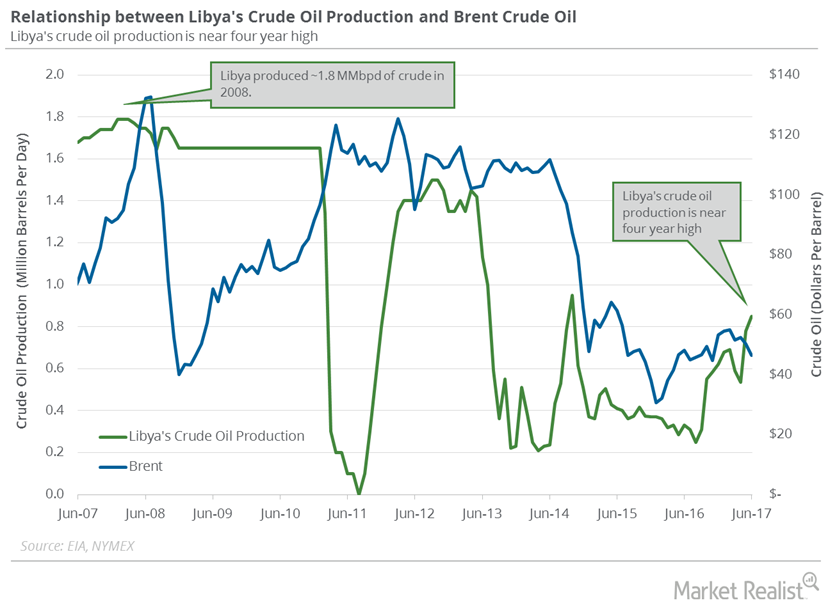
Libya’s Crude Oil Production: Bears Could Control Oil Prices
Libya’s crude oil production was at 1,030,000 bpd in July 2017. Production has risen ~60% from its levels in January 2017.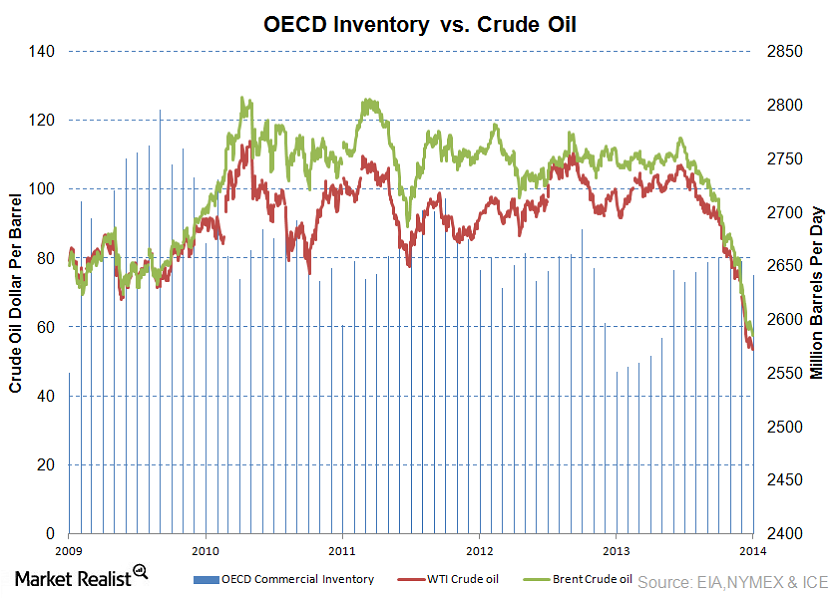
Why investors should track crude oil inventory levels
The difference between actual and expected changes in US crude oil inventory levels affects crude prices and thus revenues and earnings of major companies.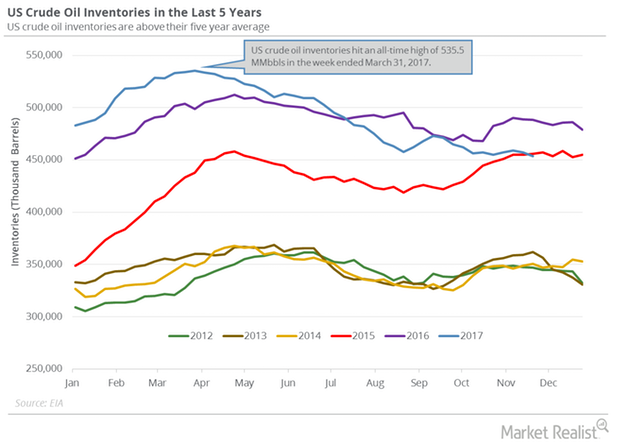
Oil Prices Fall despite the Draw in US Crude Oil Inventories
The EIA estimated that US crude oil inventories fell by 3.4 MMbbls (million barrels) to 453.7 MMbbls on November 17–24, 2017.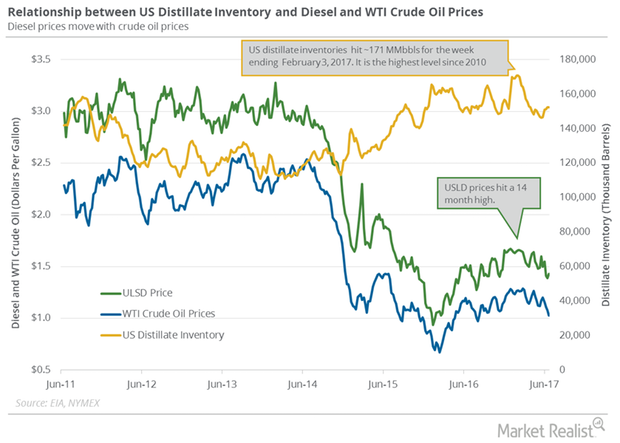
US Distillate Inventories Fell for the First Time in 5 Weeks
The fall in distillate inventories supported diesel and crude oil futures on June 28, 2017. US diesel futures rose 1.4% to $1.43 per gallon on June 28.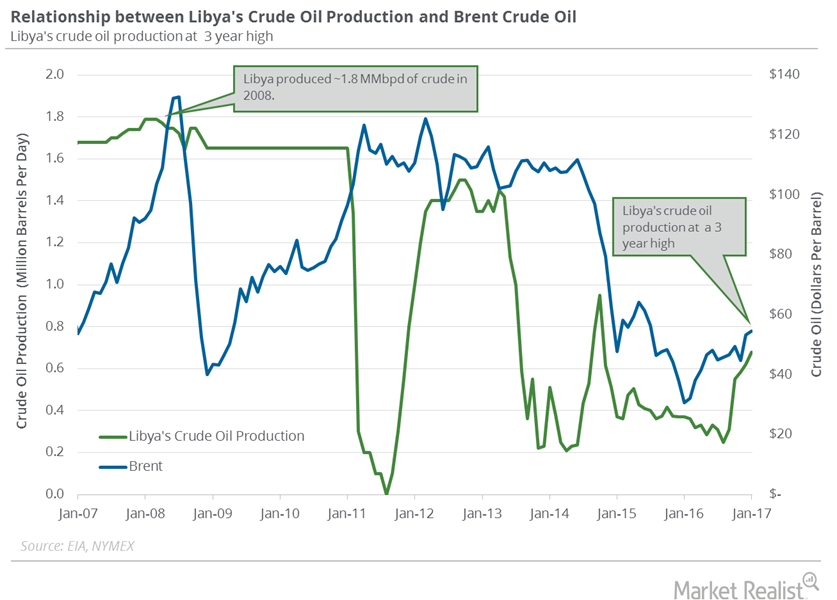
Analyzing Libya’s Crude Oil Production
A Reuters survey estimates that Libya’s crude oil production fell by ~20,000 bpd (barrels per day) to 670,000 bpd in February 2017—compared to January 2017.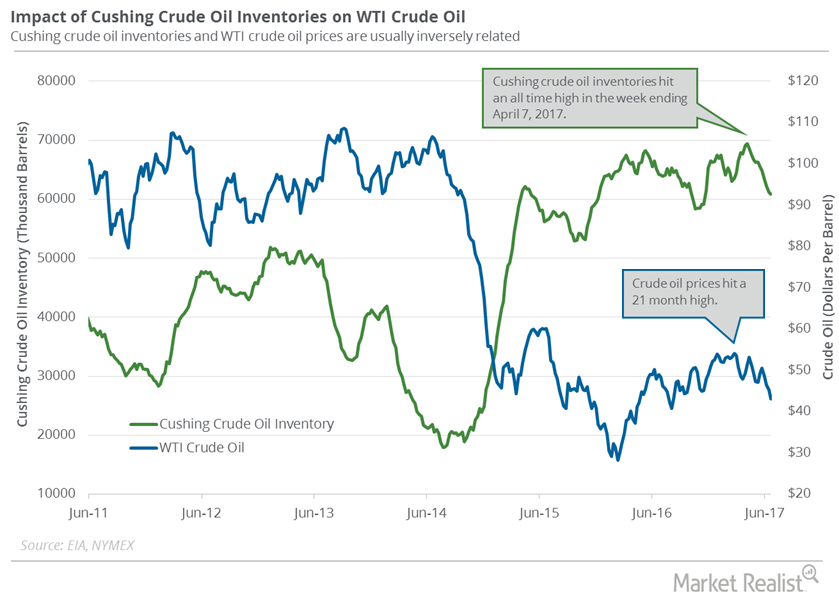
Cushing Inventories Have Fallen 10% in the Last 10 Weeks
Cushing crude oil inventories have fallen 10% in the last ten weeks. A better-than-expected fall in Cushing inventories could support US crude oil prices.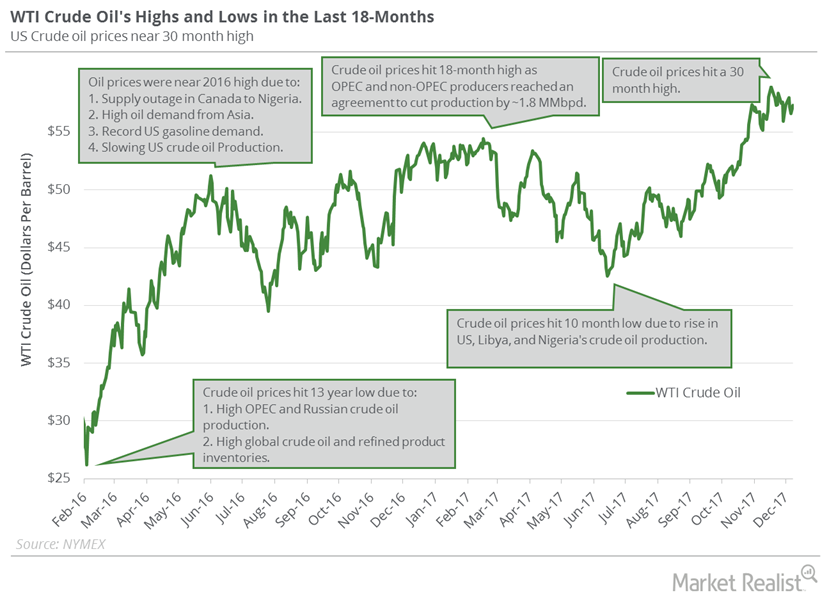
Will US Crude Oil Futures Be Range Bound This Week?
WTI crude oil (USO) futures hit $58.95 per barrel on November 24, 2017—the highest level in nearly three years.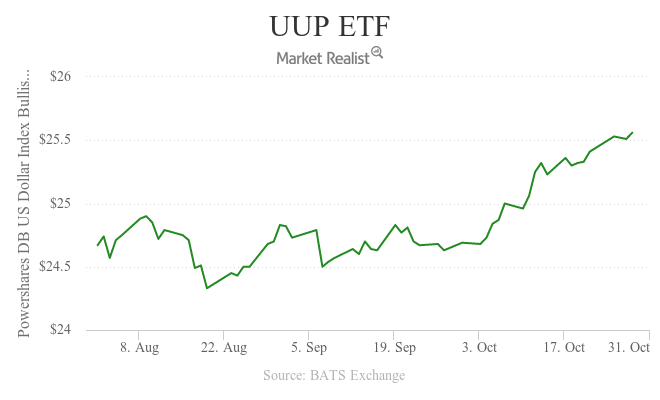
US Dollar Index Fell: How Will It Impact Crude Oil Prices?
The US Dollar Index fell 0.5% to 98.3 on October 28, 2016. It fell due to political uncertainty in the US. It had risen earlier in the morning on October 28.
Why Goldman Sachs Revised Its Crude Oil Price Forecast
Goldman Sachs (GS) forecast that Brent crude oil prices could test $50 per barrel in 2H16 due to recent supply outages.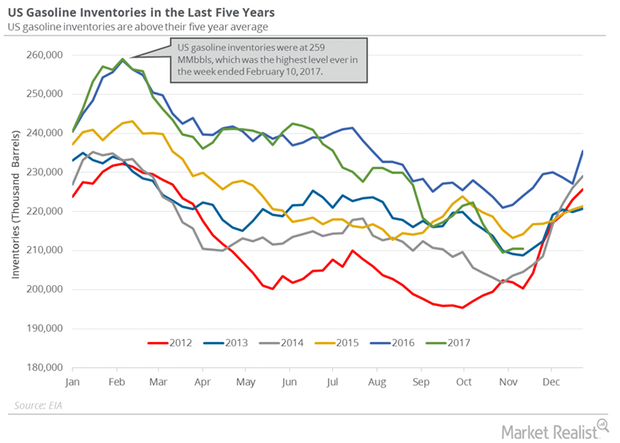
US Crude Oil Inventory Report Might Disappoint Traders
An unexpected increase in US oil inventories pressured WTI oil (USO) (UCO) prices in post-settlement trade on November 28, 2017.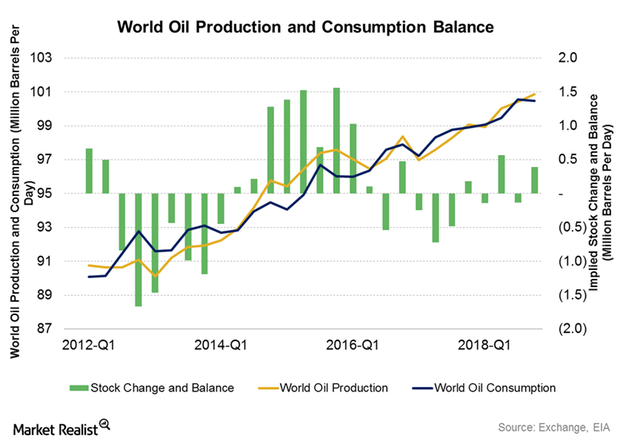
Is Global Oil Demand Key to Crude Oil Bulls?
The EIA estimates that global oil demand could average 100.1 MMbpd in 2018. Global oil demand could increase to 101.75 MMbpd in 2019.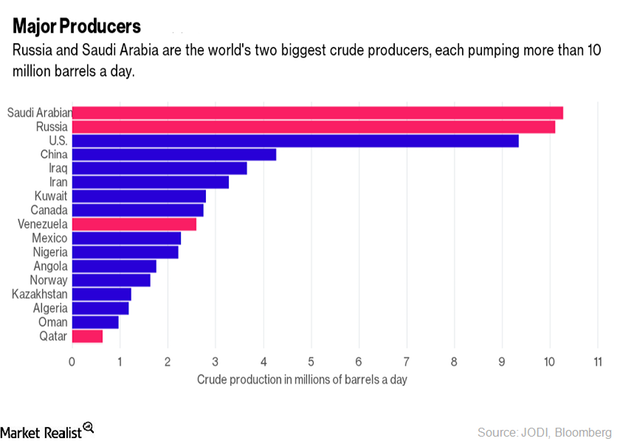
Will Oil Producers’ Meeting Support Crude Oil Prices in September?
OPEC producers will be meeting at an energy forum in Algeria from September 26–28, 2016. Crude oil prices are up by 16% so far in August 2016.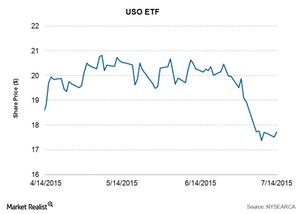
Crude Oil Prices Rally despite the Iran Nuclear Accord
NYMEX-traded WTI (West Texas Intermediate) crude oil futures contracts for August delivery rose by 1.10% and settled at $53.04 per barrel on July 14, 2015.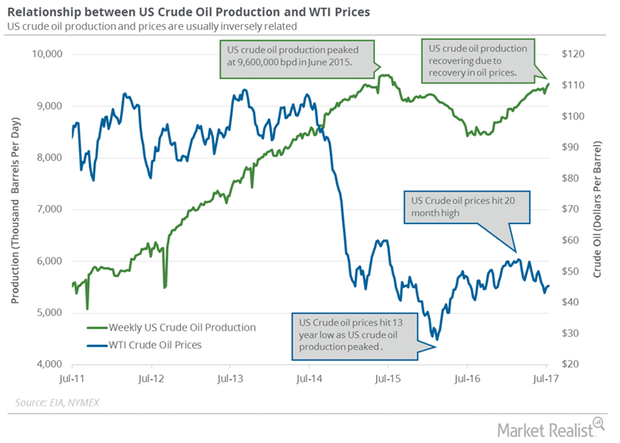
Crude Oil Futures Near 7-Week High
September US crude oil (RYE) (VDE) (BNO) futures contracts rose 3.3% to $47.8 per barrel on July 25, 2017.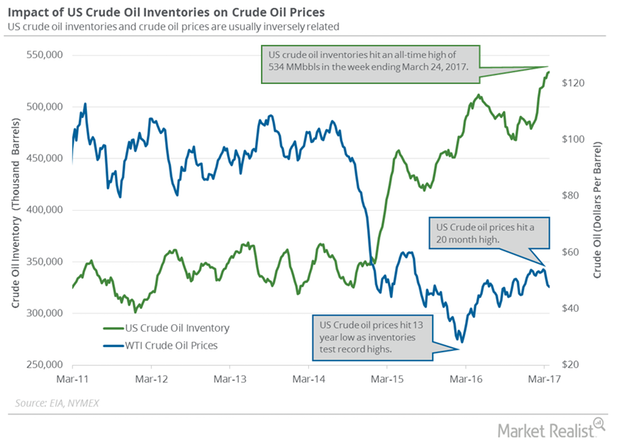
Crude Oil Prices Rose above the 200-Day Moving Average
WTI (West Texas Intermediate) crude oil (USO) (UCO) (XLE) futures contracts for May delivery rose 2.4% and settled at $49.51 per barrel on March 29, 2017.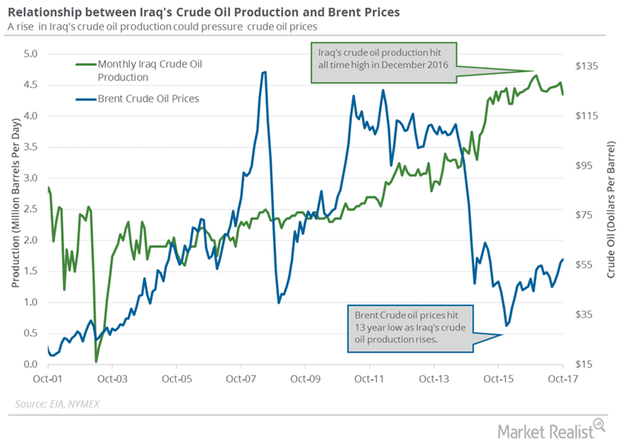
Iraq’s Crude Oil Production and Exports Could Help Oil Bulls
Reuters estimated that Iraq’s crude oil production fell by 50,000 bpd (barrels per day) to 4,330,000 bpd in November 2017—compared to the previous month.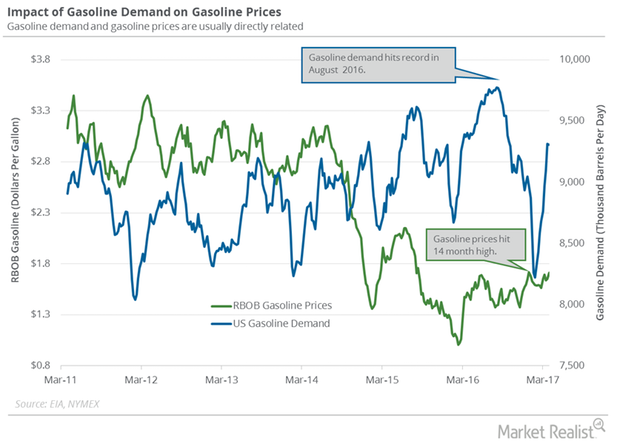
US Gasoline Demand Might Support Crude Oil Bears
The EIA estimated that four-week average US gasoline demand fell by 6,000 bpd (barrels per day) to 9,306,000 bpd from March 24–31, 2017.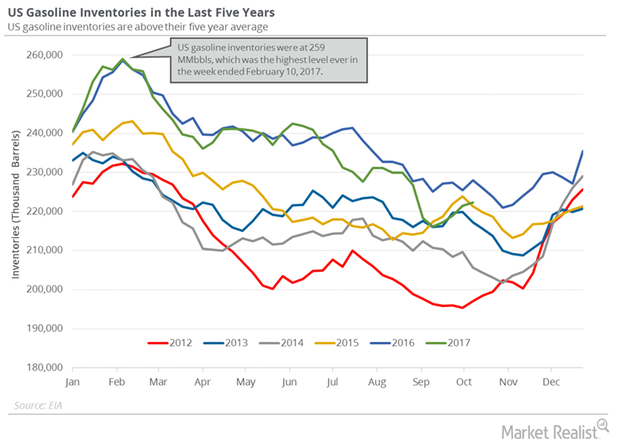
US Gasoline Inventories: Will Crude Oil’s Rally Be Short-Lived?
US gasoline inventories rose for the fourth straight week. The inventories are 8.5 MMbbls or 4% higher than the five-year average.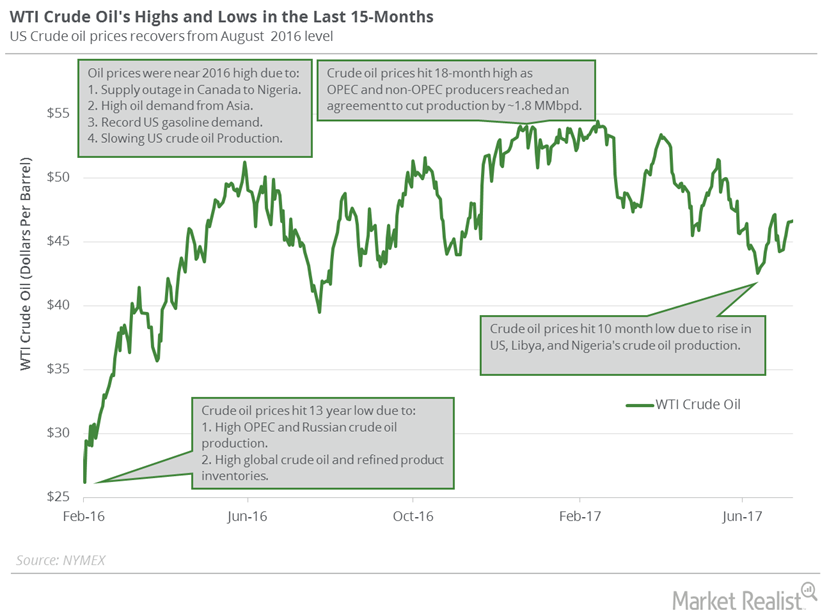
Will US Crude Oil Prices Outperform in 2H17?
WTI crude oil (BNO) (PXI) (UCO) (XOP) prices have fallen 18% year-to-date. They have fallen 7% in the past year due to bearish drivers.
How Could Hillary Clinton Impact the US Energy Market?
Hillary Clinton’s energy proposal implementation might slow down US crude oil production activity. It would be bullish for US crude oil prices.
How Geopolitical Tensions Are Affecting Oil Prices
Supply outages in the Kurdistan region supported crude oil (BNO) (USO) (USL) prices last week.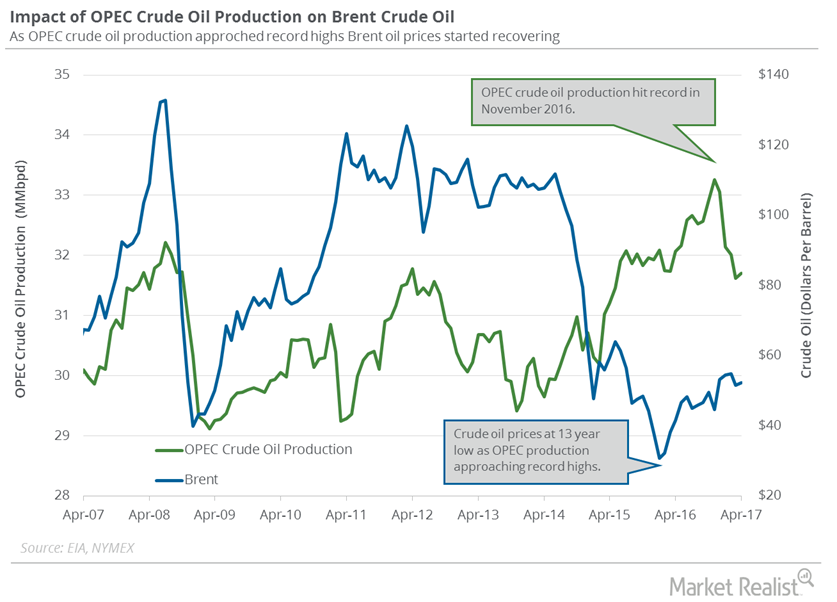
OPEC’s Crude Oil Production: Key for Crude Oil Traders?
A Bloomberg survey estimates that OPEC’s crude oil production rose by 315,000 bpd to 32.21 MMbpd in May 2017—compared to the previous month.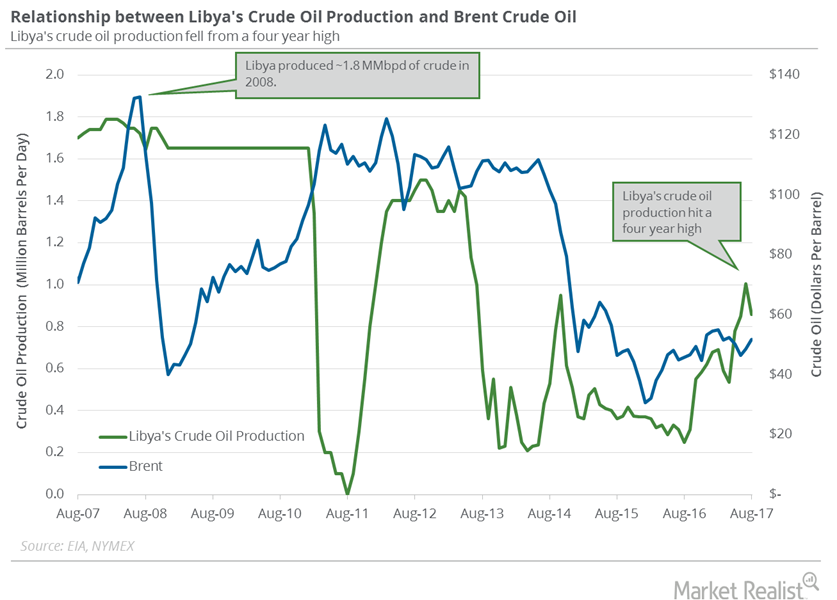
What to Expect from Libya’s Crude Oil Production in September
The EIA estimates that Libya’s crude oil production fell by 145,000 bpd (barrels per day) to 860,000 bpd in August 2017—compared to the previous month.
US Crude Oil Inventories: Bearish Driver for Crude Oil
The EIA estimates that US oil inventories rose by 1,854,000 barrels to 458.9 MMbbls (million barrels) on November 3–10, 2017.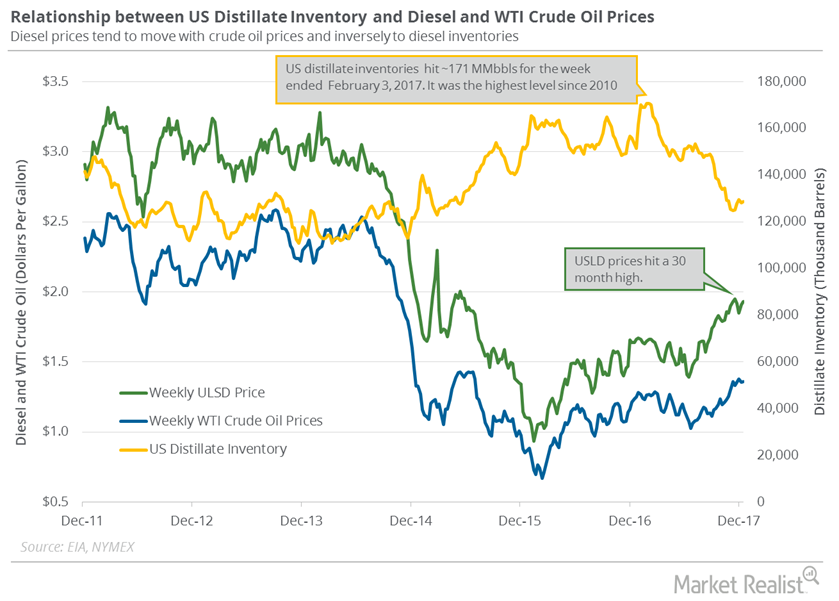
US Distillate Inventories Rose for the Fourth Time in 5 Weeks
US distillate inventories rose for the fourth time in the last five weeks. They rose ~3% in the last five weeks, which is bearish for diesel and oil prices.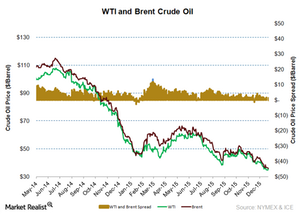
Why Is Brent-WTI Crude Oil Spread Widening in 2016?
US crude oil production has not slowed down in 2016 as expected, so prices started to fall more than expected in 2016. The Brent-WTI spread widened in February.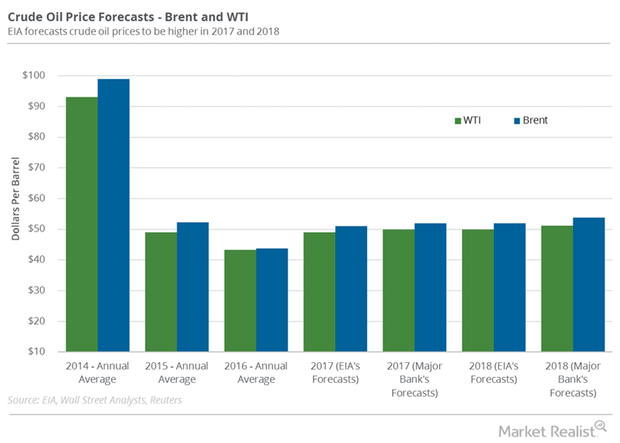
Crude Oil: Price Forecasts and Hedge Funds’ Position
Hedge funds increased their net long positions in US crude oil futures and options by 43,861 contracts or 18.4% to 282,362 contracts on July 25–August 1.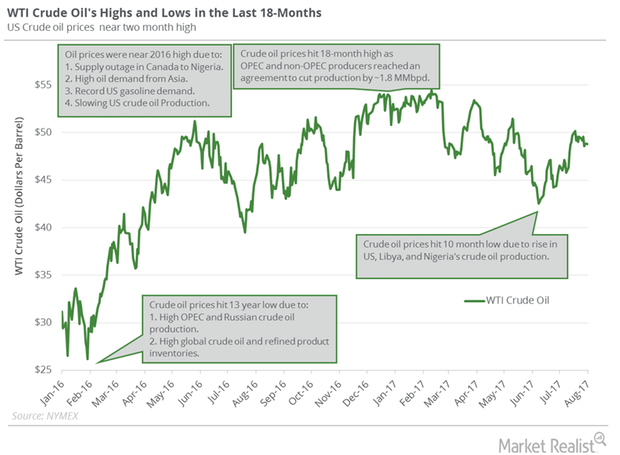
Will US Crude Oil Futures Surpass their 200-Day Moving Average?
Let’s track some important events for oil and gas traders from August 14 to 18, 2017.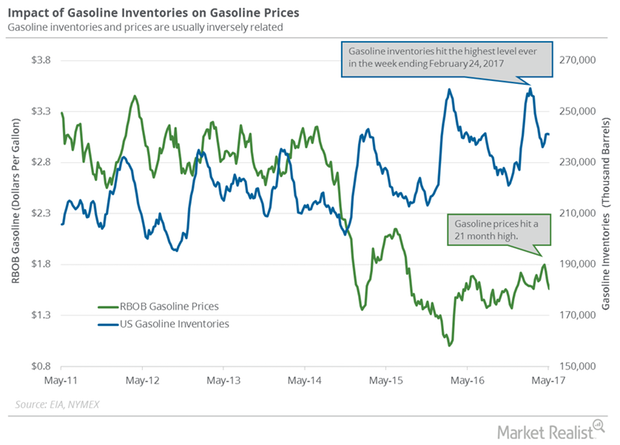
Traders Focus on the API and EIA’s Crude Oil Inventories
On May 16, 2017, the API released its weekly crude oil inventory report. US crude oil inventories rose by 0.8 MMbbls (million barrels) on May 5–12, 2017.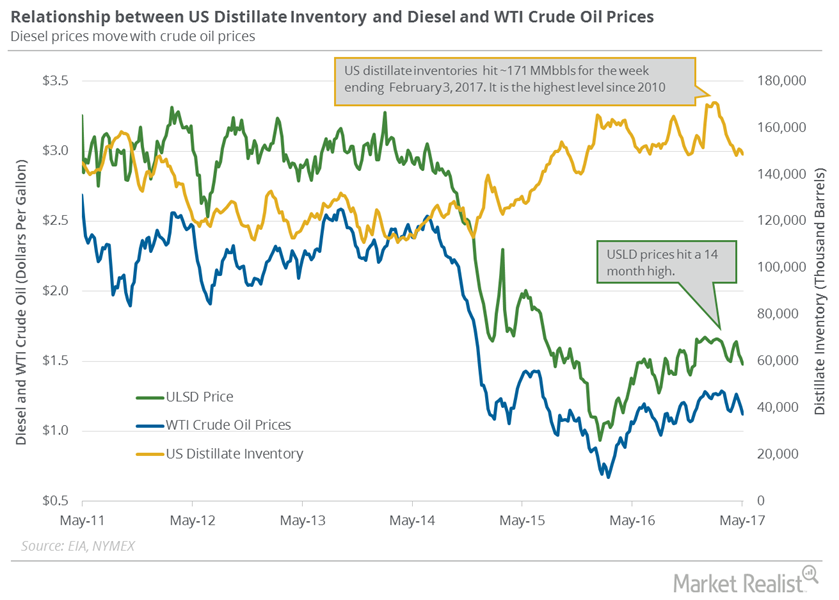
Why Did US Distillate Inventories Fall Again?
June diesel futures contracts rose 2.1% to $1.47 per gallon on May 10, 2017. Prices rose due to the larger-than-expected fall in distillate inventories.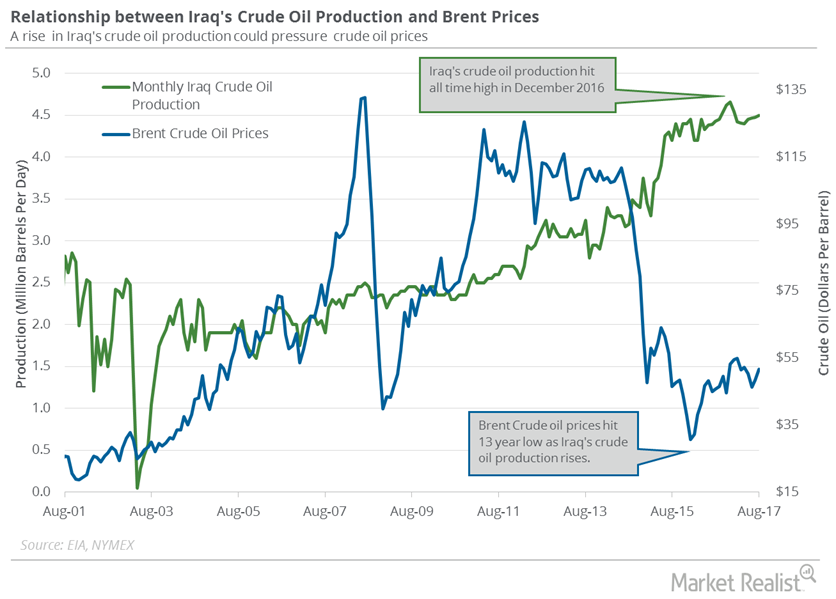
Kurdistan Referendum: Time to Buy Crude Oil Futures?
On September 25, 2017, the people in Kurdistan voted in a referendum for independence. As a result, Turkey blocked 500,000 bpd of crude oil exports.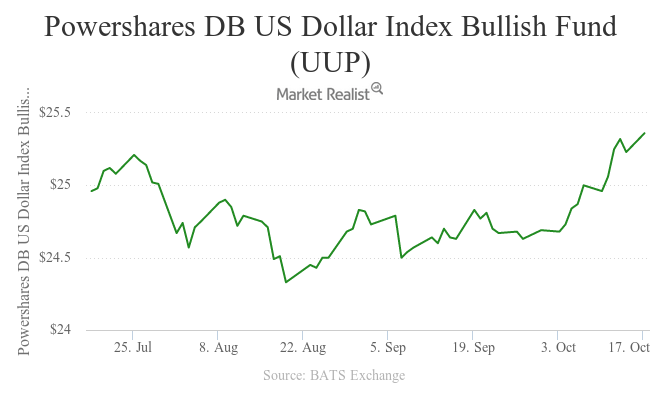
US Dollar near 7-Month High: Will It Pressure Crude Oil Prices?
November West Texas Intermediate crude oil futures contracts fell 0.8% and settled at $49.94 per barrel on October 17, 2016.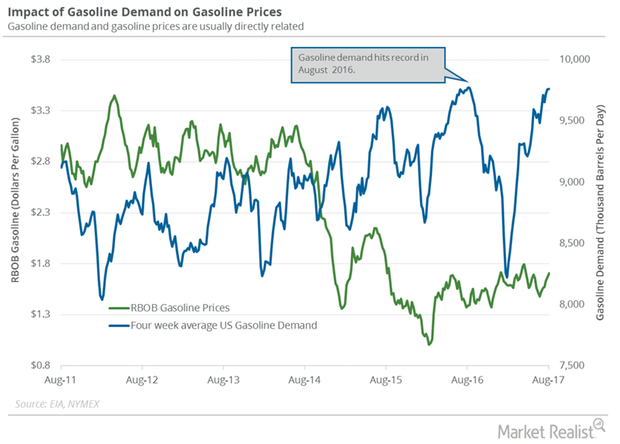
How Supply Outages Affect Crude Oil Prices
The EIA (U.S. Energy Information Administration) estimates that Libya’s crude oil production rose by 160,000 bpd (barrels per day) to 1.0 MMbpd (million barrels per day) in July 2017 compared to the previous month.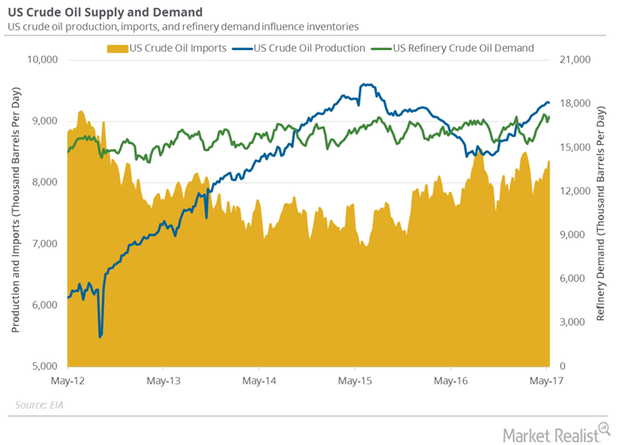
US Refinery Demand Impacts Crude Oil Inventories
US refineries operated at 93.4% of their operable capacity in the week ending May 5, 2017. The rise in refinery demand is bullish for crude oil prices.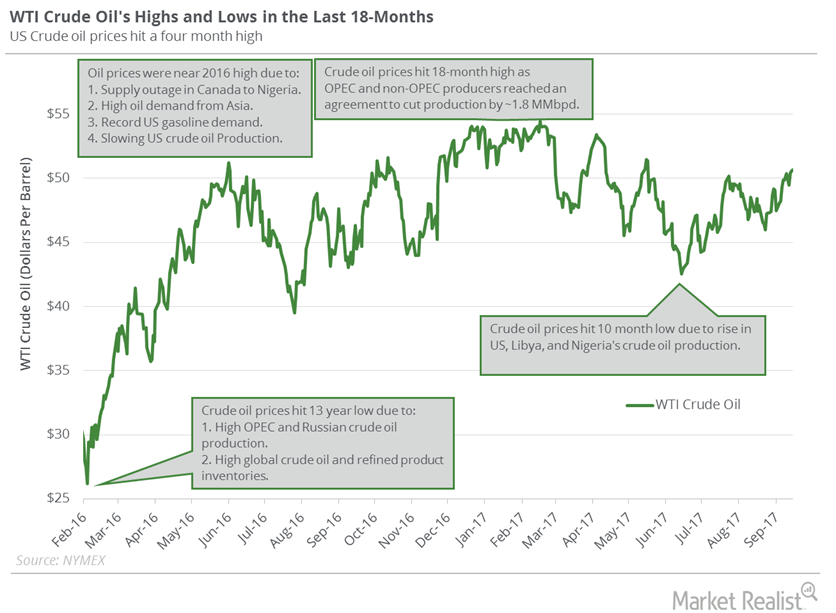
Will US Crude Oil Futures Fall from 4-Month Highs?
WTI (West Texas Intermediate) crude oil (RYE) (VDE) futures hit $26.21 per barrel on February 11, 2016—the lowest level in more than a decade.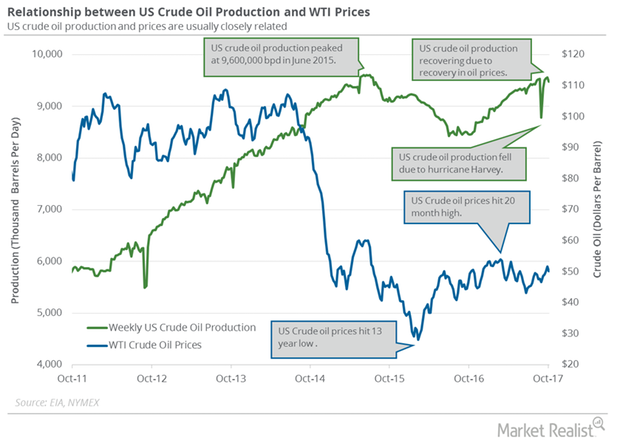
Why US Crude Oil Production Hit a 5-Week Low
The US Energy Information Administration (or EIA) released its “Weekly Petroleum Status Report” on October 12. It estimates that US crude oil production fell by 81,000 bpd (barrels per day).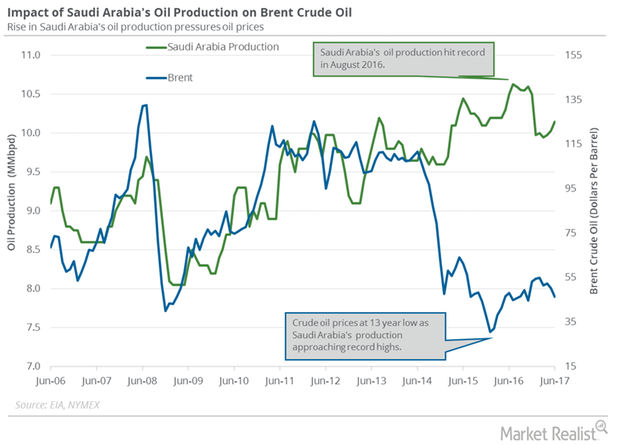
Will Saudi Arabia Remove Excess Oil from the Market?
Saudi Arabia is expected to cut exports 10% to North Asian refiners in September 2017 due to OPEC’s production cut deal.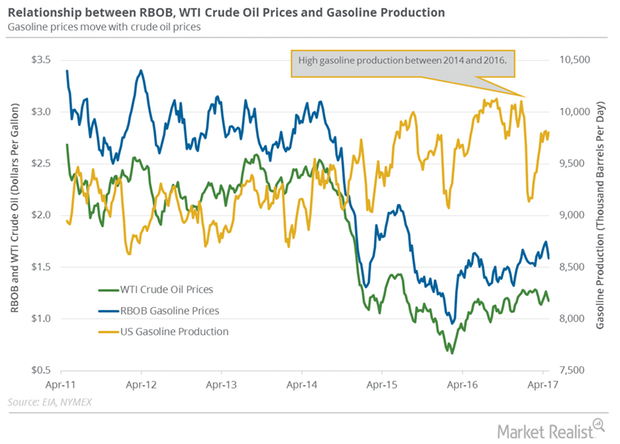
US Crude Oil and Gasoline Futures Moved Together
June gasoline futures contracts rose 1.3% to $1.53 per gallon on May 3, 2017. Prices rose due to the less-than-expected rise in US gasoline inventories.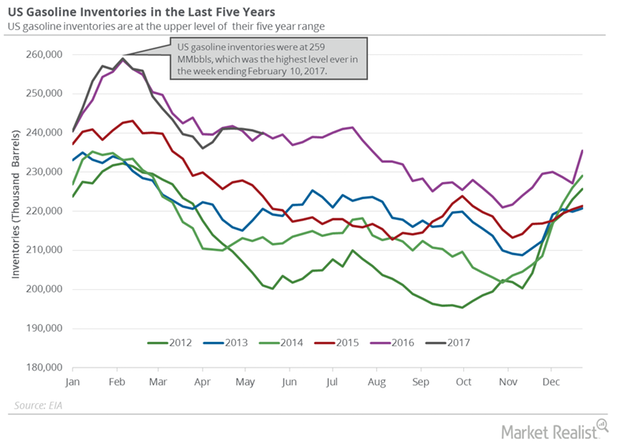
US Gasoline Inventories Fell Less, Pressured Gasoline Prices
The EIA released its weekly crude oil report on May 24, 2017. US gasoline inventories fell by 0.8 MMbbls to 239.9 MMbbls on May 12–19, 2017.