
Gordon Kristopher
Disclosure: I am in full compliance with all ethics and other policies for Market Realist research analysts. I am not invested in securities that I cover on Market Realist.
More From Gordon Kristopher
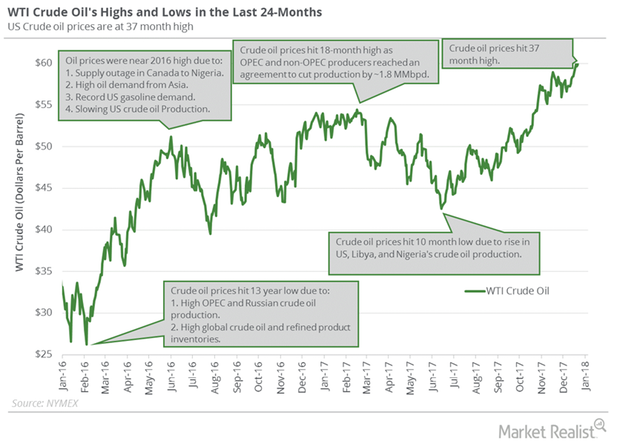
Will Crude Oil Futures Rise or Fall This Week?
WTI crude oil (SCO) futures settled at $64.30 per barrel on January 12, 2018—the highest level since December 2014.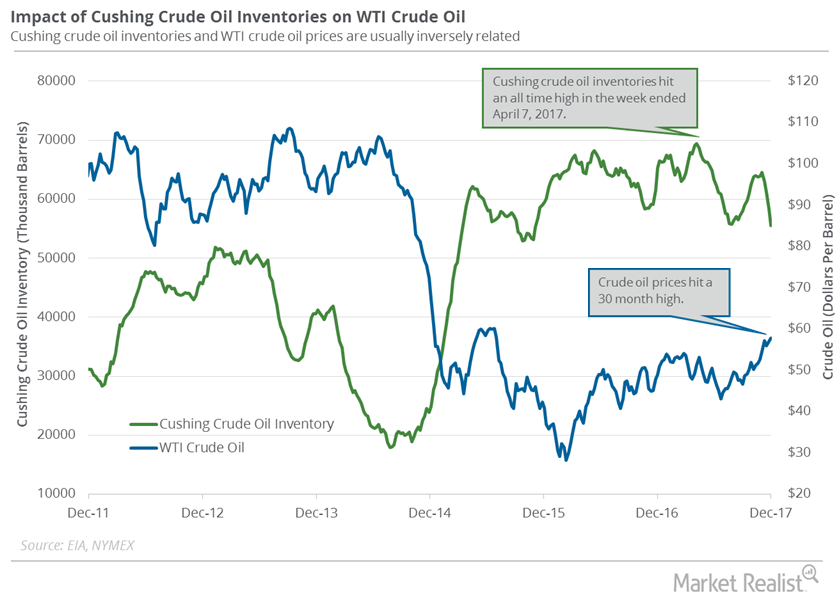
Cushing Oil Inventories Are near November 2015 Low
The EIA estimated that Cushing’s crude oil inventories fell by 2,753,000 barrels or 4.7% to 55.5 MMbbls (million barrels) on November 24–December 1, 2017.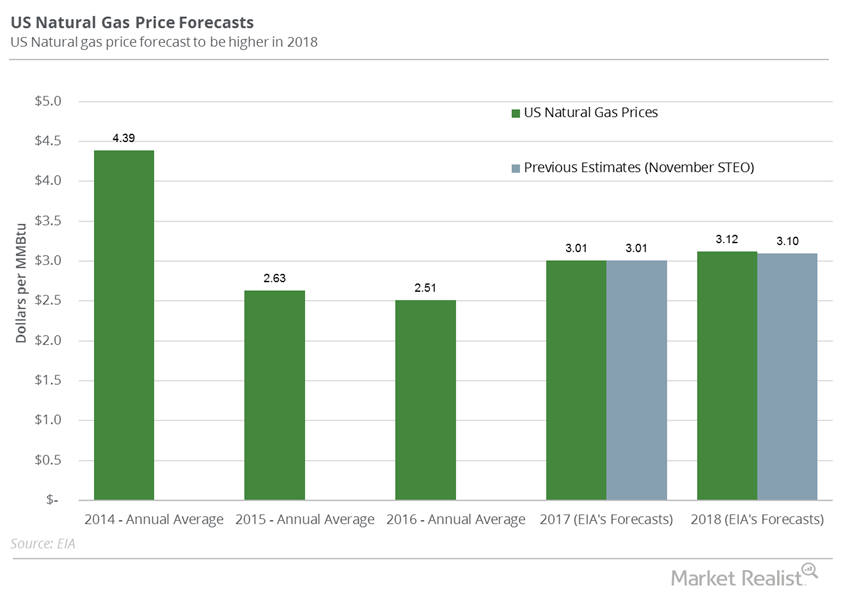
Will US Natural Gas Futures Fall More?
US natural gas (GASL) futures contracts for January delivery were below their 20-day, 50-day, and 100-day moving averages on December 14, 2017.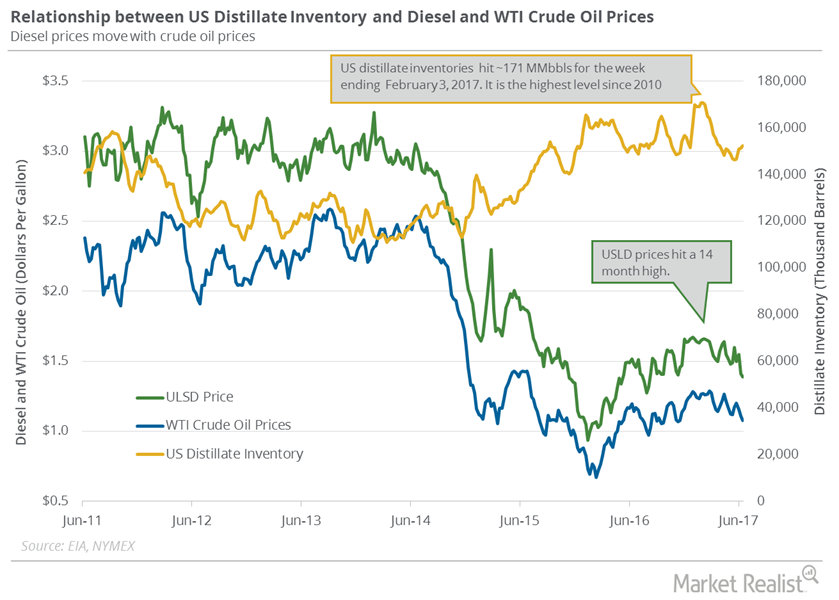
US Distillate Inventories Rose for the Fourth Straight Week
US distillate inventories rose by 1.1 MMbbls to 152.5 MMbbls on June 9–16, 2017. US distillate inventories rose for the fourth consecutive week.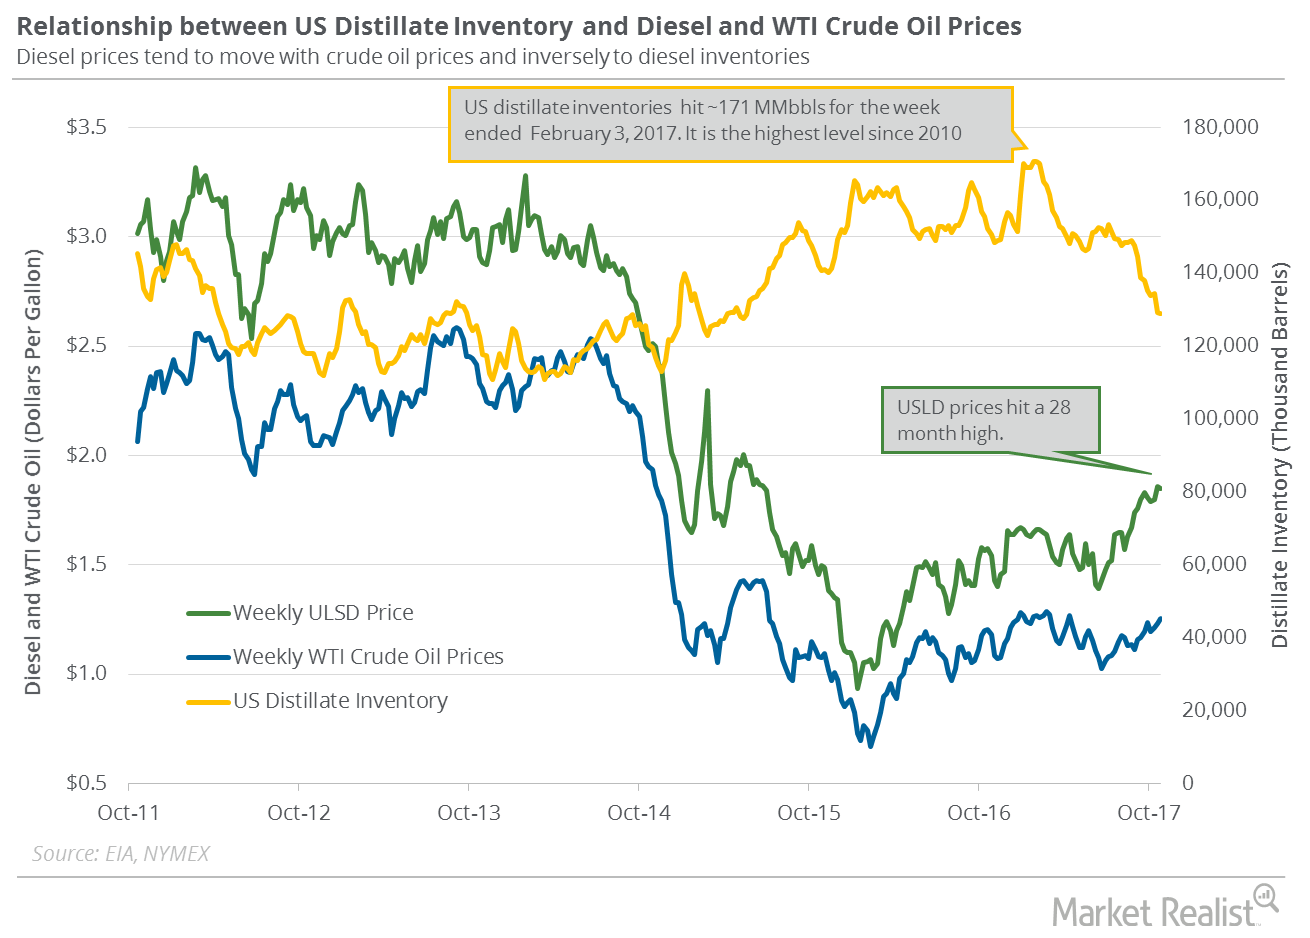
US Distillate Inventories Are near a 3-Year Low
US distillate inventories fell by 302,000 barrels to 128.9 MMbbls (million barrels) on October 20–27, 2017. It’s the lowest level since April 10, 2015.
US Natural Gas Consumption Could Help the Prices
US natural gas consumption fell 0.17% to 57.1 Bcf/d (billion cubic feet per day) on October 12–18, 2017. It rose 3.1% from the same period in 2016.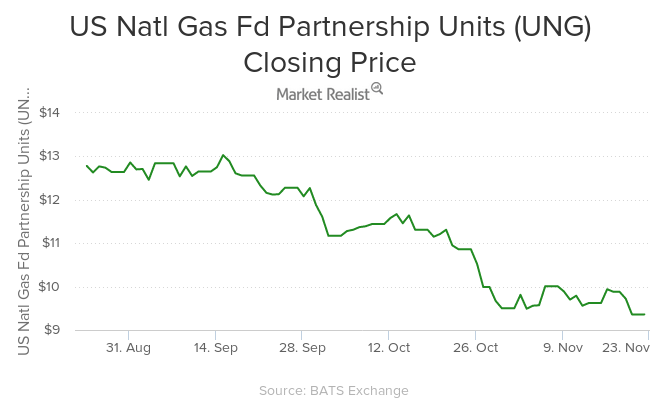
Natural Gas Prices Slump 9.4% for the Week
ETFs like the United States Natural Gas—UNG—ETF fell in the direction of natural gas prices on November 20, 2015. UNG fell by 4.7% on the day.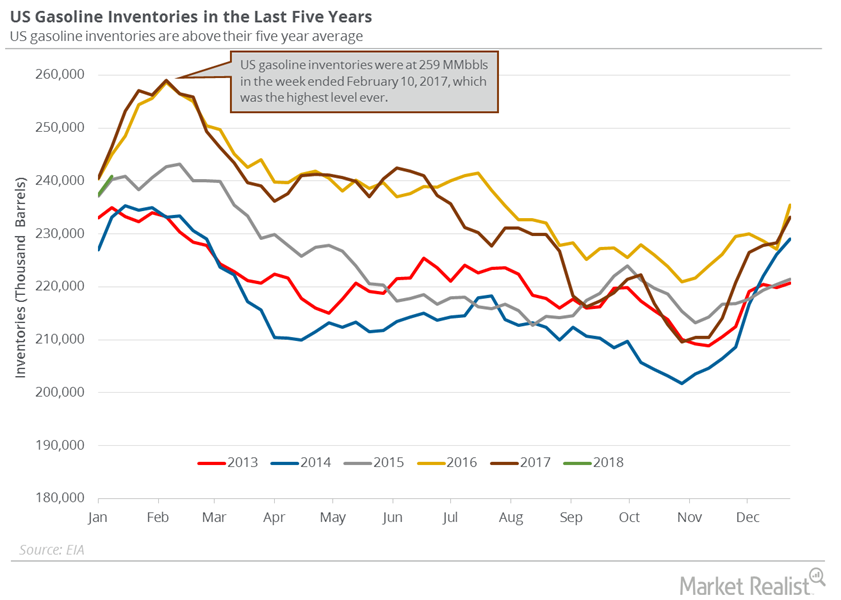
Gasoline Inventories Could Cap the Upside for Oil Prices
On January 23, 2018, the API released its crude oil inventory report. US gasoline inventories increased by 4.1 MMbbls on January 12–19, 2018.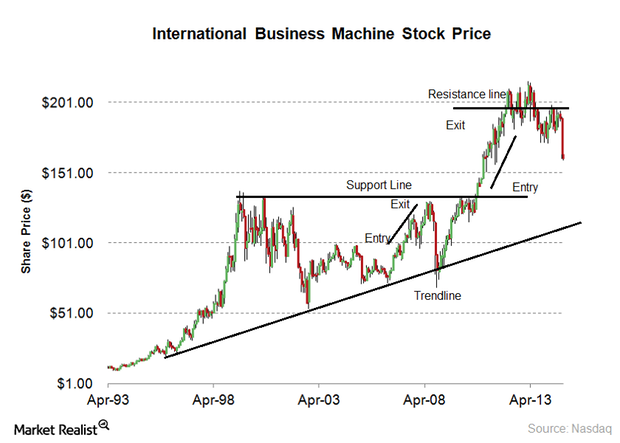
Must-know: A glossary of technical analysis terms
In technical analysis, there’s a series of common terms. Understanding the glossary of technical analysis terms is helpful for investors. Technical analysis is used to predict stock prices. It uses price, time, and volume data.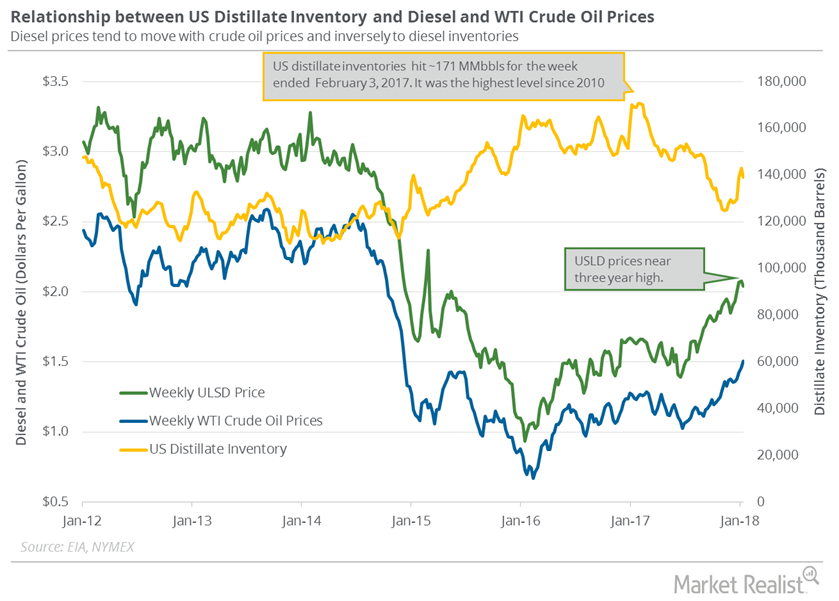
US Distillate Inventories Fell for the Third Time in 10 Weeks
US distillate inventories fell by 3.8 MMbbls or 2.7% to 139.2 MMbbls on January 5–12, 2018. The inventories fell by 29.9 MMbbls or 18% from a year ago.
How OPEC and Saudi Arabia Drive Crude Oil Prices
October WTI (West Texas Intermediate) crude oil (RYE)(VDE)(XLE) futures contracts rose 0.84% and were trading at $47.8 per barrel in electronic trading at 2:15 AM EST today.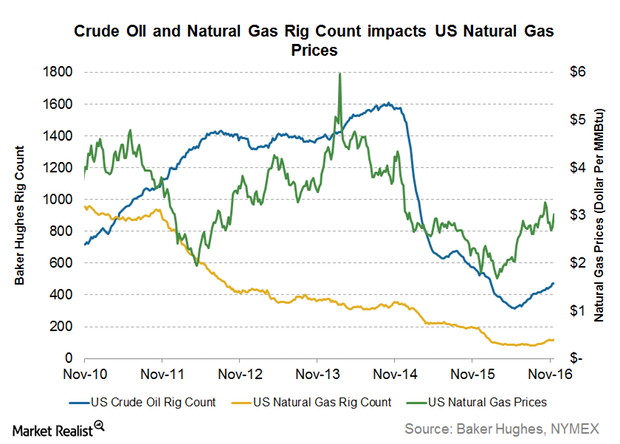
How Crude and Natural Gas Rig Counts Affected Natural Gas Prices
The US natural gas rig count rose by two to 118 rigs between November 18 and November 23, 2016.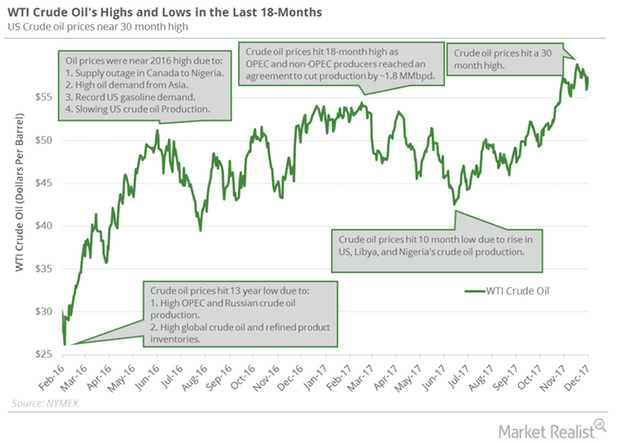
Will Crude Oil Futures Be Range Bound or Trend Higher?
US crude oil (DWT) futures hit $58.95 per barrel on November 24, 2017, which was the highest level in the last 30 months.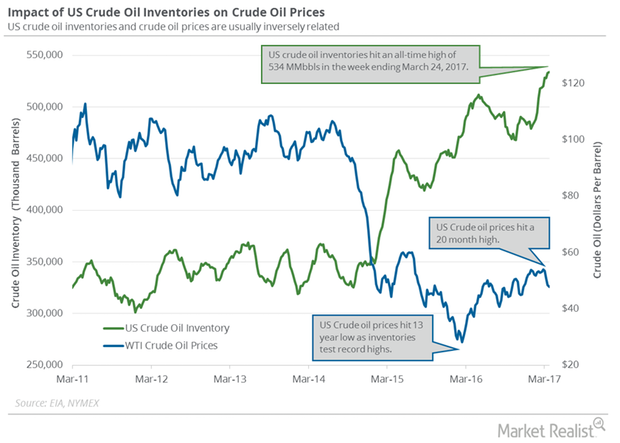
Energy Calendar: Analyzing Key Oil and Gas Drivers
The energy sector contributed to ~6.6% of the S&P 500 on March 31, 2017. Oil and gas producers’ earnings depend on crude oil and natural gas prices.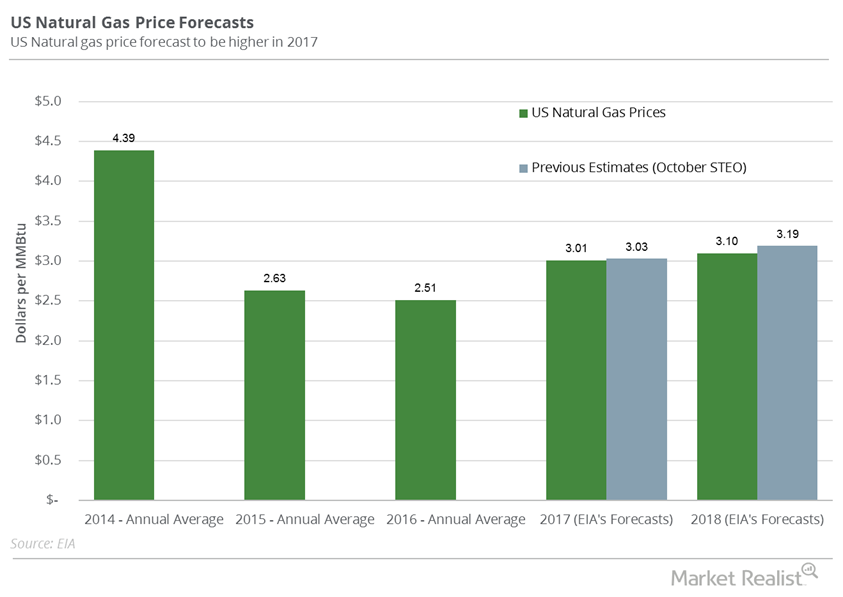
Hedge Funds: Bullish or Bearish on Natural Gas?
Aegent Energy Advisors predicts that US natural gas prices might not exceed $3.18 per MMBtu by December 2017.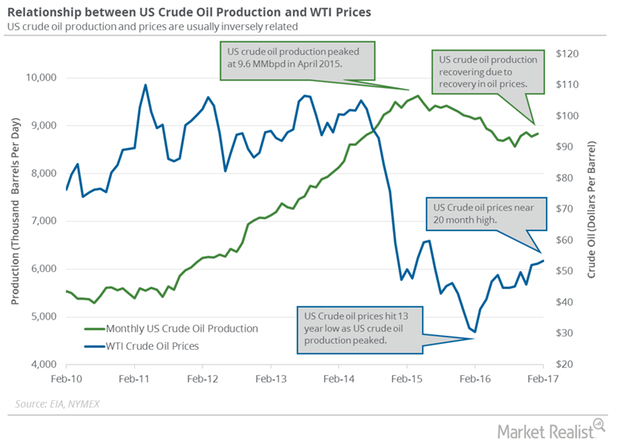
Monthly US Crude Oil Production Hit May 2016 High
The EIA reported that monthly US crude oil production rose by 60,000 bpd (barrels per day) to 8.8 MMbpd in January 2017—compared to the previous month.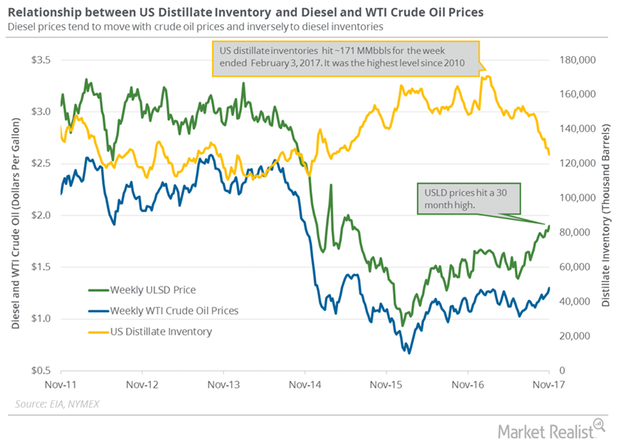
US Distillate Inventories Are at 32-Month Low
The EIA reported that US distillate inventories fell by 3,359,000 barrels to 125.5 MMbbls (million barrels) or 2.6% between October 27, 2017, and November 3, 2017.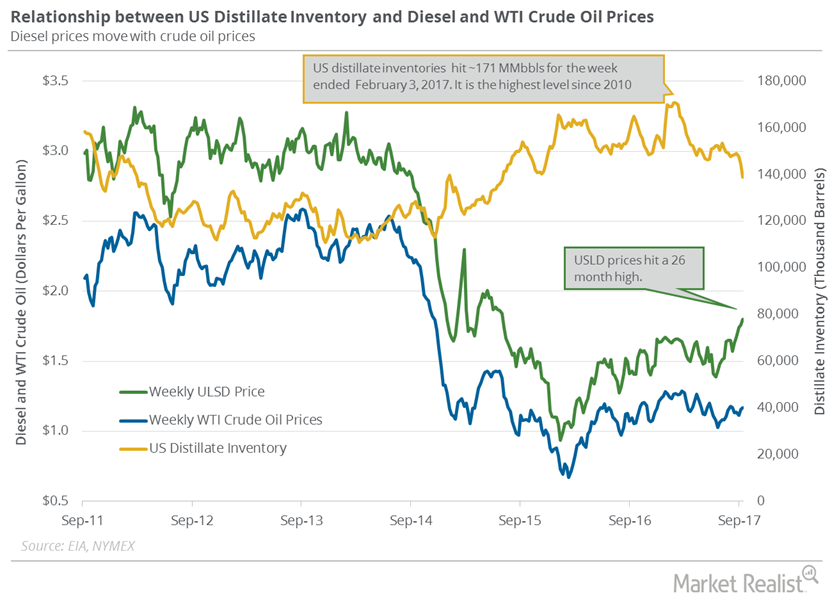
Distillate Inventories: More Bullish News for Oil
The US Energy Information Administration (or EIA) released its weekly crude oil and gasoline inventory report on September 20, 2017.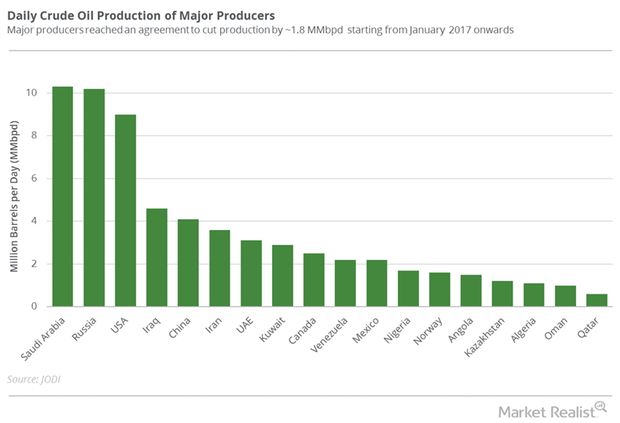
Will OPEC and Russia Announce Deeper Production Cuts?
The OPEC and non-OPEC monitoring committee meeting will be held on July 24, 2017, in Russia. The meeting will discuss production cut deal compliance.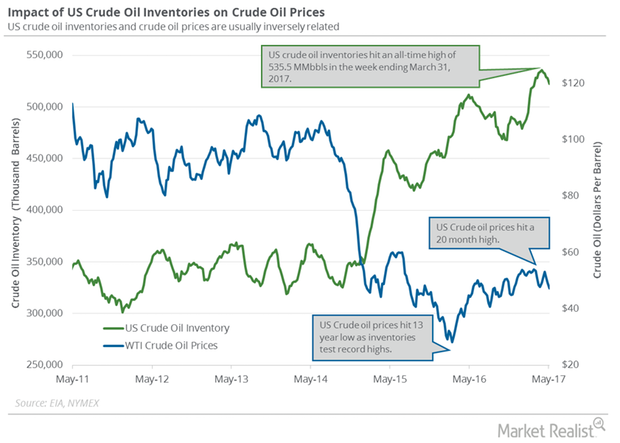
What’s on the Energy Calendar for Oil and Gas Traders This Week?
The US energy sector contributed to ~6.3% of the S&P 500 (SPY) (SPX-INDEX) on May 12, 2017.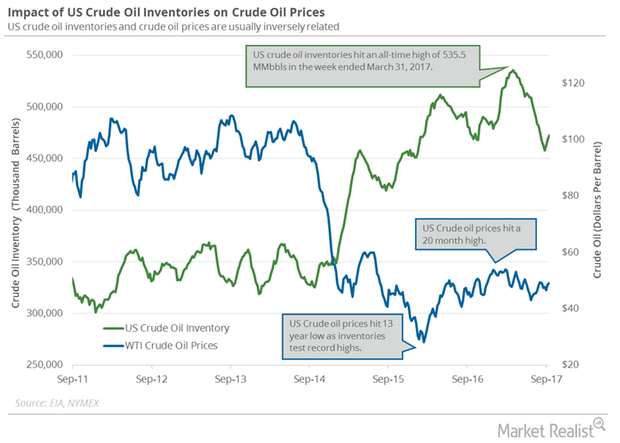
Will OPEC Meeting in Vienna Affect Crude Oil Futures?
November US crude oil (UWT) (SCO) (DBO) futures contracts rose 1.6% and closed at $49.3 per barrel on September 20, 2017.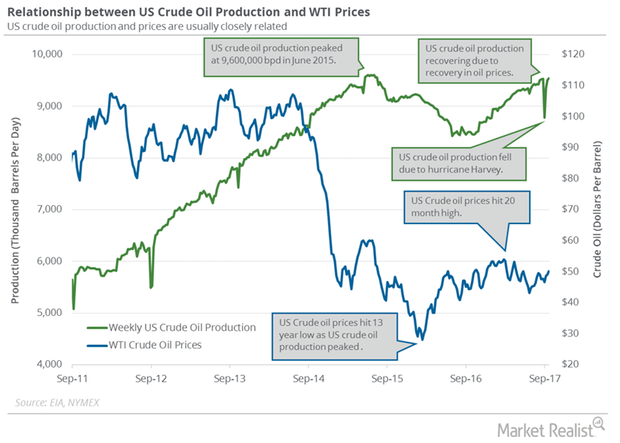
What US Crude Oil Production’s 26-Month High Could Mean
On September 27, 2017, the EIA estimated that US crude oil production rose 37,000 bpd (barrels per day) to ~9.5 MMbpd from September 15–22, 2017.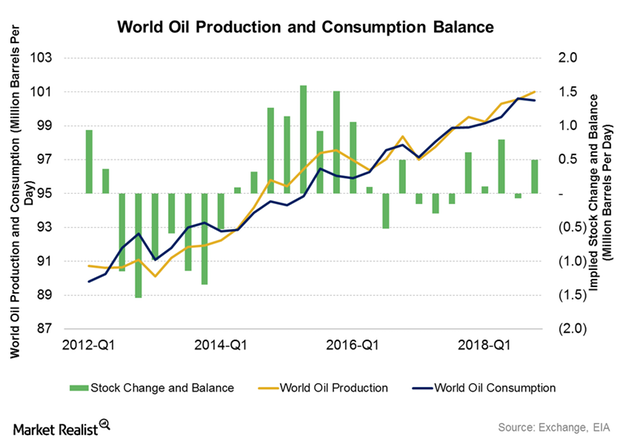
Inside the Global Crude Oil Supply-Demand Gap
The EIA estimated that the global crude oil supply-demand gap averaged 0.58 MMbpd (million barrels per day) in 1H16.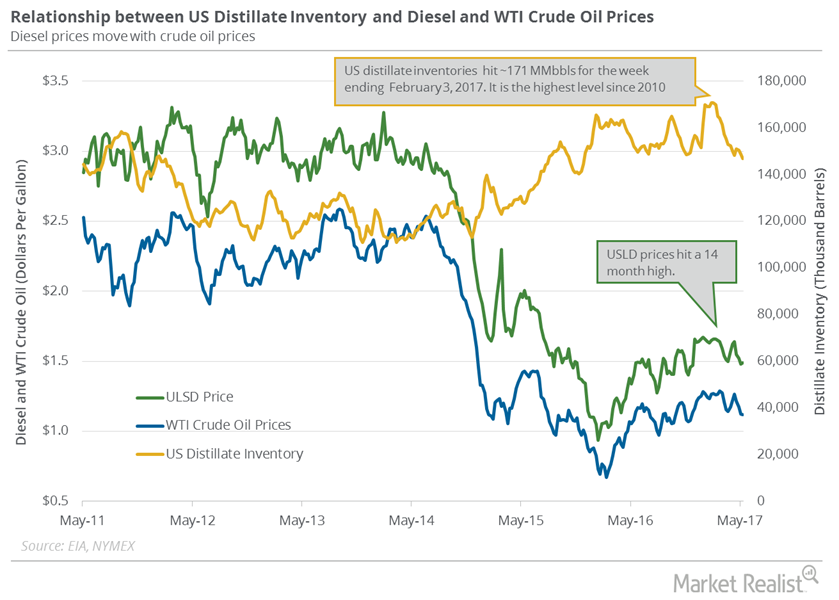
US Distillate Inventories Fell for the Third Straight Week
The EIA reported that US distillate inventories fell by 1.9 MMbbls (million barrels) to 146.8 MMbbls on May 5–12, 2017.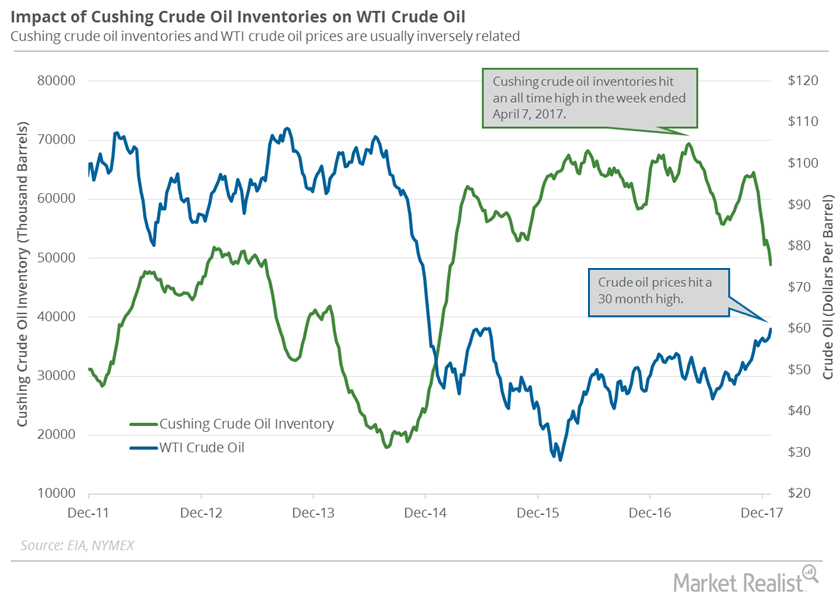
Cushing Inventories Hit February 2015 Low
A Bloomberg survey estimated that the crude oil inventories at Cushing could have fallen by 1.5 MMbbls between December 29, 2017, and January 5, 2018.
Will US Natural Gas Futures End 2017 on a Low Note?
January US natural gas (UGAZ) futures contracts were below their 100-day, 50-day, and 20-day moving averages on December 21, 2017.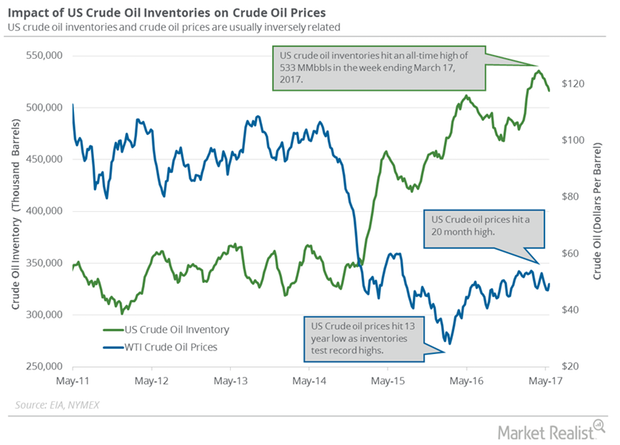
Massive Draw in US Crude Oil Inventories: Just the Beginning?
The API estimated that US crude oil inventories fell by 8.67 MMbbls on May 19–26. US crude oil inventories also fell by 19.77 MMbbls in the last five weeks.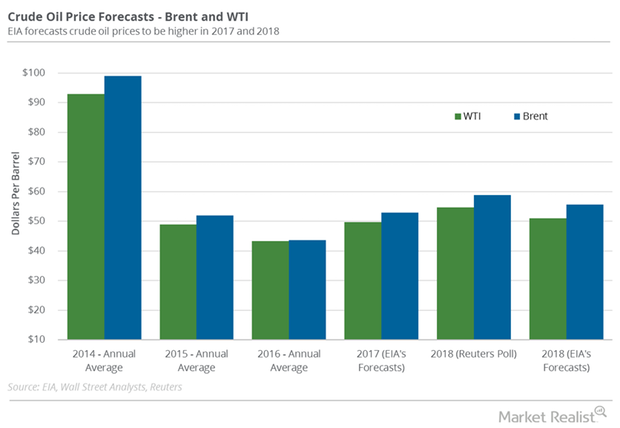
Crude Oil Prices Could End 2017 on a High Note
A Reuters poll estimated that WTI crude oil (USL) prices could average $54.78 per barrel in 2018 after extending the production cuts.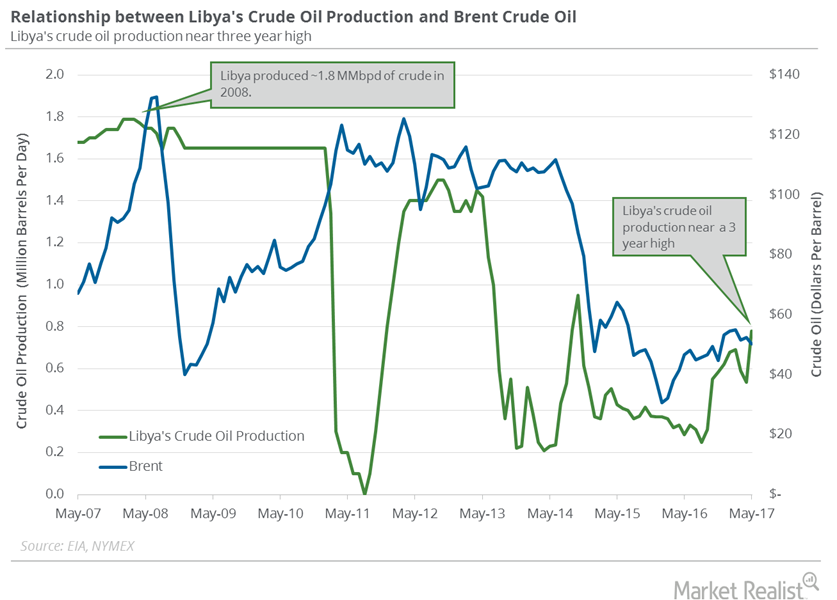
Libya’s Crude Oil Production Is at a 4-Year High
August West Texas Intermediate (or WTI) crude oil futures contracts rose $1.03 per barrel, or 2.2%, and settled at $47.07 per barrel on July 3, 2017.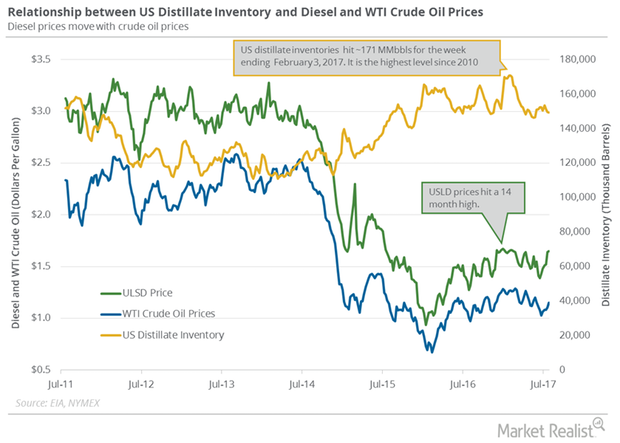
US Distillate Inventories Fell for the Fourth Straight Week
The EIA (U.S. Energy Information Administration) reported that US distillate inventories fell by 1.72 MMbbls to 147.7 MMbbls on July 28–August 4, 2017.
Crude Oil Futures: Next Important Resistance Level
WTI crude oil (UCO) futures closed at $62.01 per barrel on January 4, 2018—the highest level since December 2014. WTI prices rose ~12.4% in 2017.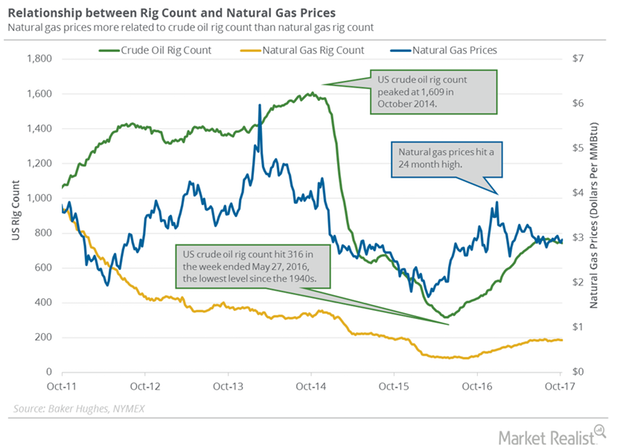
US Crude Oil Prices Could Pressure Natural Gas Futures
Baker Hughes is scheduled to release its US crude oil and natural gas rig count report on November 11, 2017.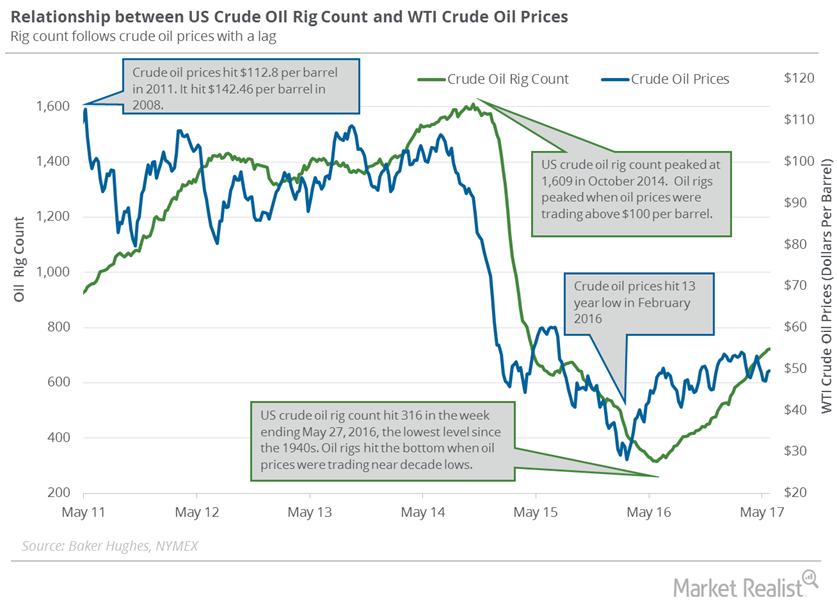
Will President Trump Boost the US Crude Oil Rig Count?
Baker Hughes released its weekly US crude oil rig count report on June 2. US crude oil rig counts rose by 11 to 733 between May 26, 2017, and June 2, 2017.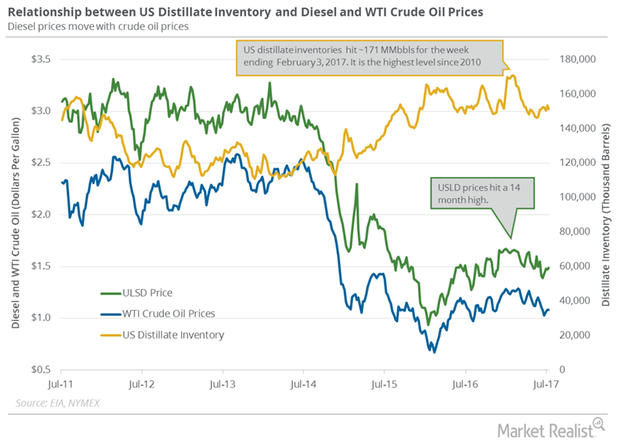
US Distillate Inventories Fell for the Fourth Time in 5 Weeks
The EIA reported that US distillate inventories fell by 1.9 MMbbls (million barrels) to 149.5 MMbbls on July 14–21, 2017.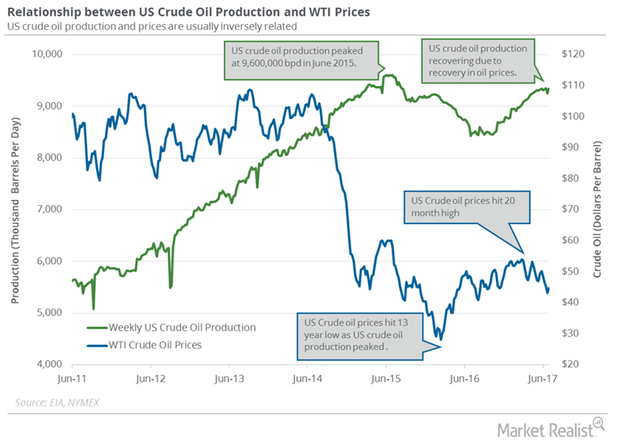
OPEC, Russia, and the US Could Pressure Crude Oil Futures
US crude oil (RYE) (VDE) (SCO) futures contracts for August delivery fell 2.8% and settled at $44.23 per barrel on July 7. Prices are near a ten-month low.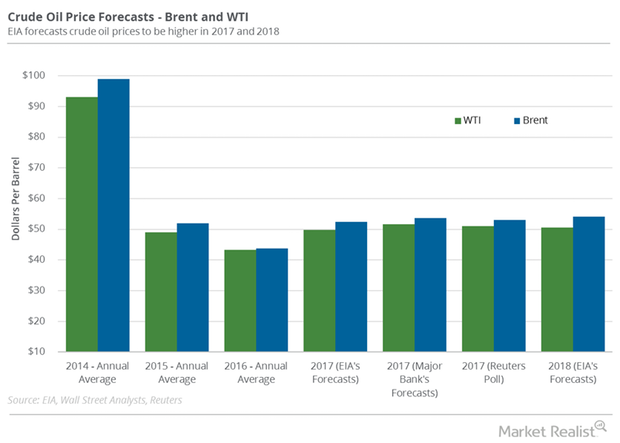
What to Expect from Crude Oil Prices in 2018
The EIA estimates that US crude oil (USO) (UCO) prices could average $49.7 per barrel in 2017—1.7% higher than the survey in September 2017.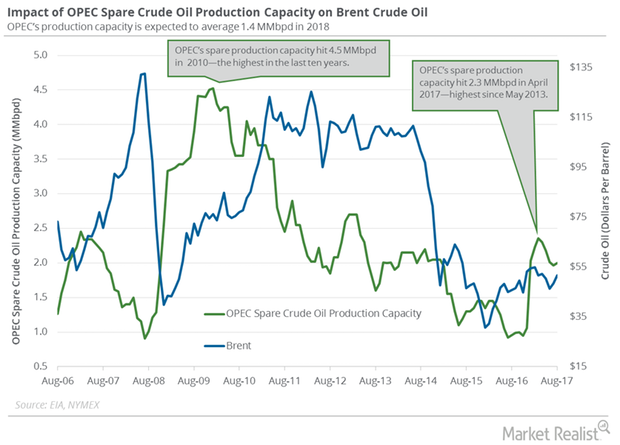
How OPEC’s Spare Crude Oil Production Capacity Is Recovering
The EIA estimates that OPEC’s spare crude oil production capacity rose 35,000 bpd (barrels per day) to 2 MMbpd (million barrels per day) in August 2017.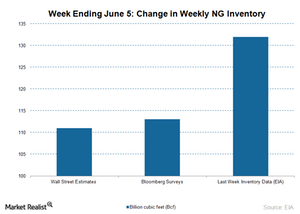
Natural Gas Prices Could Overshadow the Increasing Stockpile Data
The EIA will publish the weekly natural gas in storage report on June 11. US commercial natural gas inventories rose by 132 Bcf for the week ending May 29.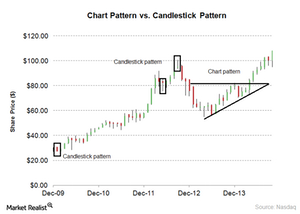
What Are Candlestick Patterns in Technical Analysis?
In technical analysis, candlestick patterns are a combination of one or more candlesticks. The patterns form over short time periods. The patterns form due to stock prices’ daily supply and demand forces.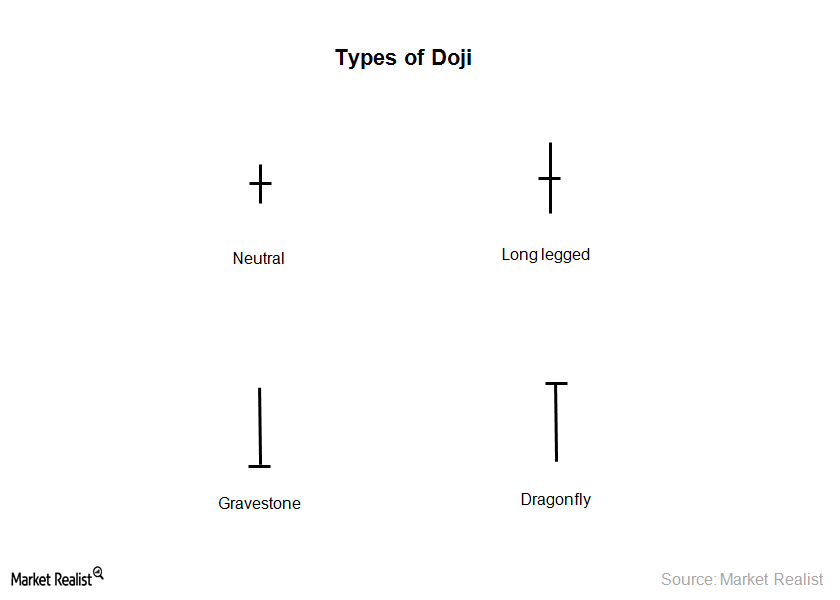
Understanding The Doji Candlestick Pattern In Technical Analysis
The Doji candlestick pattern has a single candle. In this pattern, the stock opening and closing prices are equal. The pattern forms due to indecision between the buyers and sellers in the stock market.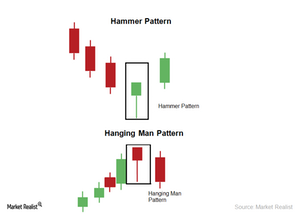
The Hammer And Hanging Man Candlestick Pattern
The Hanging Man pattern is the same as the Hammer pattern. When a Hammer pattern forms in an uptrend, it’s the Hanging Man pattern. The pattern has one candle.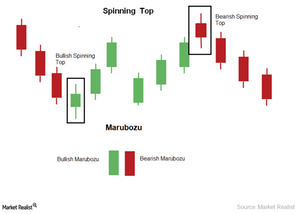
Understanding The Spinning Top And Marubozu Candlestick Pattern
The Marubozu candlestick pattern has a single candle. It forms anywhere in the trend. It can be a long and bearish candle. It can also be a long and bullish candle.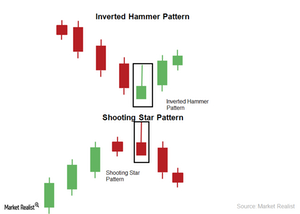
The Inverted Hammer And Shooting Star Candlestick Pattern
A Shooting Star candlestick pattern has one candle. It looks like a shooting star. The open, close, and low are near the low of the candlestick.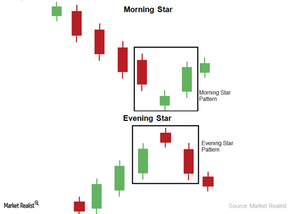
Analyzing The Morning Star And Evening Star Candlestick Pattern
The Evening Star candlestick pattern is also a reversal pattern. The pattern has three candles. It forms at the top of an uptrend. The first candle is any long and bullish candle.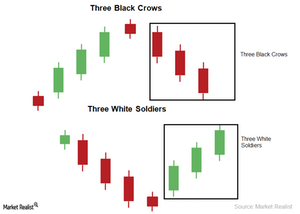
Three Black Crows And Three White Soldiers Candlestick Pattern
The Three White Soldiers candlestick pattern is also a reversal pattern. It forms at the bottom of a downtrend. The pattern has three candles. All three of the candles are long and bullish.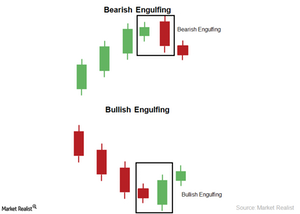
The Bearish Engulfing and Bullish Engulfing Candlestick Pattern
The Bullish Engulfing candlestick pattern is a reversal pattern. The pattern has two candles. The first candle is small and bearish. The second candle is long and bullish.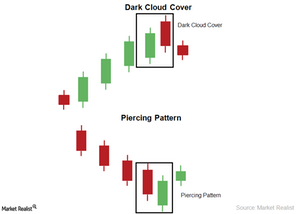
Dark Cloud Covering And Piercing Candlestick Pattern
The Piercing candlestick pattern is a reversal pattern. The pattern has two candles. The first candle is bearish. The second candle is bullish.Financials What’s the Dow Theory?
The Dow Theory was developed by Charles Dow. It identifies and signals the change in the stock market trends. It’s useful for trading and investing. The Dow Theory has six components.Financials Why it’s important to understand the Dow Theory
The Dow Theory assumes that when a stock market is entering an uptrend or downtrend, the financial markets should agree with each other.Financials Why is the Elliott Wave Theory important in technical analysis?
In the last part of this series, we provided an overview of the Elliott Wave Theory. In this part of the series, we’ll discuss the psychology behind the Elliott Wave Theory’s two phases.
