
Gordon Kristopher
Disclosure: I am in full compliance with all ethics and other policies for Market Realist research analysts. I am not invested in securities that I cover on Market Realist.
More From Gordon Kristopher
Financials Technical indicators and the Relative Strength Index
The Real Strength Index (or RSI) is a measure of a stock’s overbought and oversold position. The commonly used RSI is a 14-day RSI. It refers to the 14-day stock price that’s used to calculate the RSI.Financials Interpreting volume in technical analysis
In technical analysis, volume measures the number of a stock’s shares that are traded on a stock exchange in a day or a period of time. Volume is important because it confirms trend directions.Financials Technical analysis – technical indicators, Dow Theory, and Elliott Wave Theory
We’ll discuss the importance and use of these technical indicators. These indicators are useful in determining trends and making informed decisions.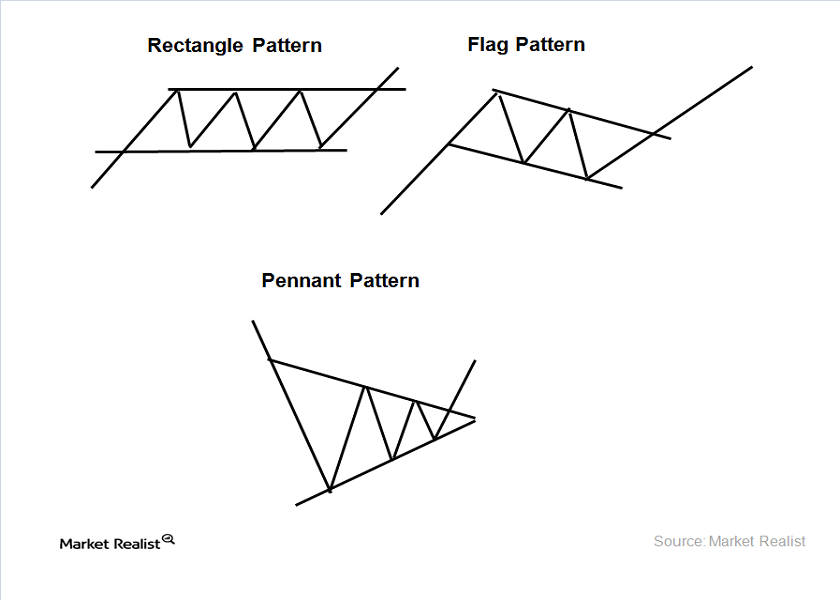
Technical analysis—the rectangle, flag, and pennant patterns
In the rectangle pattern, it’s advisable to buy stock at support and sell at resistance. This pattern is formed in the uptrend and downtrend.Financials Why the inverted head and shoulder pattern is formed
The inverted head and shoulder pattern is the reverse of the head and shoulder pattern. It’s formed at the bottom of the downtrend.Financials Double top and double bottom patterns in technical analysis
The double top pattern forms in the uptrend. In this pattern, two consecutive peaks are formed. The peaks both have roughly the same price level.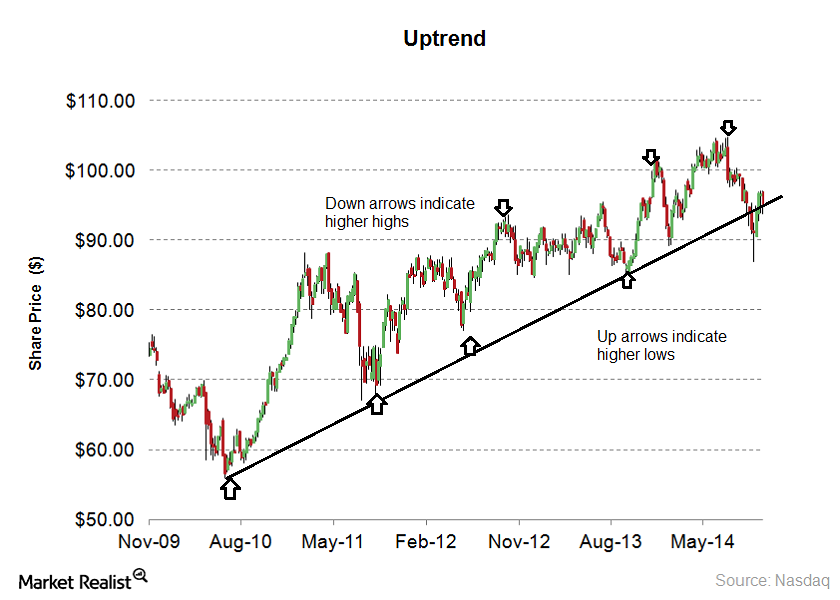
Why investors should buy stocks during an uptrend
Stocks are in an uptrend when they’re making higher highs and higher lows. An uptrend forms when psychological or fundamental factors are improving.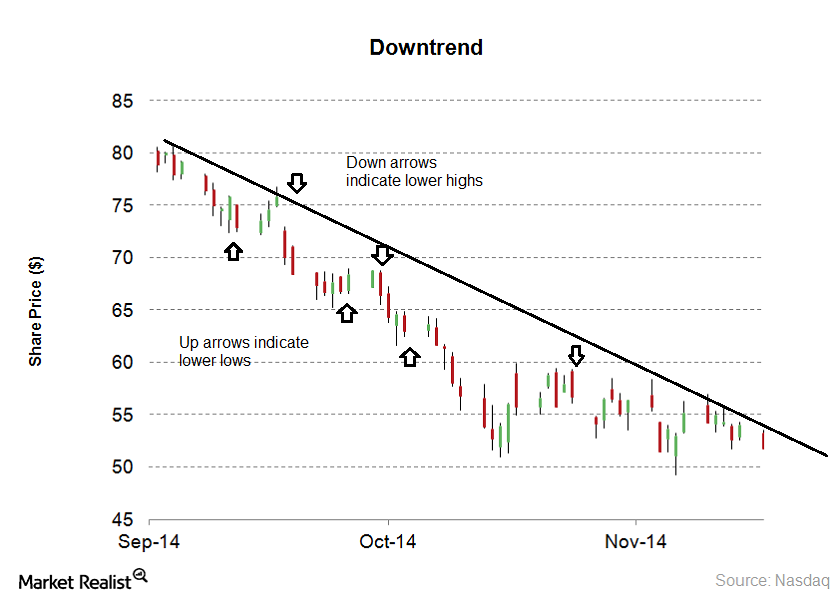
Why downtrends and sideways trends impact investors
It’s advisable to sell stocks on bounces when the stock is in a downtrend. In a sideways trend, it’s advisable to buy stock at support levels and sell at resistance levels.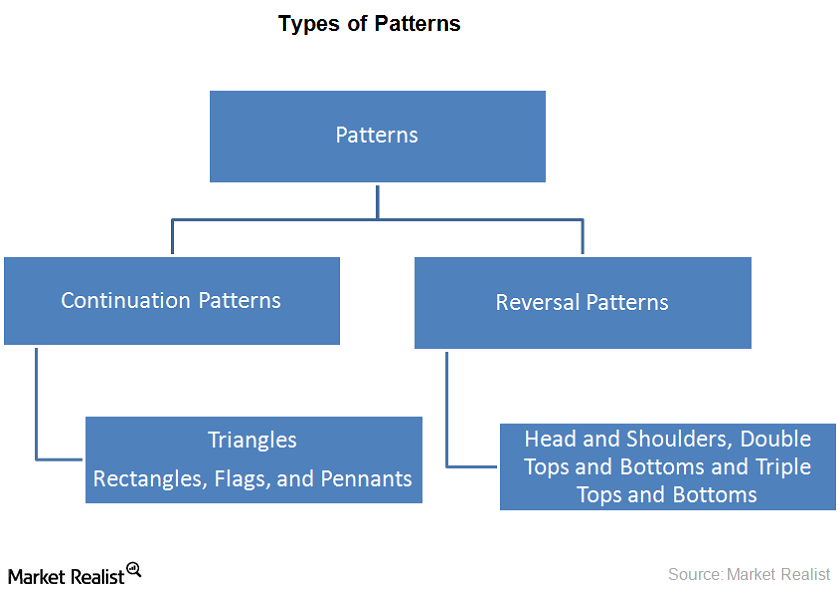
Why technical analysis uses price patterns
Price patterns are trends that occur in stock charts. The charts are used in technical analysis. The pattern forms recognizable shapes. Price patterns are used to forecast the prices.Energy & Utilities What are the advantages of technical analysis?
Entry and exit strategy is recommended for short and long-term trading in technical analysis. Fundamental analysis is used for the long-term entry and exit point.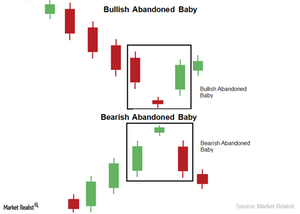
The Bullish And Bearish Abandoned Baby Candlestick Pattern
The Bullish Abandoned Baby candlestick pattern is a reversal pattern. The pattern has three candles. It forms at the bottom of a trend. In this pattern, the first candle is any long and bearish candle.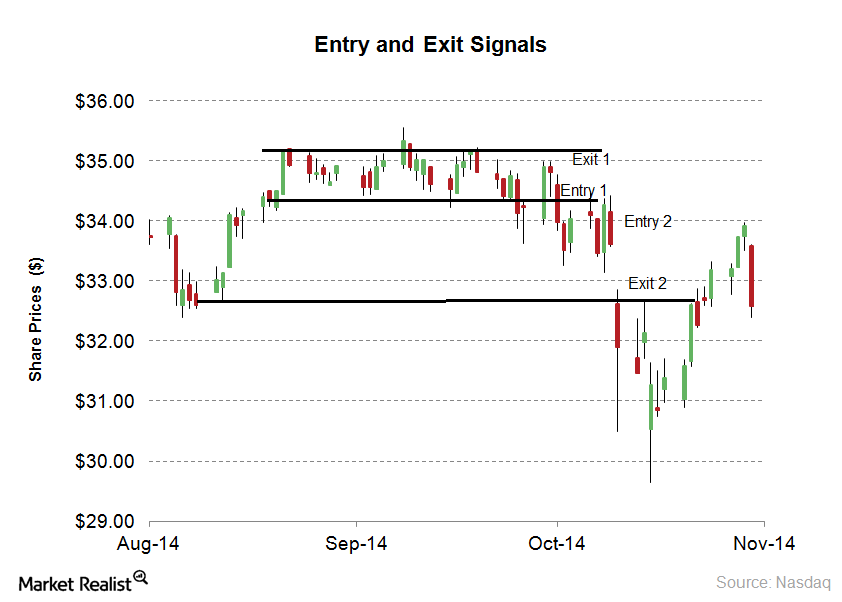
What are the disadvantages of technical analysis?
Technical analysis is used to forecast stocks. All of the technical indicators give possible entry and exit points. The forecasting accuracy isn’t 100%. This is one of disadvantages of technical analysis.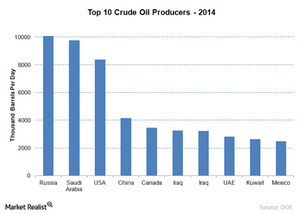
Why is OPEC important to the price of crude oil?
High market share gives OPEC bargaining power to price oil above a competitive market. It can sway crude oil prices by increasing or decreasing production.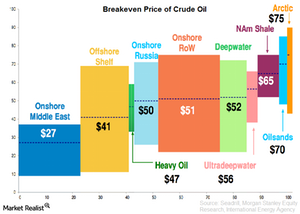
Why is the breakeven price of crude oil so important?
Knowing the breakeven price of crude oil is important when trying to figure out what OPEC needs in order to regain market share.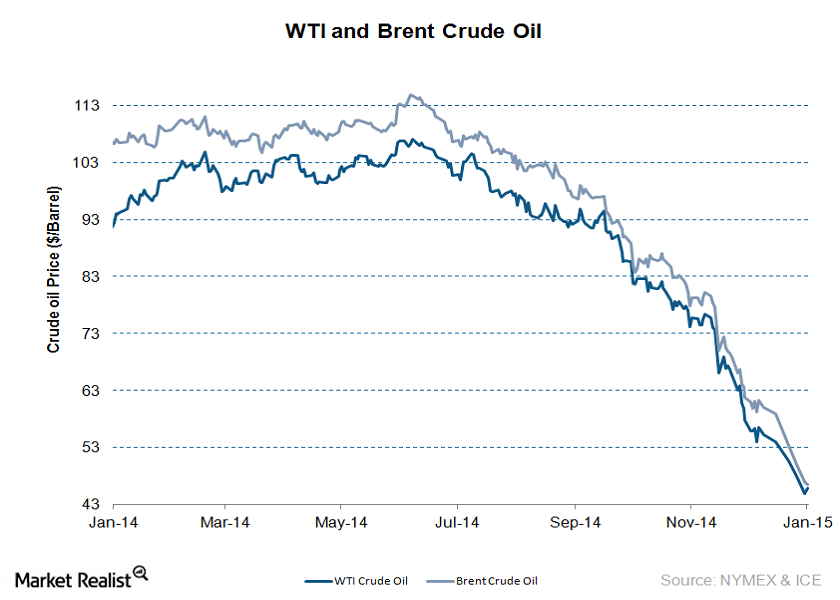
The crude oil market: An overview
Crude oil prices have been on a roller coaster ride in 2014. This series will help crude oil investors recognize key factors that are impacting oil prices.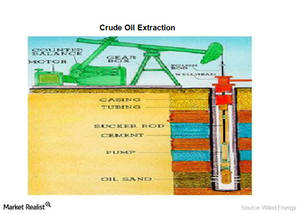
Why it’s important to know the crude oil extraction process
Before learning the costs components of crude oil extraction, let’s take a look at how producers extract crude oil from the ground.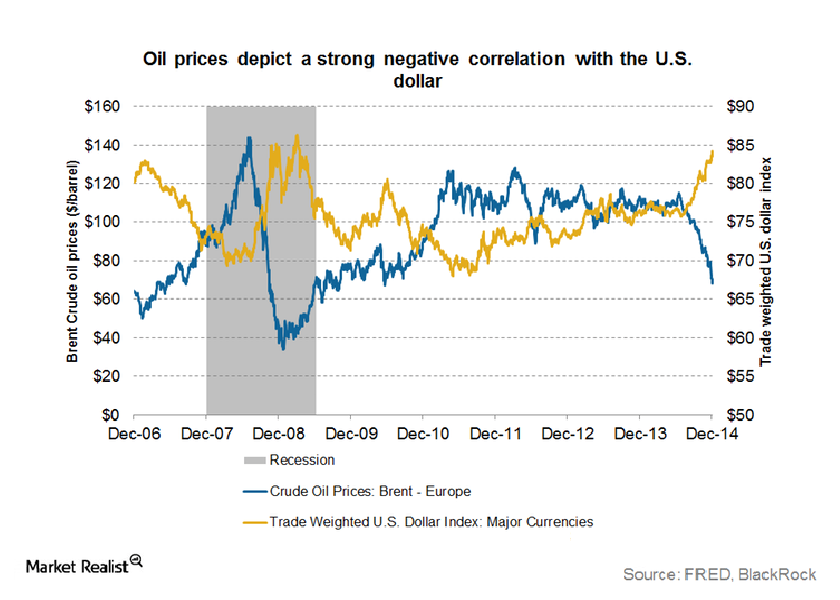
How the strengthening US dollar is impacting crude oil prices
The US dollar plays a major role in the price movements of commodities such as gold and crude oil. A strengthening US dollar is often seen as negative.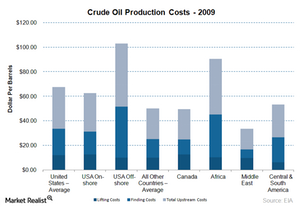
How does the production cost of crude oil affect oil prices?
Recent consensus says the production cost of crude oil could range from $20 to $25 per barrel.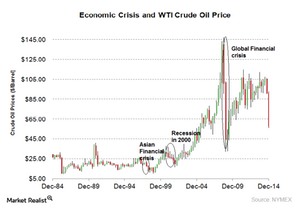
How an economic crisis affects the price of crude oil
The common factor during an economic crisis is that economic growth slows down. Demand declines, which has a negative impact on oil prices.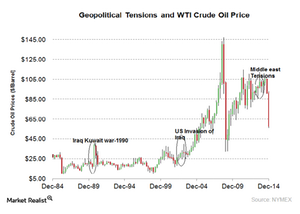
Must know: Geopolitical tensions impact oil prices
A glut in crude oil supply could mean that political tensions in the near term may not impact oil prices.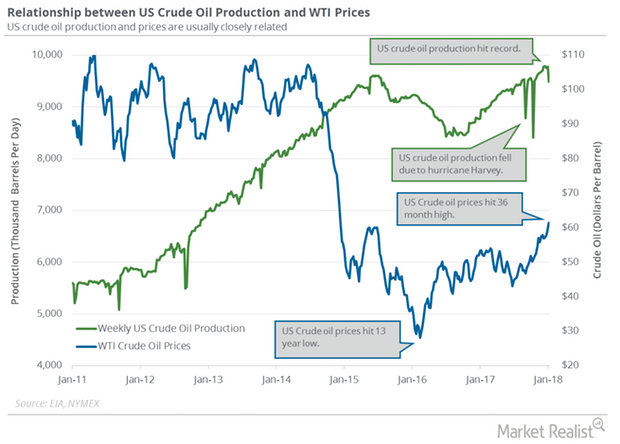
Will US Oil Production Pressure Crude Oil Futures?
February WTI crude oil futures contracts fell 0.9% to $63.73 per barrel on January 16. Brent oil futures fell 1.6% to $69.15 per barrel on the same day.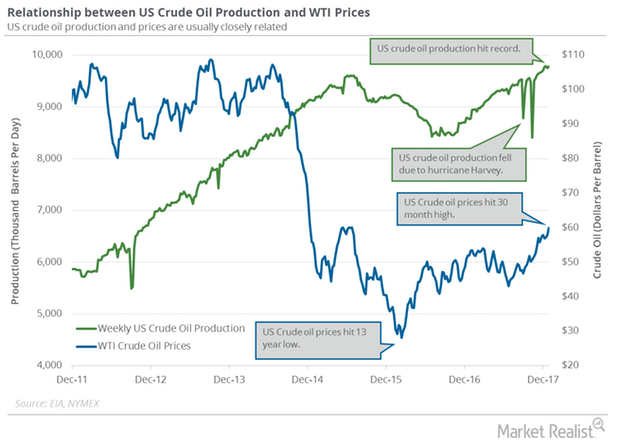
Will US Crude Oil Production Undermine Crude Oil Futures?
According to the EIA, US crude oil production increased by 28,000 bpd (barrels per day) to 9,782,000 bpd on December 22–29, 2017.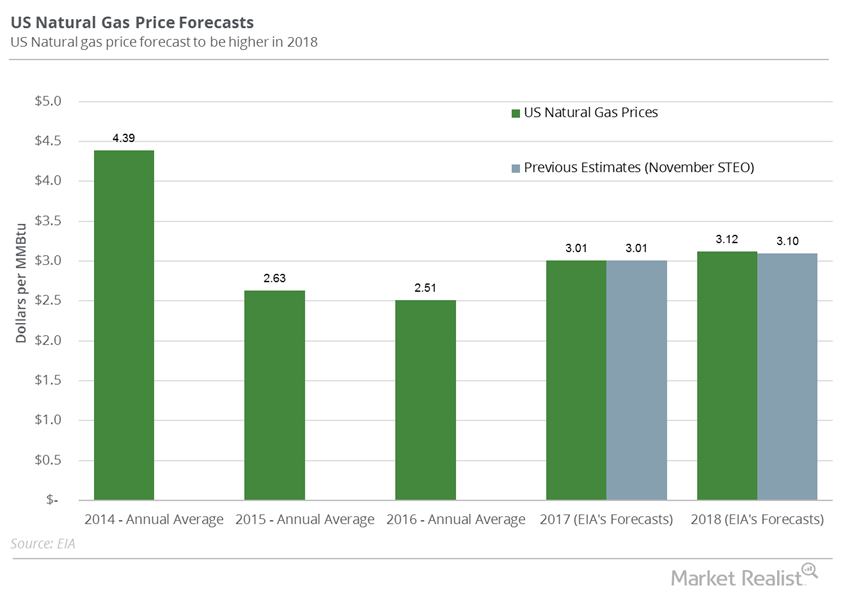
US Natural Gas Futures Could Continue to Fall
Hedge funds’ net long positions in US natural gas futures (UGAZ) (UNG) and options contracts were at 5,318 for the week ending January 2, 2018.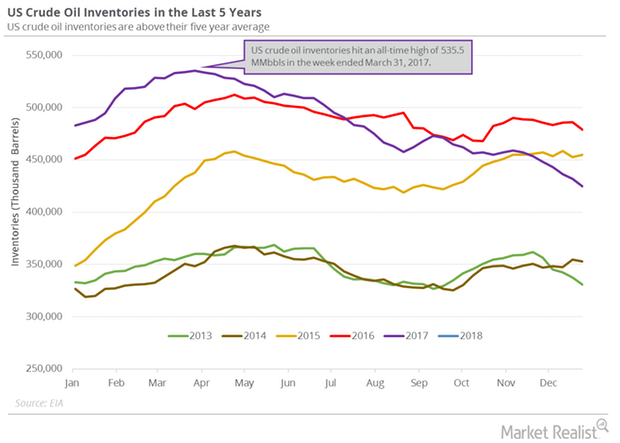
US Crude Oil Production Fell and Boosted Oil Futures
US crude oil production fell by 290,000 bpd (barrels per day) or 3% to 9,492,000 bpd between December 29, 2017, and January 5, 2018.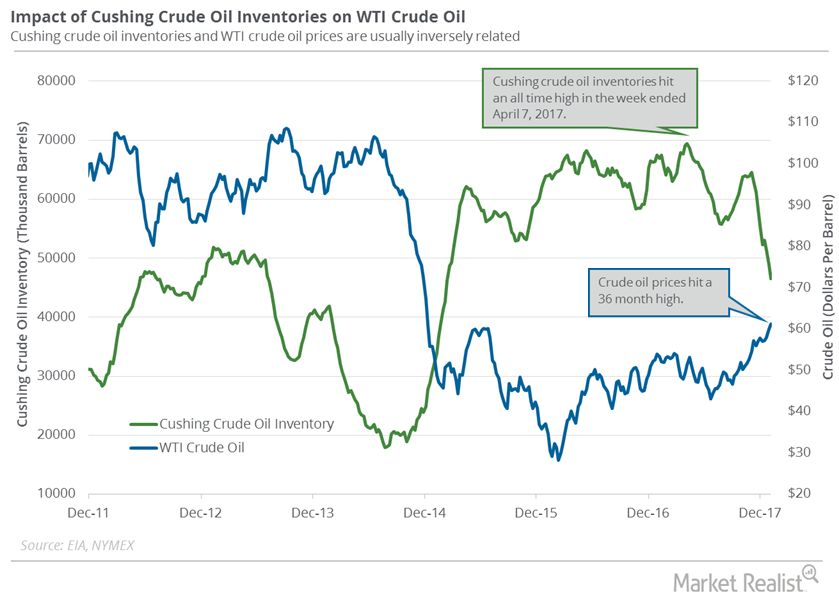
Cushing Inventories Fell 33% from the Peak
Analysts expect that Cushing crude oil inventories could have declined on January 5–12, 2018. A fall in Cushing inventories is bullish for oil prices.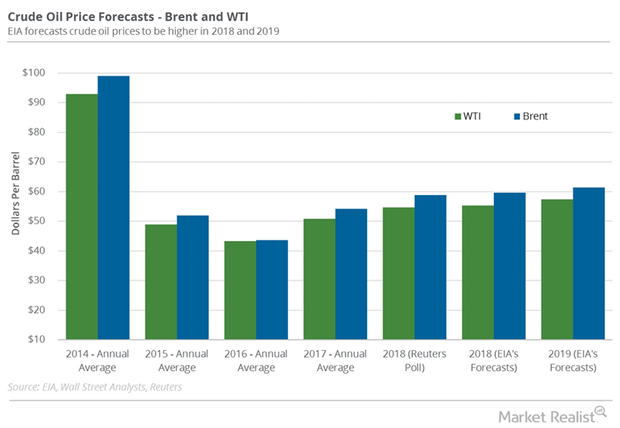
Traders Could Start Booking a Profit in Crude Oil Futures
On January 16, 2018, Goldman Sachs said that crude oil prices could exceed its forecast in the coming months.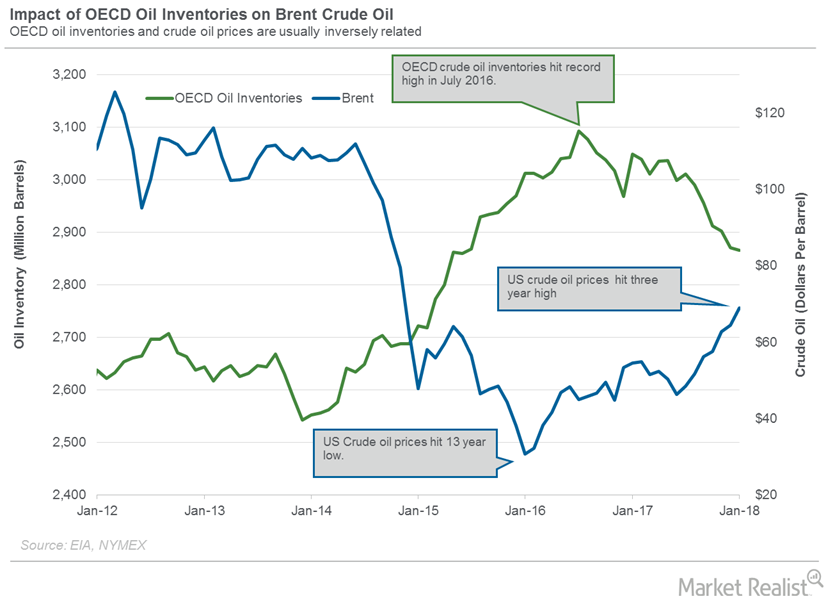
OECD’s Crude Oil Inventories Are near June 2015 Low
According to the EIA, OECD’s crude oil inventories declined 0.2% to 2,865 MMbbls in January 2018—compared to the previous month.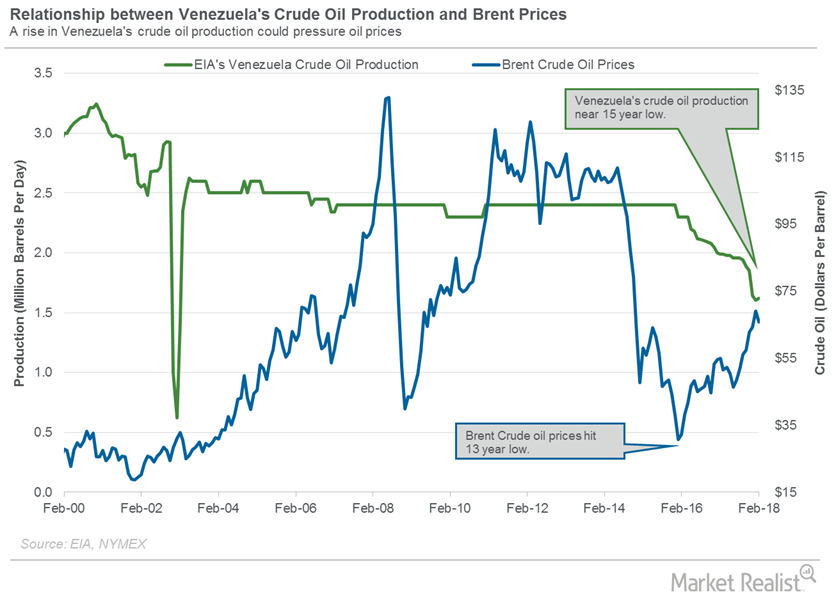
Crude Oil Traders Track Venezuela’s Oil Production
The EIA estimates that Venezuela’s crude oil production increased by 15,000 bpd to 1,620,000 bpd in February 2018—compared to January 2018.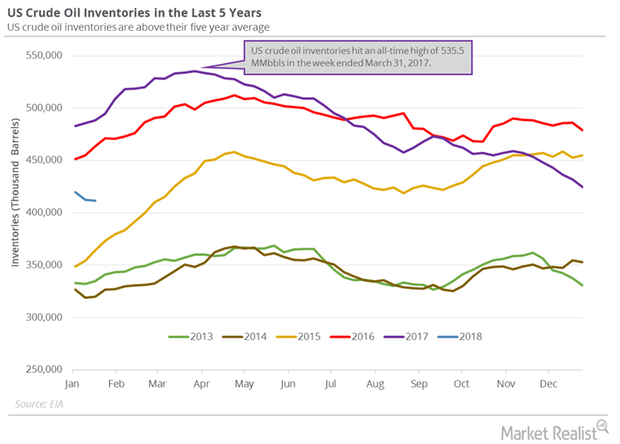
US Crude Oil Inventories Hit February 2015 Low
US crude oil inventories fell by 1.1 MMbbls (million barrels) to 411.6 MMbbls on January 12–19, 2018. Inventories decreased 0.3% week-over-week.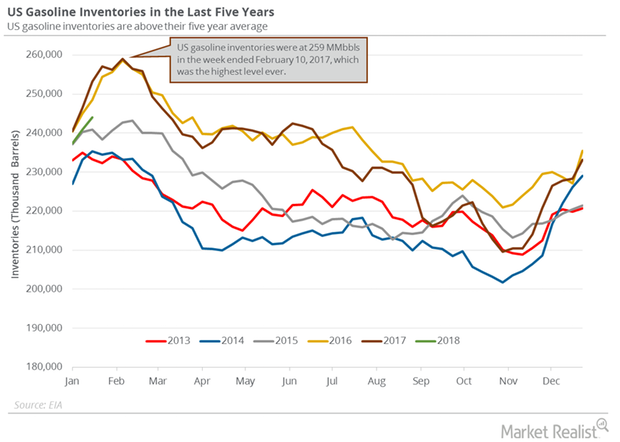
US Gasoline Inventories Could Threaten Crude Oil Prices
According to the EIA, US gasoline inventories increased by 3.1 MMbbls (million barrels) to 244 MMbbls on January 12–19, 2018.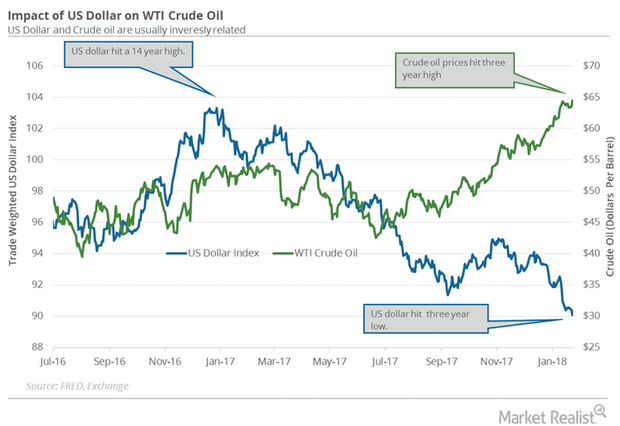
US Dollar Hit a 3-Year Low: Is It Bullish for Crude Oil?
The US Dollar Index (UUP) fell 0.34% to 90.09 on January 23—the lowest level since December 2014. The fall supported crude oil prices on January 23, 2018.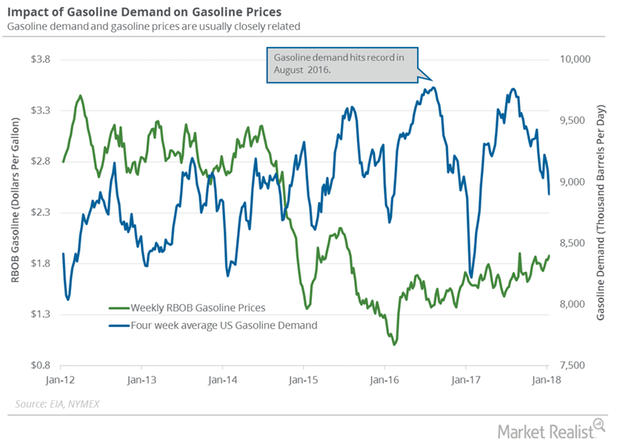
US Gasoline Demand Could Extend the Crude Oil Price Rally
The EIA estimated that four-week average US gasoline demand decreased by 190,000 bpd (barrels per day) to 8,904,000 bpd on January 5–12, 2018.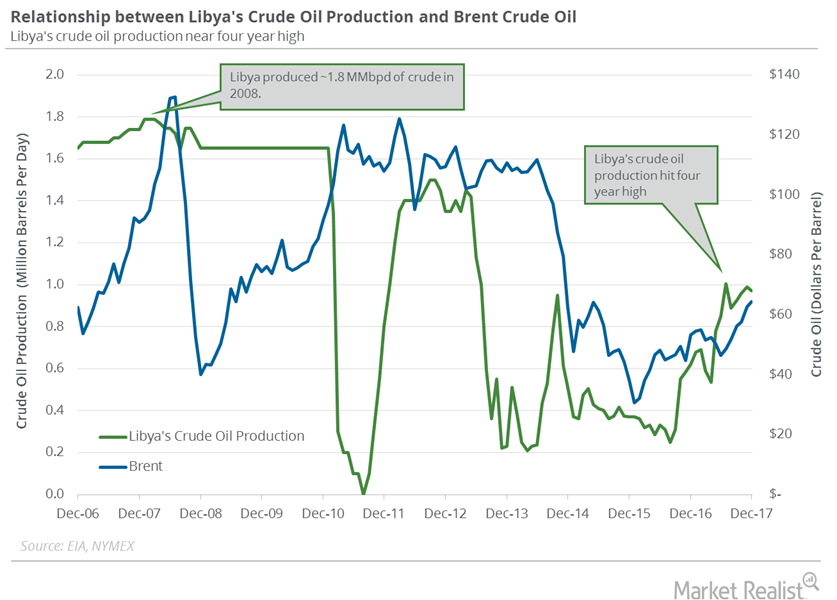
Restarting the Wintershall Oilfields in Libya Could Impact Oil Prices
On January 21, the NOC (National Oil Corporation) of Libya said that it would restart the Wintershall AG’s Sara oilfield. NOC is a state-owned oil company.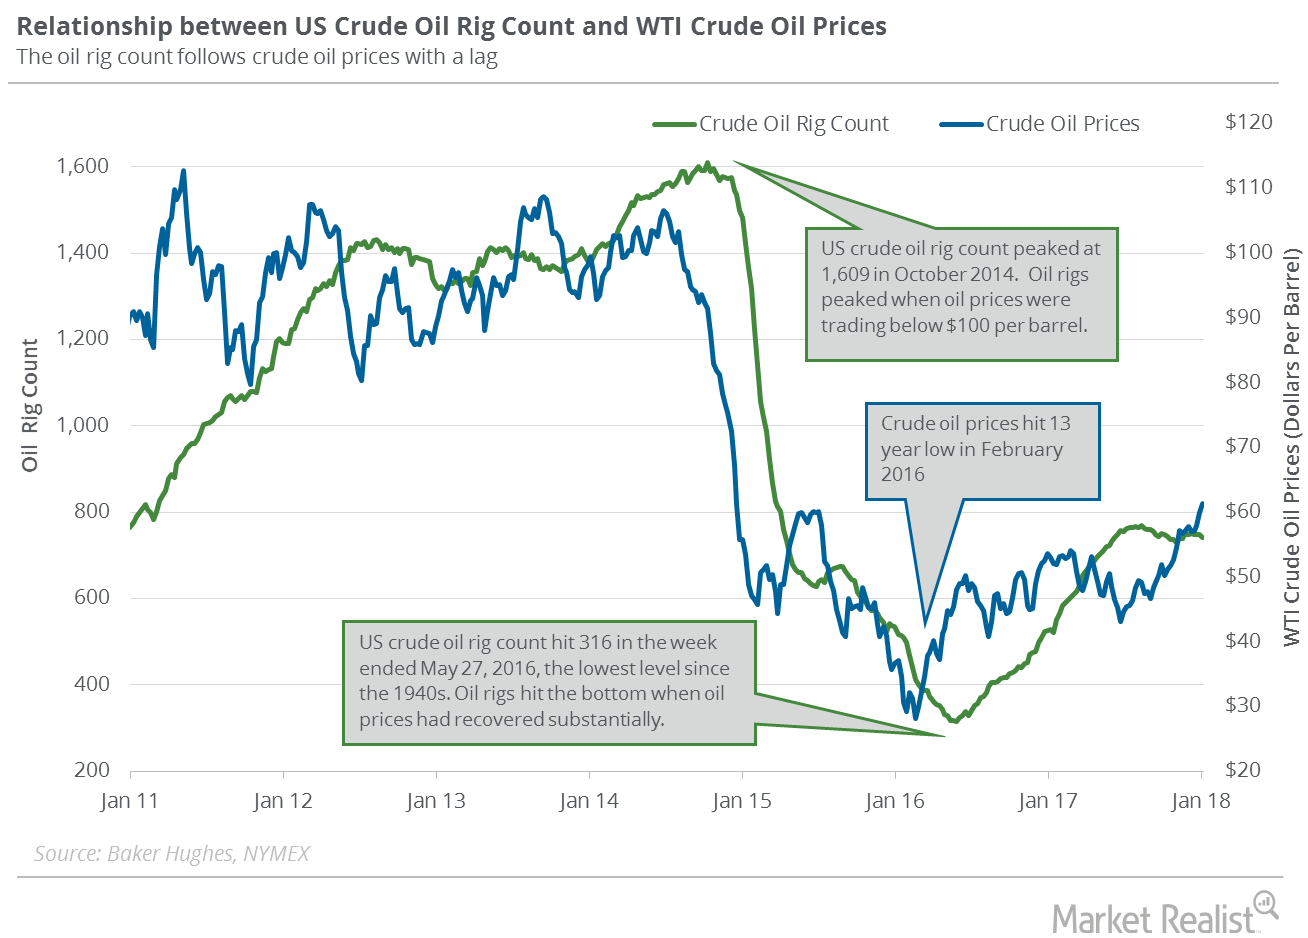
Are US Crude Oil Rigs Indicating a Slowdown in Oil Production?
On January 19, 2018, Baker Hughes released its weekly US crude oil rigs report. US crude oil rigs decreased by five to 747 on January 12–19, 2018.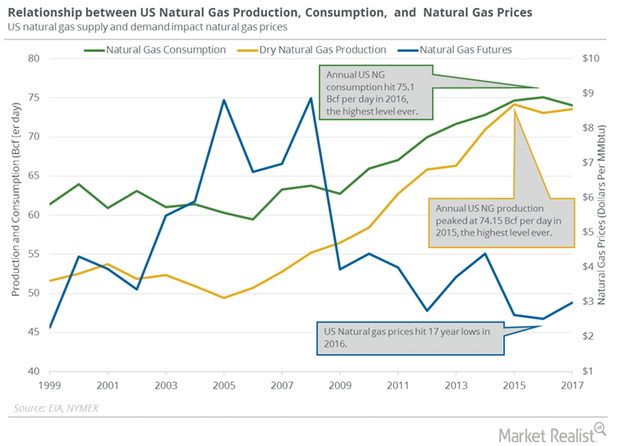
US Natural Gas Production and Consumption Could Impact Prices
According to PointLogic, US dry natural gas production increased by 0.3 Bcf (billion cubic feet) per day to 75.7 Bcf per day on January 11–17, 2018.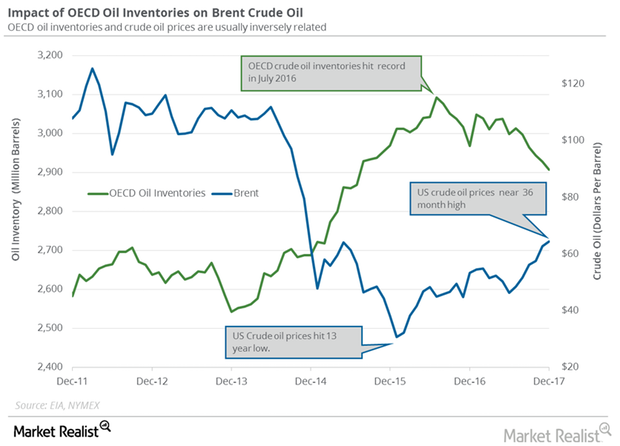
OECD’s Crude Oil Inventories: Trump Card for Crude Oil Bulls?
The EIA estimates that global crude oil inventories could rise in 2018 and 2019, which is bearish for oil prices.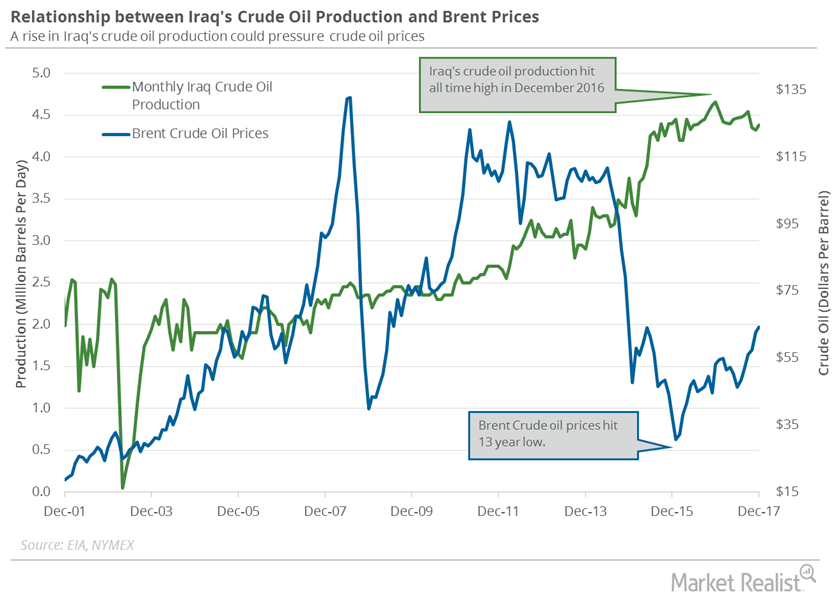
Iraq’s Crude Oil Production Capacity Could Hit 5 MMbpd
The EIA estimated that Iraq’s crude oil production increased by 60,000 bpd to 4,380,000 bpd in December 2017—compared to the previous month.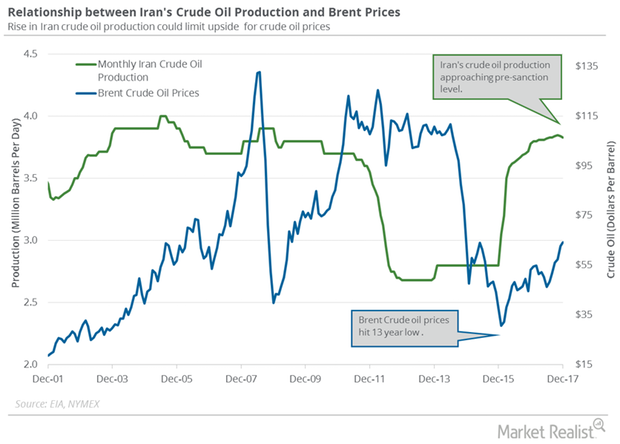
Possible Sanctions against Iran Could Impact Crude Oil Prices
Any increase in Iran’s crude oil production has a negative impact on oil prices. Lower oil (OIL) (DBO) prices are bearish for energy producers (IXC) (FXN).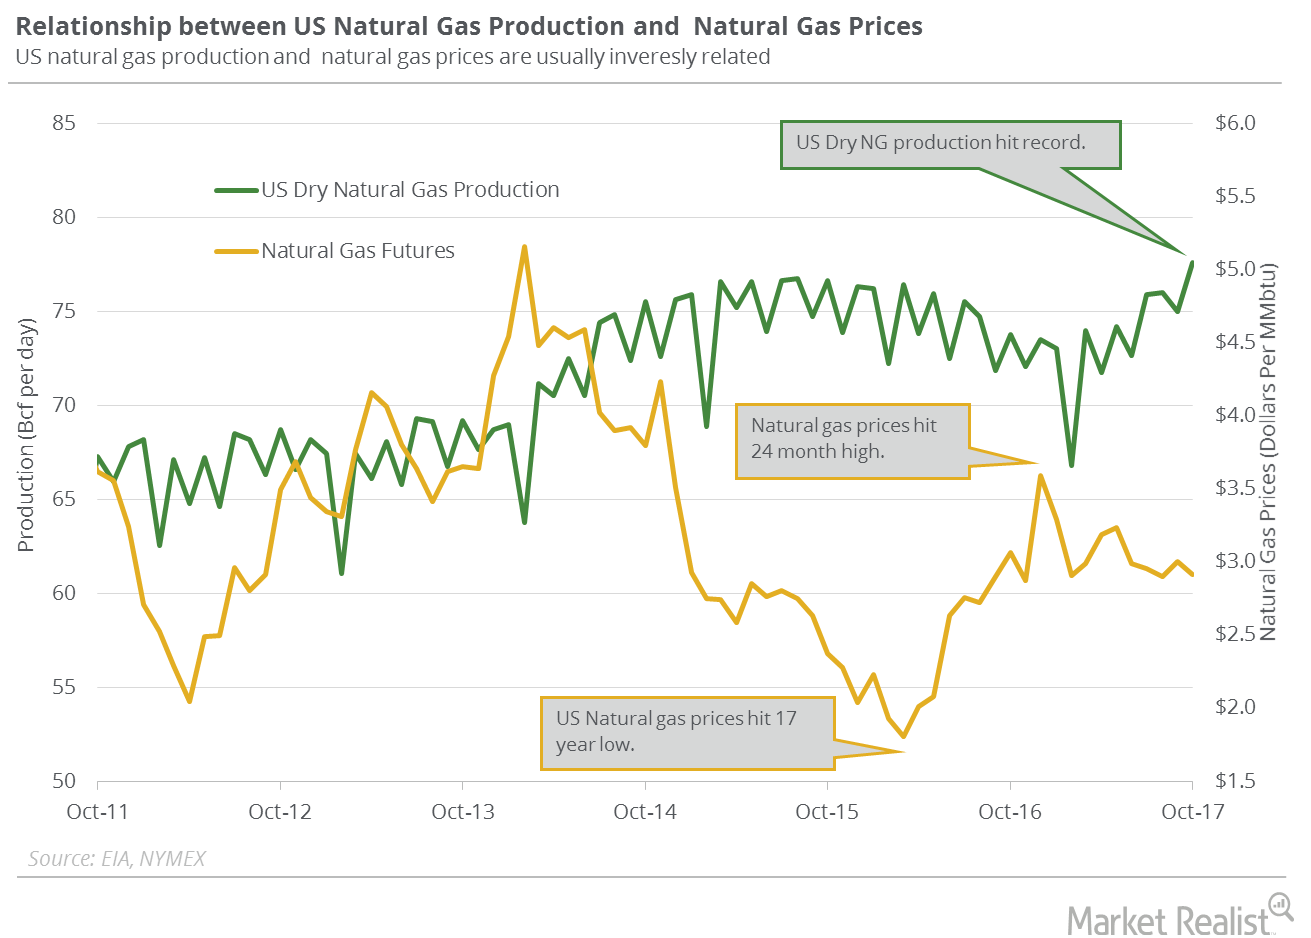
Will US Natural Gas Production Hit a Record in 2018 and 2019?
US dry natural gas production rose by 1.2 Bcf (billion cubic feet) per day or 1.6% to 74 Bcf per day on January 4–10, 2018, according to PointLogic.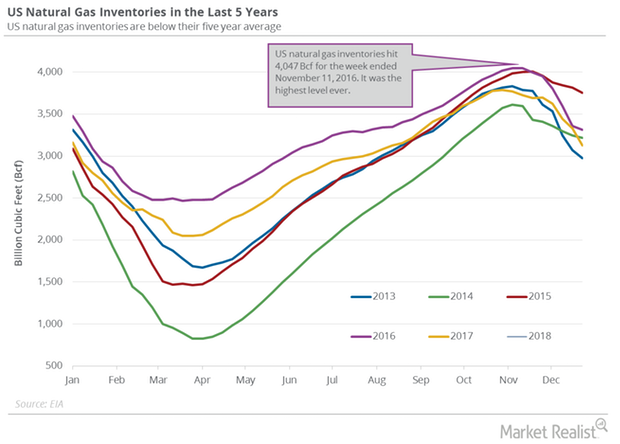
Record Withdrawal in US Natural Gas Inventories
US natural gas inventories fell by 359 Bcf (billion cubic feet) to 2,767 Bcf between December 29, 2017, and January 5, 2018, according to the EIA.
US Natural Gas Consumption Could Hit a Record in 2018 and 2019
US natural gas consumption fell 14.4% to 102.6 Bcf (billion cubic feet) per day on January 4–10, 2018, according to PointLogic.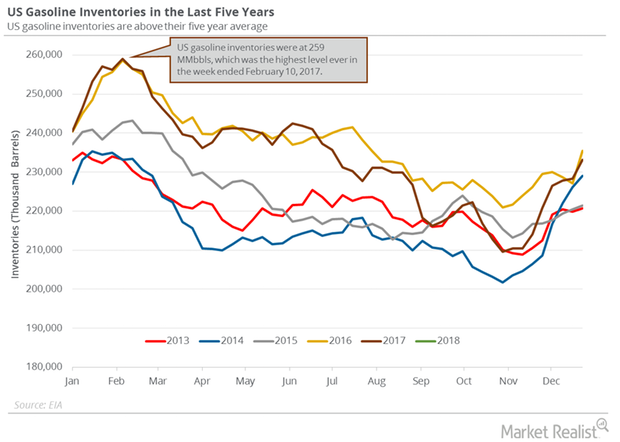
US Gasoline Inventories: More Concerns for Oil in 2018?
US gasoline inventories rose by 4.1 MMbbls (million barrels) to 237.3 MMbbls between December 29, 2017, and January 5, 2018.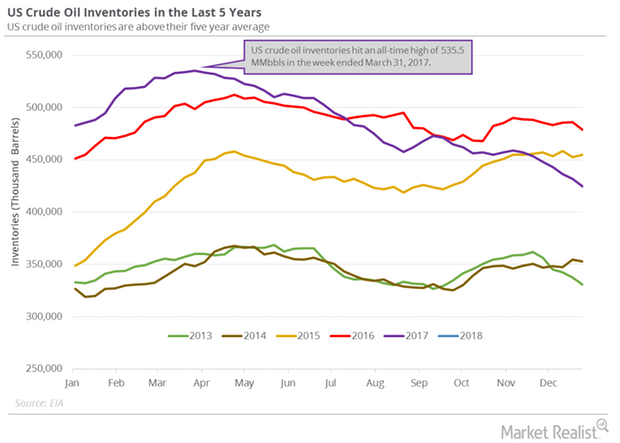
Massive Fall in Crude Oil Inventories Pushed Oil Prices Higher
US crude oil inventories fell by 4.9 MMbbls (million barrels) to 419.5 MMbbls between December 29, 2017, and January 5, 2018.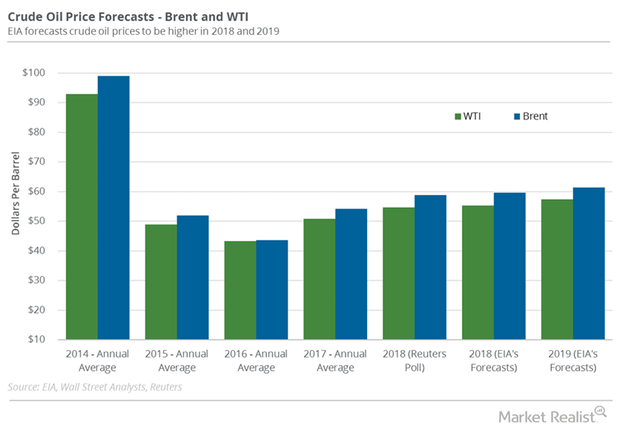
EIA Upgraded Crude Oil Price Forecasts for 2018
The EIA forecast that Brent (BNO) crude oil would average $59.74 per barrel in 2018—4.3% higher than the previous estimates in December 2017.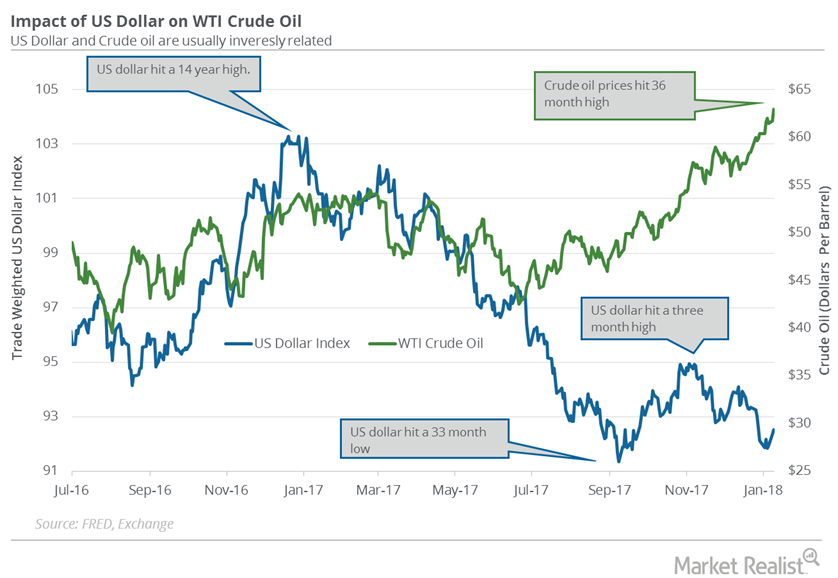
US Dollar Recovering from 3-Month Low: Bearish for Crude Oil?
The US Dollar Index fell ~9.8% in 2017. The dollar fell partly due to the improving economy outside the US. It was the worst annual drop since 2003.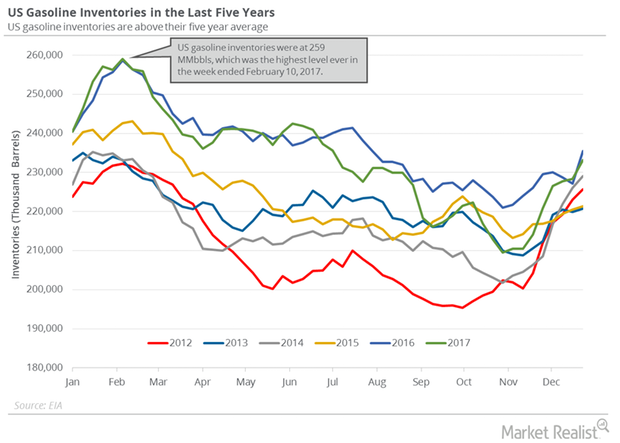
Gasoline and Distillate Inventories Could Impact Crude Oil Prices
February US crude oil (DWT) (SCO) futures contracts rose 0.8% and were trading at $63.46 per barrel at 1:13 AM EST on January 10, 2018.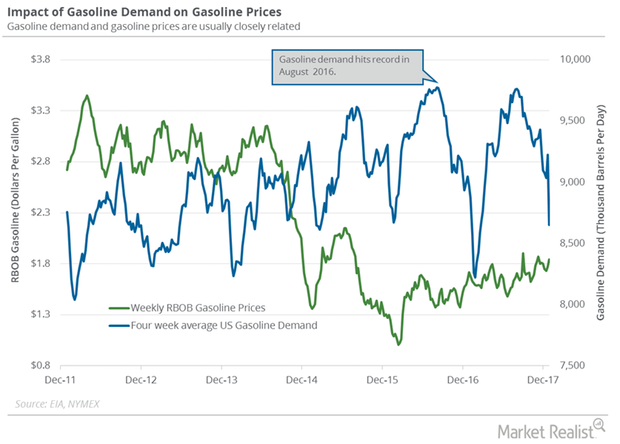
US Gasoline Demand Is Significant for Crude Oil Bulls
According to the EIA, US gasoline demand fell by 835,000 bpd (barrels per day) or 8.8% to 8,650,000 bpd on December 22–29, 2017.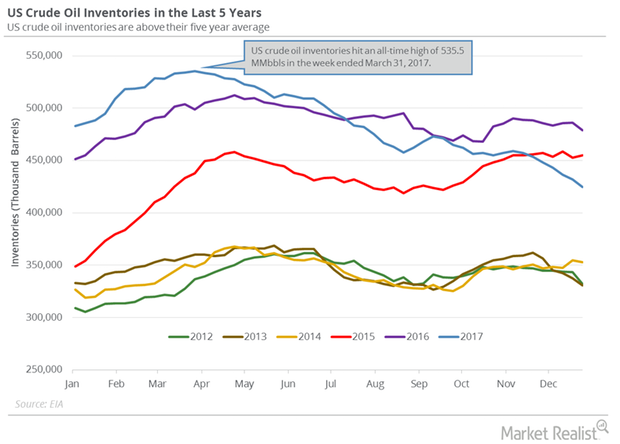
Crude Oil Inventories Fell, Refinery Utilization Hit 12-Year High
US crude oil futures contracts for February delivery fell 0.1% to $61.95 per barrel at 1:05 AM EST on January 5, 2018—the highest level since December 2014.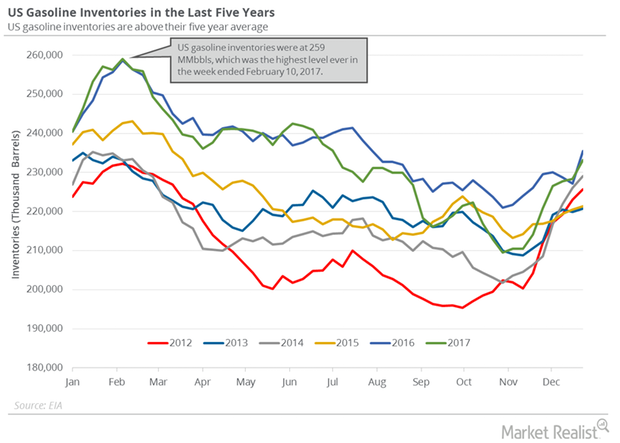
US Gasoline Inventories Could Pressure Crude Oil Prices
The EIA estimated that US gasoline inventories increased by 4.8 MMbbls (million barrels) or 2.1% to 233.1 MMbbls on December 22–29, 2017.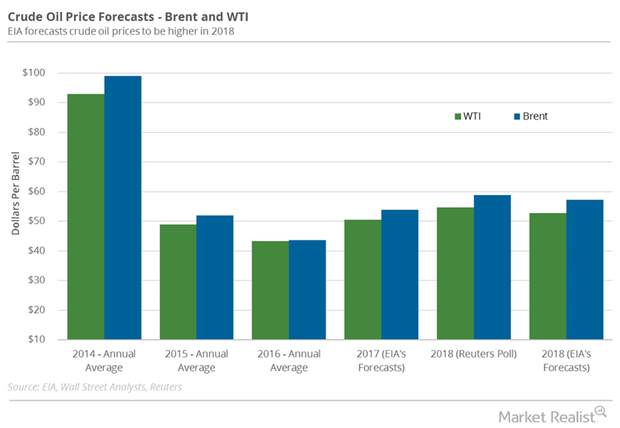
Investment Banks’ Estimates for Crude Oil Prices in 2018
WTI crude oil (USL) prices are at their 30-month high. The US benchmark also opened above $60 per barrel in January for the first time since 2014.
