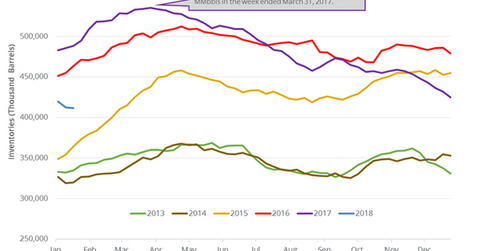
US Crude Oil Inventories Hit February 2015 Low
US crude oil inventories fell by 1.1 MMbbls (million barrels) to 411.6 MMbbls on January 12–19, 2018. Inventories decreased 0.3% week-over-week.
Jan. 25 2018, Updated 9:35 a.m. ET

Crude oil futures  
March US crude oil futures (UCO) (DWT) contracts rose 1% to $66.25 per barrel at 1:10 AM EST on January 25, 2018—the highest level since December 2014. March E-mini S&P 500 (SPY) futures contracts fell 0.06% to 2,839.25 at 1:10 AM EST on January 25, 2018.
US crude oil inventories 
The EIA released the weekly crude oil inventory report on January 24, 2018. US crude oil inventories fell by 1.1 MMbbls (million barrels) to 411.6 MMbbls on January 12–19, 2018. Inventories decreased 0.3% week-over-week and by 76.7 MMbbls or 15.7% YoY (year-over-year).
Inventories declined for the tenth straight week—the longest weekly decline since 1982. The decline supported oil (SCO) (DWT) prices on January 24, 2018. Lower inventories benefit energy companies (IXC) (IEZ) like Ultra Petroleum (UPL), Bill Barrett (BBG), and Halliburton (HAL).
Refinery demand, imports, and exports 
US crude oil refinery demand fell by 392,000 bpd (barrels per day) to 16,483,000 bpd on January 12–19, 2018. Refinery demand decreased 2.3% week-over-week but increased by 436,000 bpd or 2.7% YoY.
US crude oil imports increased 1.1% to 8,041,000 bpd on January 12–19, 2018. The imports also increased by 231,000 bpd or 2.9% YoY.
US crude oil exports rose 13% to 1,411,000 bpd on January 12–19, 2018. The exports also increased by 812,000 bpd or 136% YoY. Changes in supply and demand impact inventories.
Impact 
US crude oil inventories declined ~12% in 2017, while oil prices increased 12.4% during the same period. Inventories declined ~23.1% from their peak. They also fell by 45.5 MMbbls or ~10% in the last ten weeks. If the momentum continues, it could have a positive impact on oil (USL) prices.
However, US oil inventories are 4.4% above their five-year average, which is bearish for oil (USO) prices. If the difference drops, it’s a bullish sign for oil prices.
Next, we’ll discuss US crude oil production.
