iShares Global Energy
Latest iShares Global Energy News and Updates
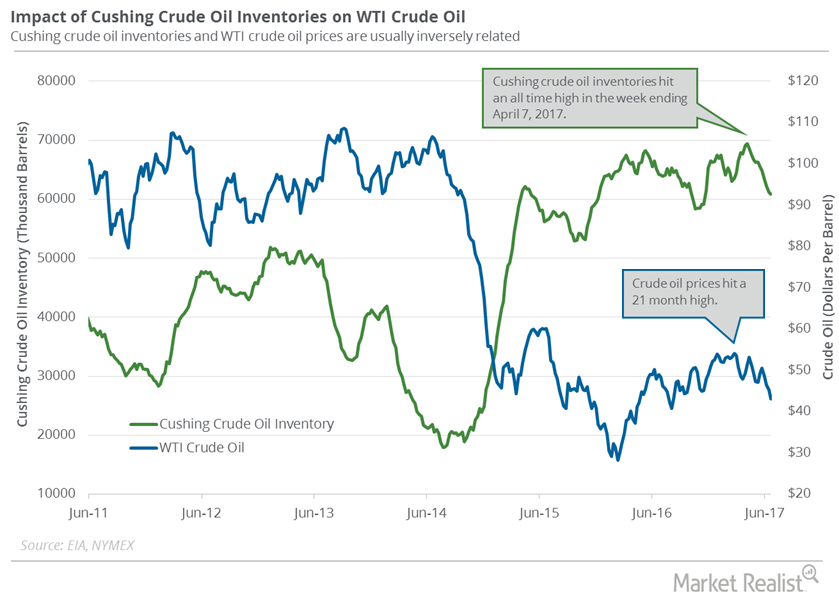
Cushing Inventories Have Fallen 10% in the Last 10 Weeks
Cushing crude oil inventories have fallen 10% in the last ten weeks. A better-than-expected fall in Cushing inventories could support US crude oil prices.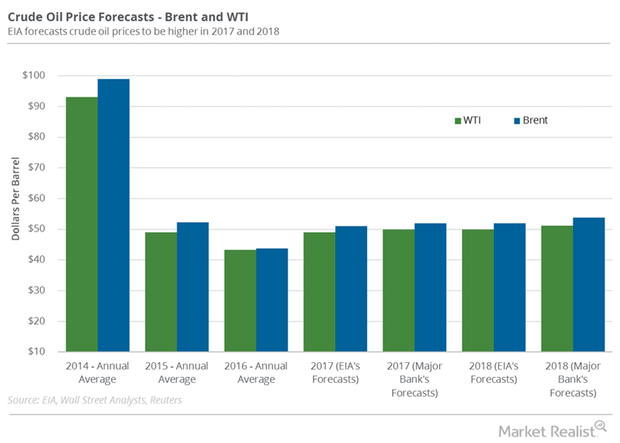
Crude Oil: Price Forecasts and Hedge Funds’ Position
Hedge funds increased their net long positions in US crude oil futures and options by 43,861 contracts or 18.4% to 282,362 contracts on July 25–August 1.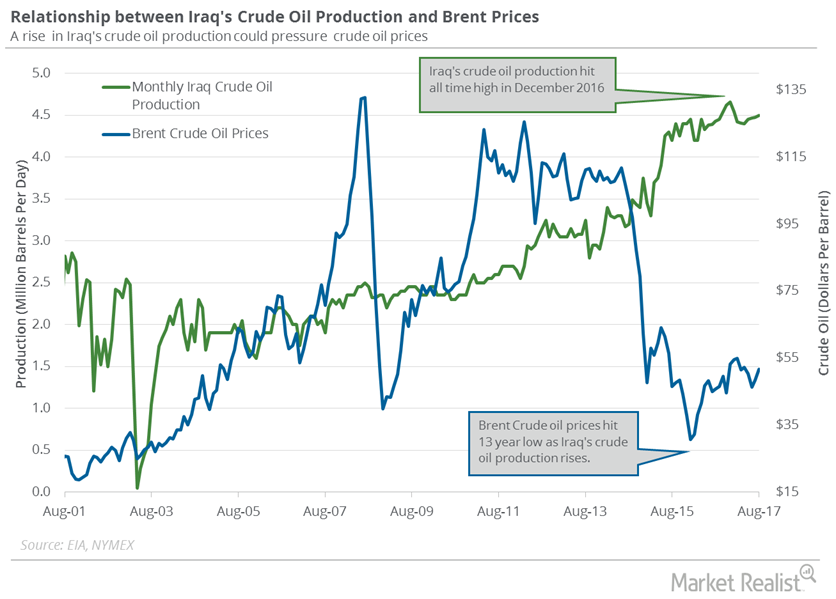
Kurdistan Referendum: Time to Buy Crude Oil Futures?
On September 25, 2017, the people in Kurdistan voted in a referendum for independence. As a result, Turkey blocked 500,000 bpd of crude oil exports.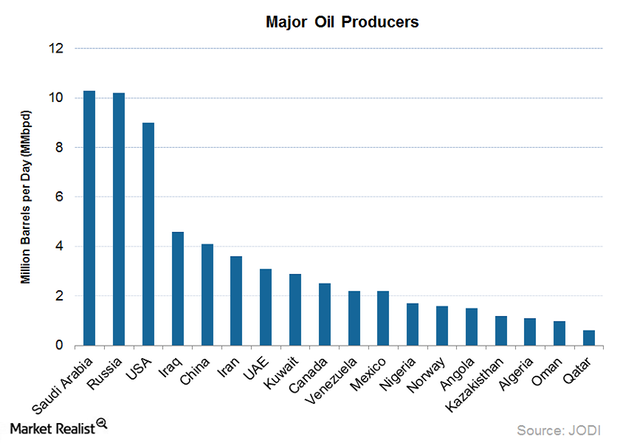
How OPEC and Non-OPEC Producers Affect Crude Oil Prices
Crude oil (BNO) (PXI) (USL) (USO) (UCO) prices were up ~4% between December 7, 2016, and December 19, 2016.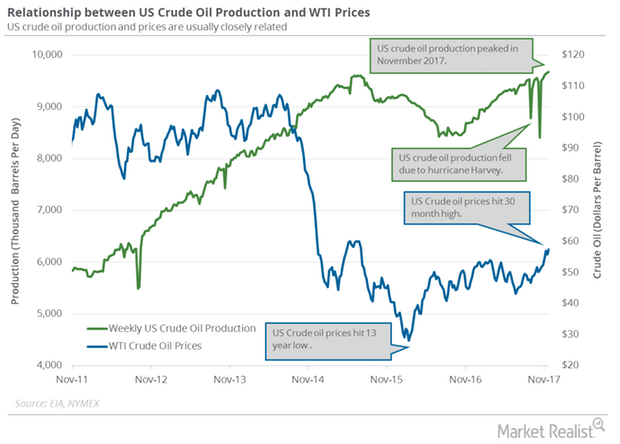
Traders Track US Crude Oil Production and Exports
US crude oil production rose by 290,000 bpd (barrels per day) or 3.1% to 9,481,000 bpd in September 2017—compared to the previous month.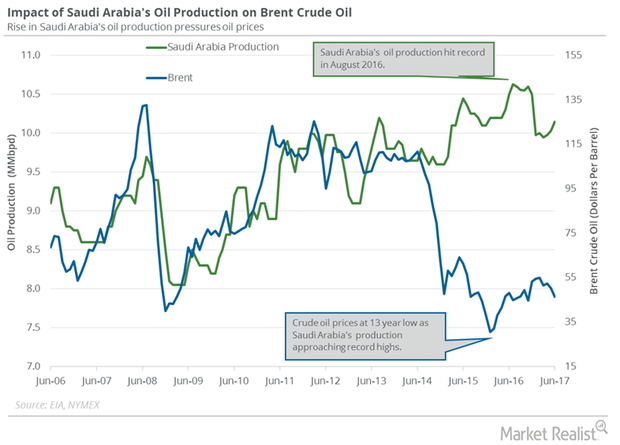
Will Saudi Arabia’s Crude Oil Export Plans Rescue Oil Prices?
Saudi Arabia is the largest crude oil producer and exporter among the OPEC (Organization of the Petroleum Exporting Countries) member countries.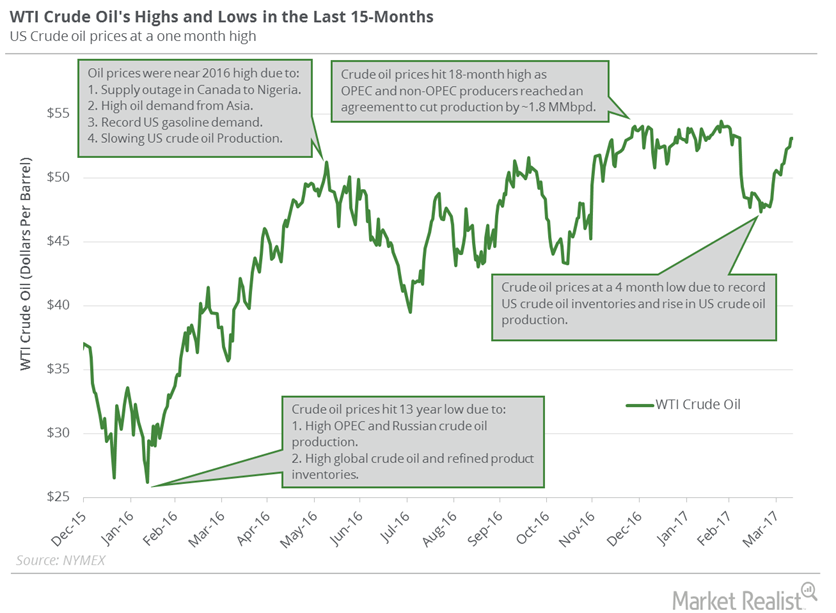
Will Crude Oil Prices Hit a New High?
US WTI crude oil prices were at $54.45 per barrel on February 23—the highest level since June 2015. As of April 10, prices were 2.5% below their high.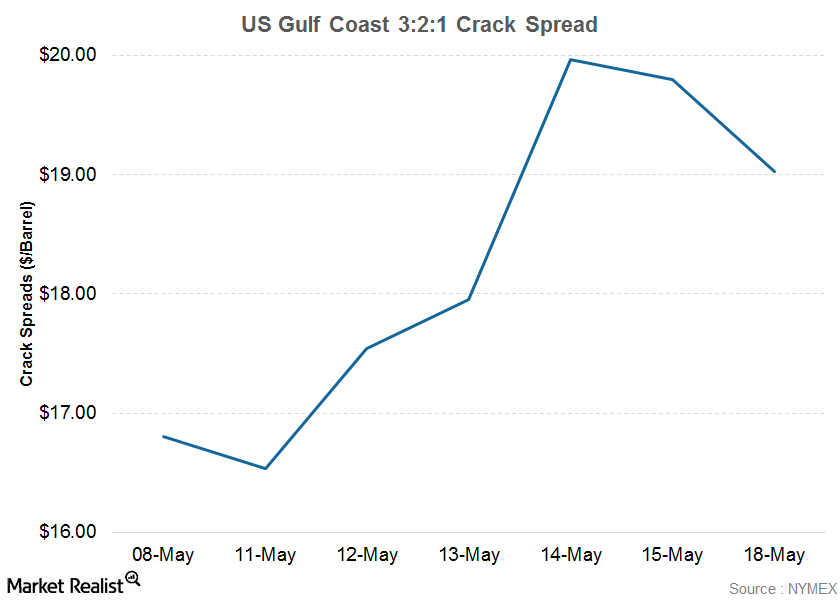
What a Wider Crack Spread in Mid-May Means for American Refiners
A crack spread represents the price difference between refiners’ revenues—achieved through the sale of finished refined products—and refiner costs—that is, the price of crude oil.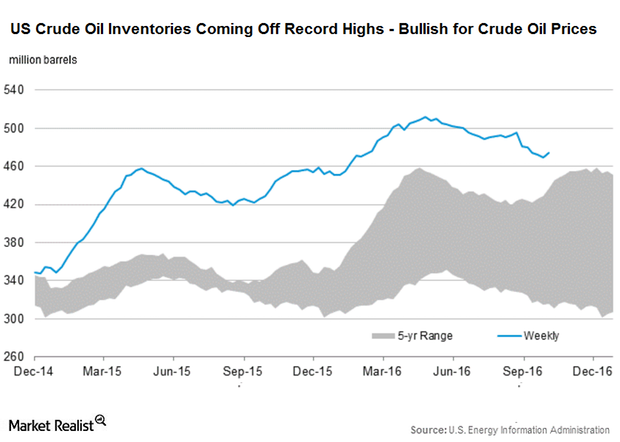
US Crude Oil Prices Are Trading Near a 2016 High!
November WTI (West Texas Intermediate) crude oil futures contracts rose 0.5% and settled at $50.44 per barrel on October 13.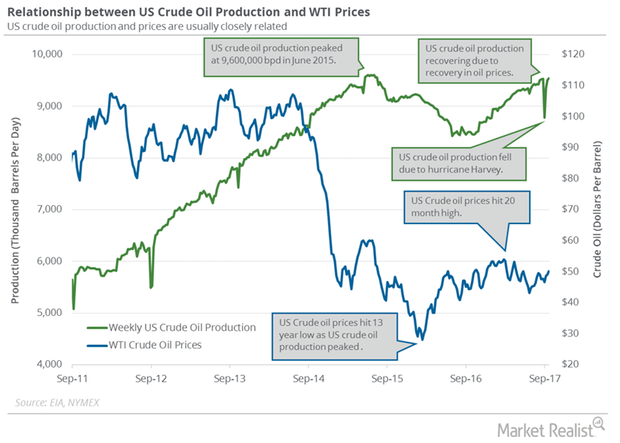
What US Crude Oil Production’s 26-Month High Could Mean
On September 27, 2017, the EIA estimated that US crude oil production rose 37,000 bpd (barrels per day) to ~9.5 MMbpd from September 15–22, 2017.Energy & Utilities Southwestern is among the largest US oil and natural gas producers
Headquartered in Houston, Texas, Southwestern Energy Corporation (SWN) is one of the largest independent natural gas and oil producers in the United States.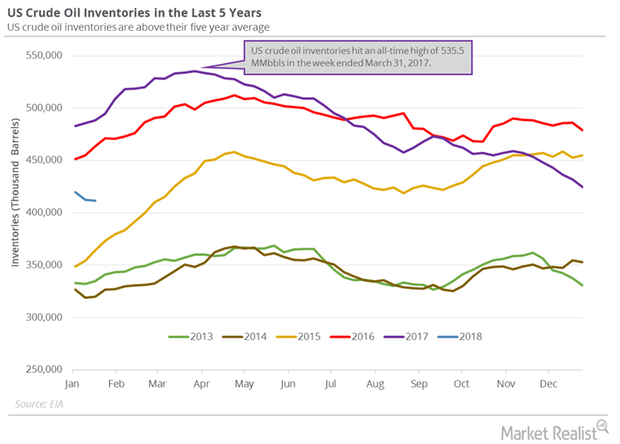
US Crude Oil Inventories Hit February 2015 Low
US crude oil inventories fell by 1.1 MMbbls (million barrels) to 411.6 MMbbls on January 12–19, 2018. Inventories decreased 0.3% week-over-week.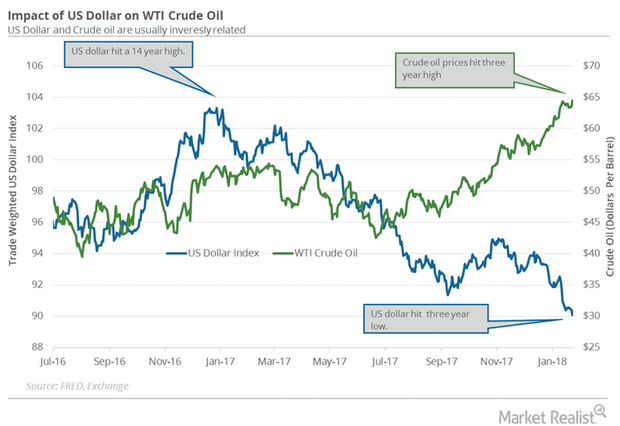
US Dollar Hit a 3-Year Low: Is It Bullish for Crude Oil?
The US Dollar Index (UUP) fell 0.34% to 90.09 on January 23—the lowest level since December 2014. The fall supported crude oil prices on January 23, 2018.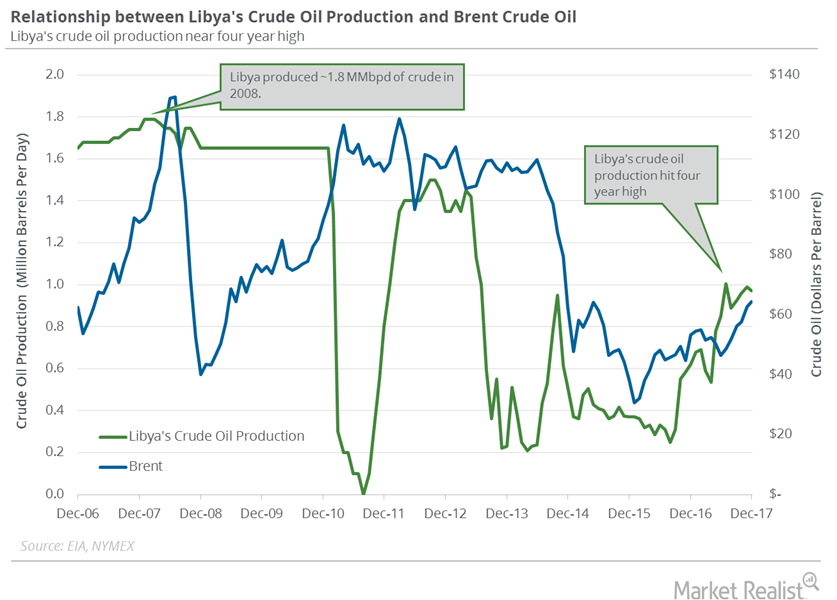
Restarting the Wintershall Oilfields in Libya Could Impact Oil Prices
On January 21, the NOC (National Oil Corporation) of Libya said that it would restart the Wintershall AG’s Sara oilfield. NOC is a state-owned oil company.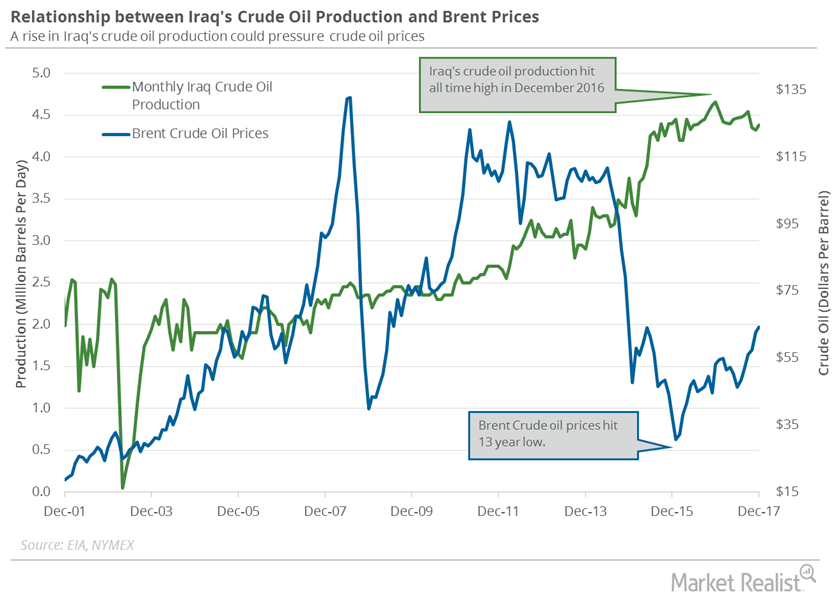
Iraq’s Crude Oil Production Capacity Could Hit 5 MMbpd
The EIA estimated that Iraq’s crude oil production increased by 60,000 bpd to 4,380,000 bpd in December 2017—compared to the previous month.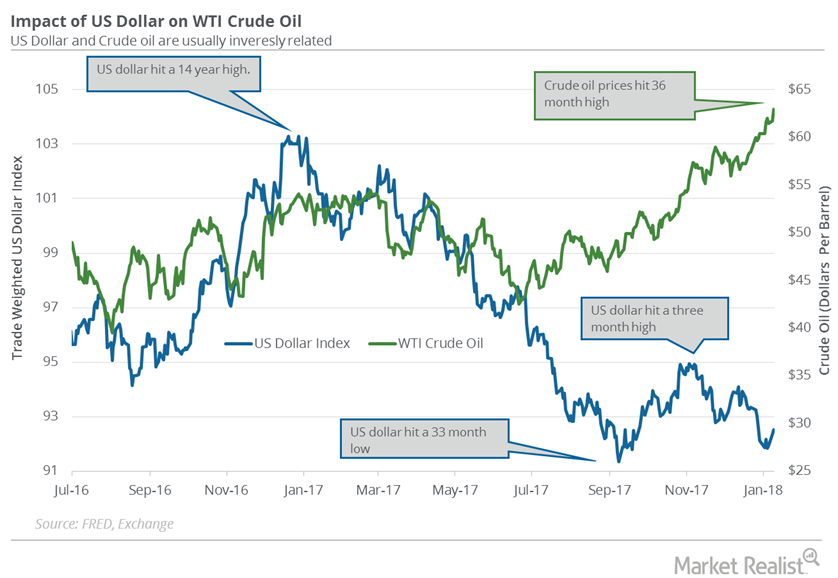
US Dollar Recovering from 3-Month Low: Bearish for Crude Oil?
The US Dollar Index fell ~9.8% in 2017. The dollar fell partly due to the improving economy outside the US. It was the worst annual drop since 2003.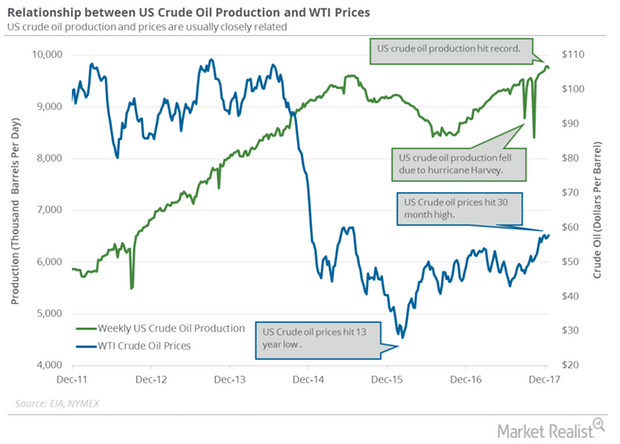
Weekly US Crude Oil Production Fell for the 1st Time since October
US crude oil production declined by 35,000 bpd (barrels per day) or 0.4% to 9,754,000 bpd from December 15 to 22, 2017, per the EIA.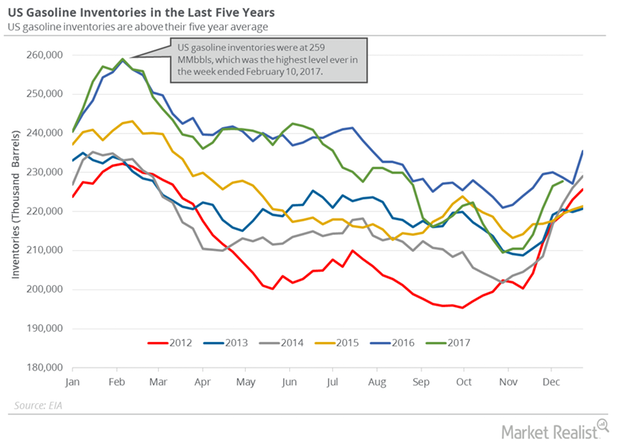
US Gasoline Inventories: Bearish Driver for Crude Oil Futures
The EIA estimated that US gasoline inventories rose by 1.2 MMbbls (million barrels) to 227.7 MMbbls on December 8–15, 2017.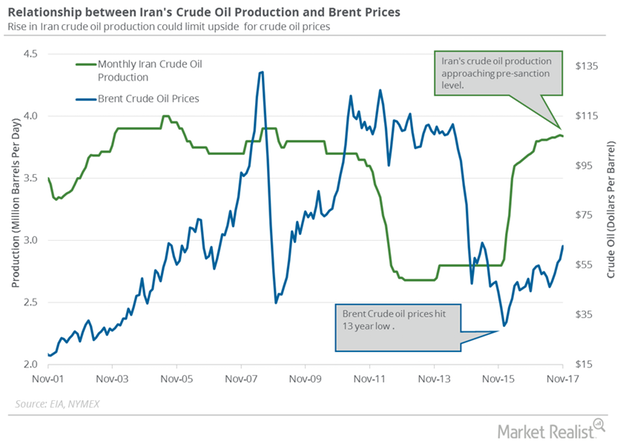
Iran’s Crude Oil Production Is near a 9-Year High
The EIA estimates that Iran’s crude oil production fell by 10,000 bpd or 0.3% to 3,840,000 bpd in November 2017—compared to the previous month.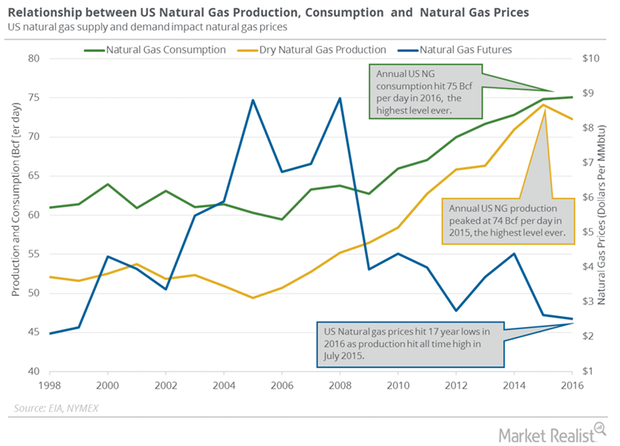
EIA Upgrades US Natural Gas Production for 2018
US dry natural gas production was flat at 76.1 Bcf (billion cubic feet) per day on December 7–13, 2017, according to PointLogic.
US Gasoline Inventories: Turning Point for Crude Oil Futures?
US gasoline inventories rose by 5.6 MMbbls (million barrels) or 2.6% to 226.5 MMbbls on December 1–8, 2017.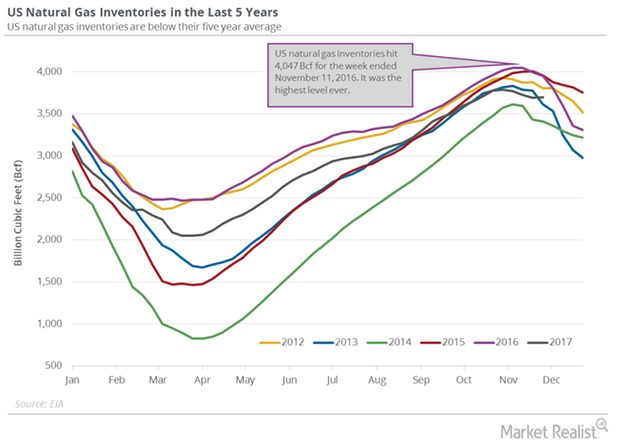
Unexpected Rise in US Natural Gas Inventories
The EIA estimated that US natural gas inventories rose by 2 Bcf (billion cubic feet) to 3,695 Bcf on November 24–December 1, 2017.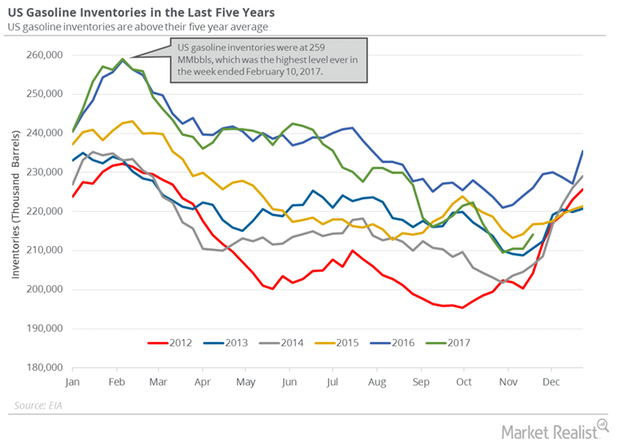
US Gasoline Inventories Weighed on Crude Oil Futures
US gasoline inventories rose by 3,627,000 barrels to 214 MMbbls (million barrels) on November 17–24, 2017, according to the EIA.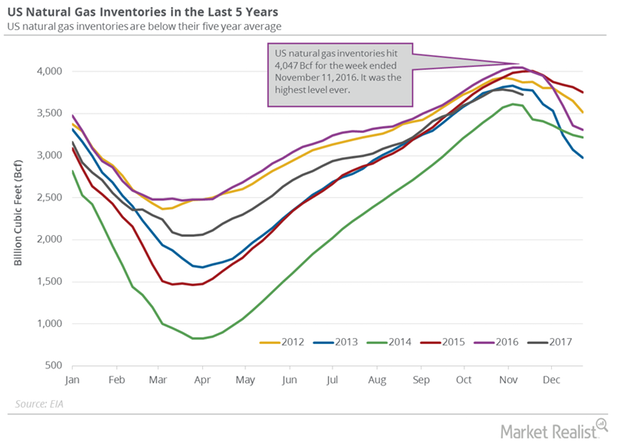
US Natural Gas Inventories Have Fallen 8% from Last Year
The EIA estimated that US natural gas inventories fell by 46 Bcf (billion cubic feet) or 1.2% to 3,726 Bcf on November 10–17, 2017.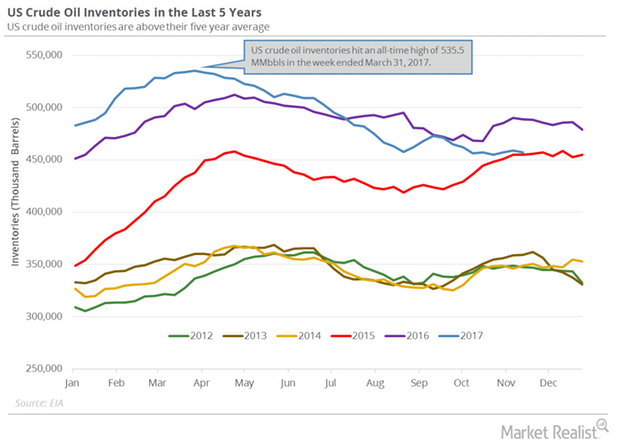
The Relationship between US Crude Oil Inventories and Oil Prices
Estimates for US crude oil inventories The EIA (U.S. Energy Information Administration) released its Weekly Petroleum Status Report on November 22, 2017. It reported that US crude oil inventories fell 1.9 MMbbls (million barrels) to 457.1 MMbbls between November 10 and 17, 2017. Inventories were 31.8 MMbbls (6.5%) lower than in the same period in 2016. The market anticipated […]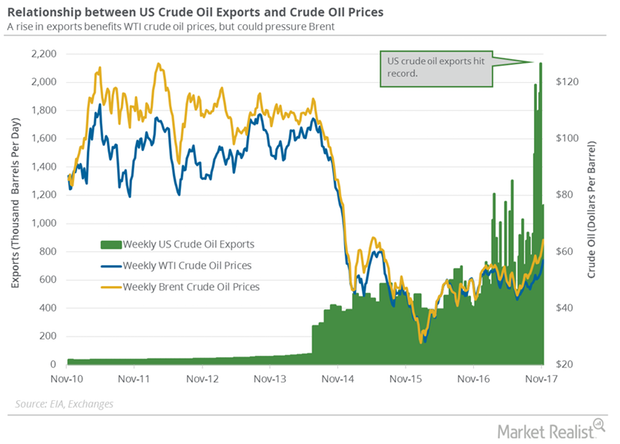
US Crude Oil Exports and Drilling Activity Impact OPEC
According to the EIA, US crude oil exports rose by 260,000 bpd to 1,129,000 bpd on November 3–10, 2017. Exports rose 30% week-over-week.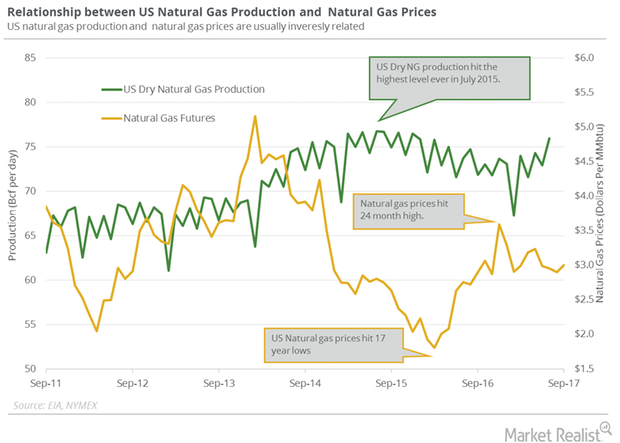
How Is US Natural Gas Production and Consumption Trending?
PointLogic estimates that weekly US dry natural gas production rose by 0.9 Bcf (billion cubic feet) per day to 74.6 Bcf per day between October 19 and October 25, 2017.
Is US Natural Gas Production Bearish for Natural Gas?
US dry natural gas production will likely average ~73.6 Bcf/d in 2017. It will likely rise by 4.9 Bcf/d or 6.6% to 78.5 Bcf/d in 2018.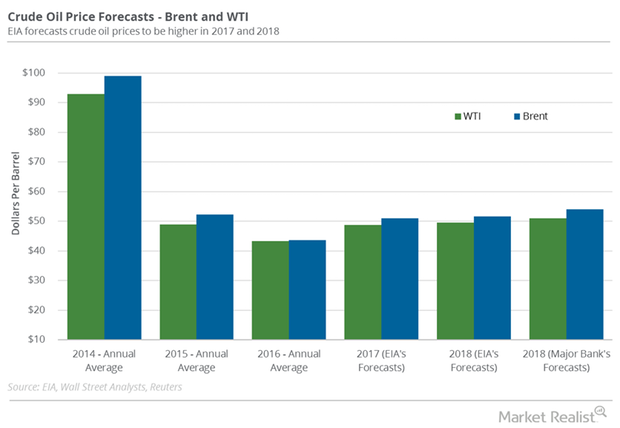
Hedge Funds Are Turning Bearish on US Crude Oil
Hedge funds reduced their net long positions in US crude oil futures and options by 12,094 contracts to 157,891 contracts on September 5–12, 2017.
Will US Crude Oil Futures Break $50 per Barrel?
Let’s track some important events for crude oil and natural gas traders between September 18 and September 22.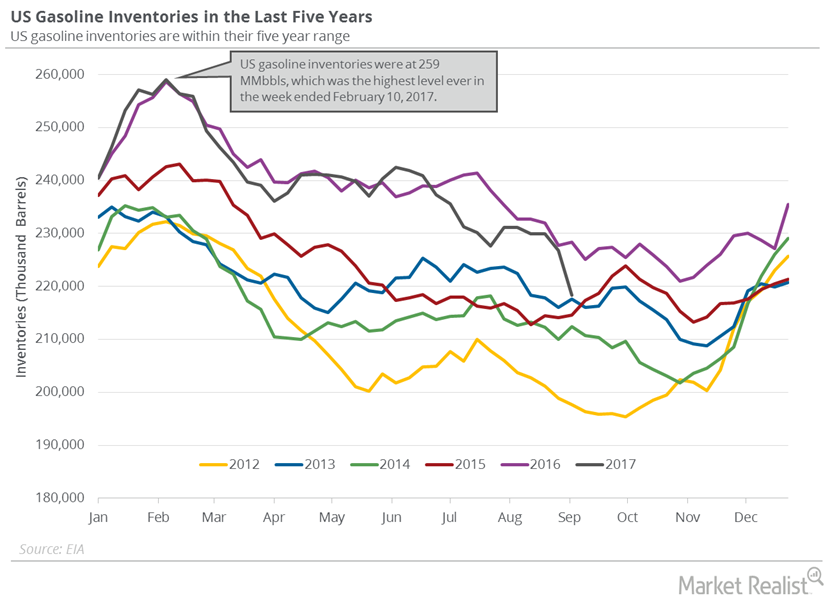
US Gasoline Inventories’ Largest Weekly Drop in 27 Years
The EIA (U.S. Energy Information Administration) released its weekly crude oil inventory report on September 13.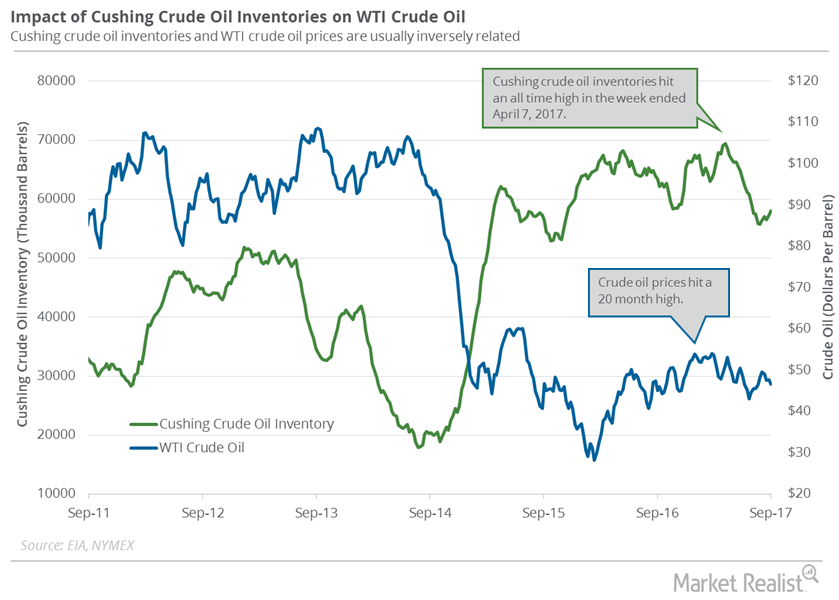
Why Cushing Crude Inventories Rose for the 4th Time in 5 Weeks
A market survey estimates that Cushing crude oil inventories fell from September 1 to 8, 2017. Cushing crude oil inventories rose for the fourth time in the last five weeks.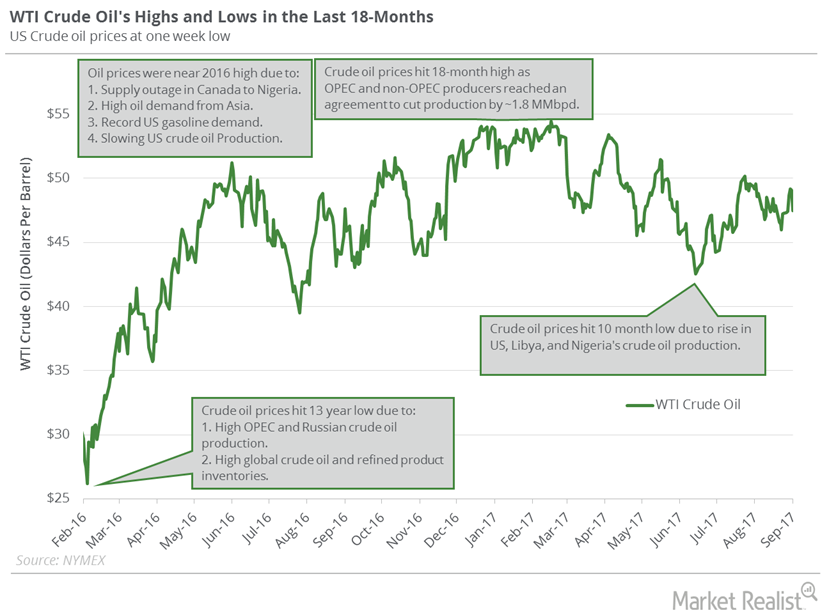
What to Watch: This Week’s Key Crude Oil Price Drivers
Let’s track some important events for crude oil and natural gas traders from September 11 to 15, 2017.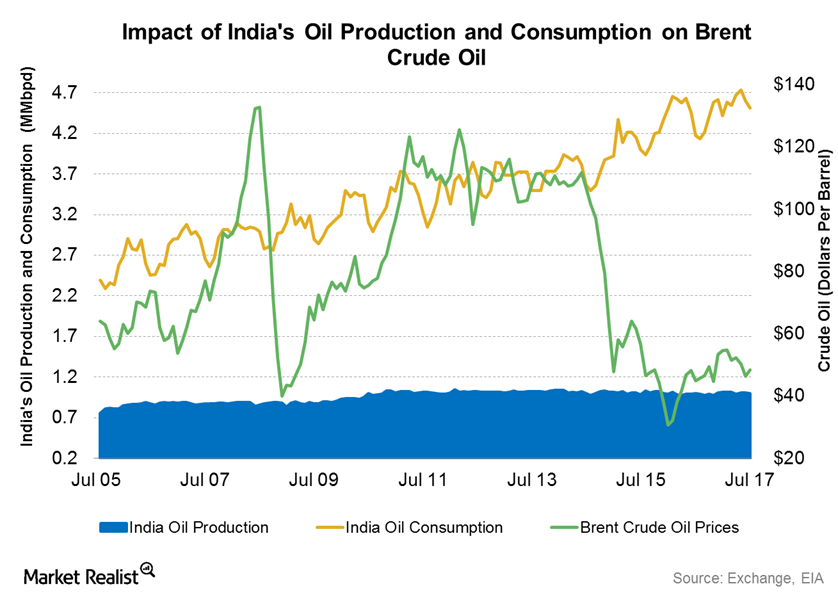
How India’s Crude Oil Imports, Production, Demand Impact Prices
India’s Petroleum Planning and Analysis Cell estimated that the country’s crude oil imports rose 0.60% to 4.2 MMbpd in July 2017 from July 2016.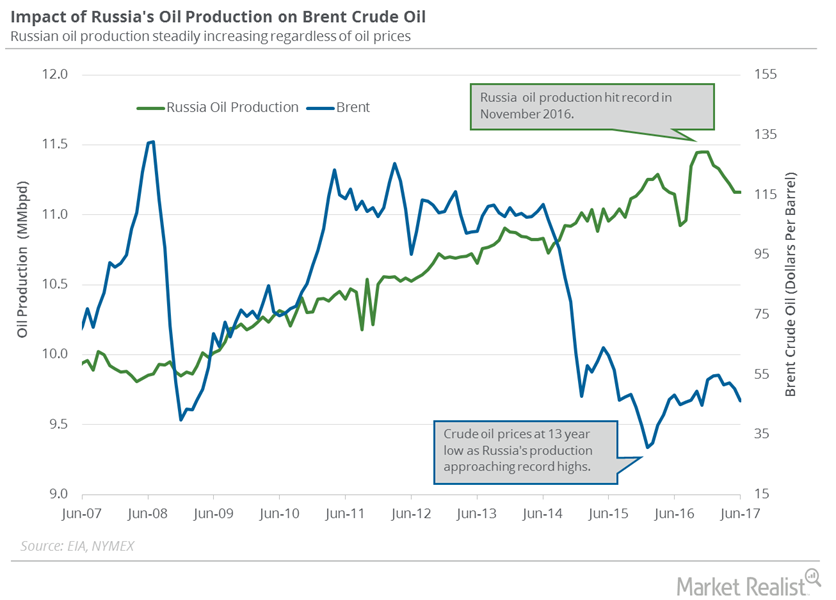
Russia’s Crude Oil Production Was Flat Again
The Russian Energy Ministry estimates that Russia’s crude oil production was flat at 10.95 MMbpd in July 2017—compared to the previous month.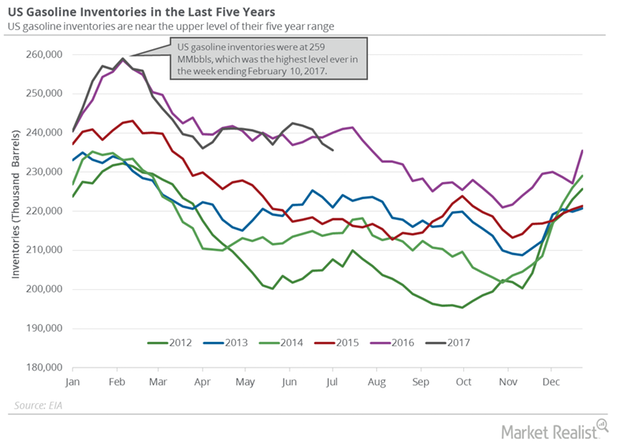
US Gasoline Inventories Support Gasoline, Crude Oil Futures
The EIA reported that US gasoline inventories fell 1.6 MMbbls (million barrels) to 235.6 MMbbls between June 30, 2017, and July 7, 2017.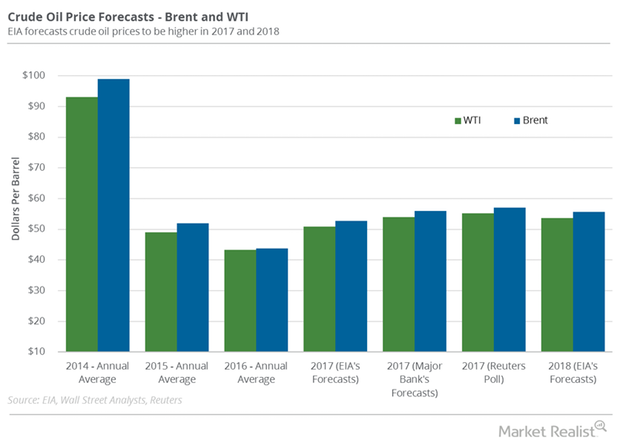
Analyzing Hedge Funds’ Net Long Position on US Crude Oil
Hedge funds increased their net long positions in US crude oil futures and options by 16,345 contracts to 149,951 contracts on June 27–July 4, 2017.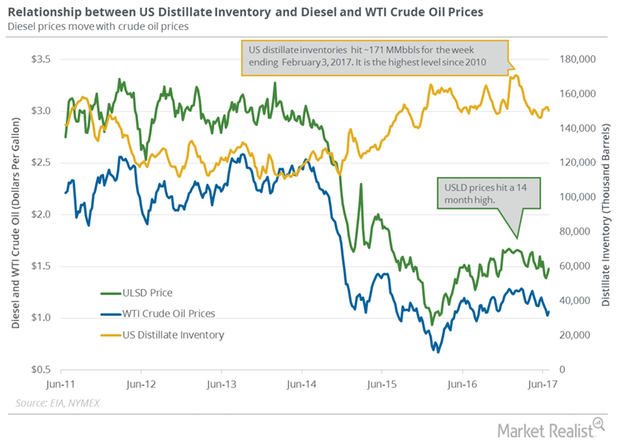
US Distillate Inventories Fell for the Second Straight Week
The EIA reported that US distillate inventories fell by 1.8 MMbbls (million barrels) or 1.2% to 150.4 MMbbls on June 23–30, 2017.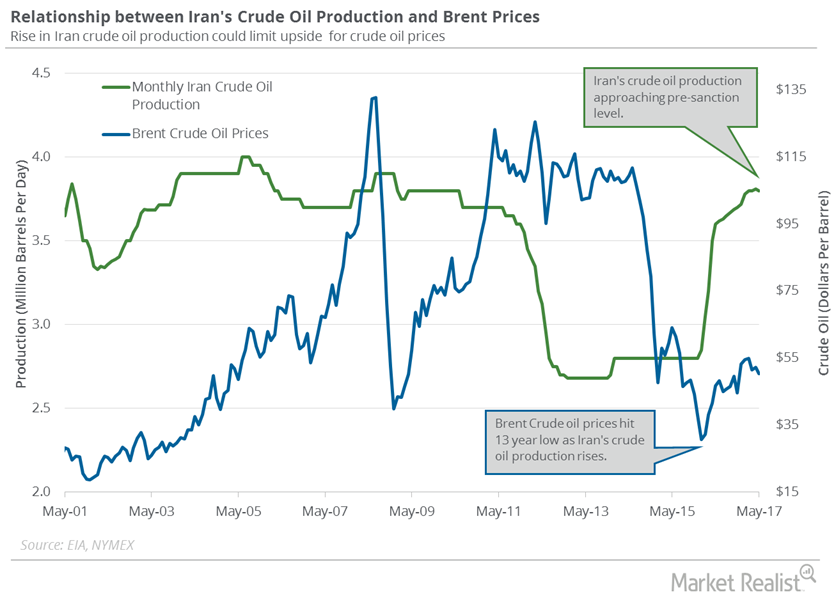
Iran’s Crude Oil Exports and Production: Crucial for Oil Prices
Iran’s crude oil exports are expected to fall 7% in July 2017, according to Reuters. Exports are expected to fall to 1.86 MMbpd in July 2017.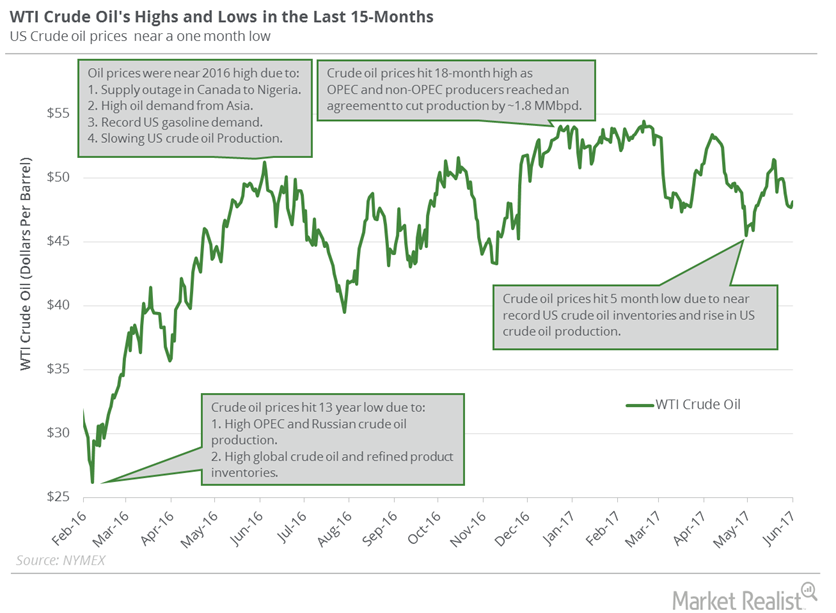
What to Expect from Crude Oil Futures This Week
US crude oil (USO) (IXC) (IYE) (PXI) prices are near their one-month low. Lower crude oil prices have a negative impact on oil producers’ earnings.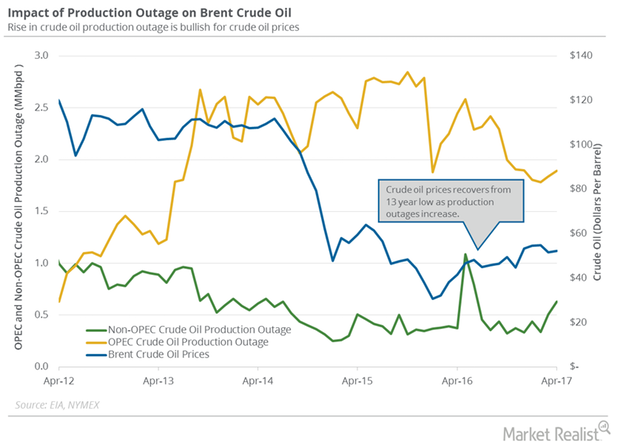
Global Crude Oil Supply Outages Could Help Crude Oil Bulls
The EIA estimated that global crude oil supply outages rose by 181,000 bpd (barrels per day) to 2.52 MMbpd in April 2017—compared to March 2017.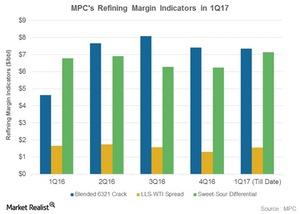
Could Marathon Petroleum’s Refining Earnings Rise in 1Q17?
Marathon Petroleum’s refining earnings are impacted by the blended LLS 6-3-2-1 crack, the sweet-sour differential, and the LLS-WTI spread.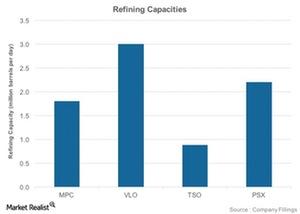
What Key Factors Impact Refining Profitability?
The key factors influencing refining profitability include refining capacity, complexity, and utilization rates.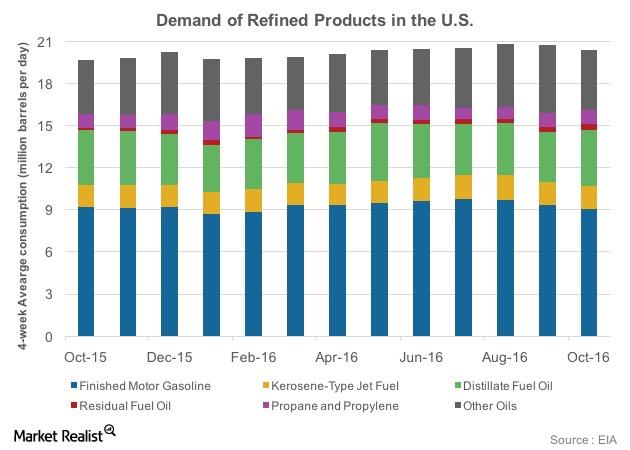
Refined Products in the US: Which Product Is Consumed Most?
Of the total consumption of 20.2 MMbpd, in October 2016, gasoline accounts for around 9.1 MMbpd. Distillate fuel oil accounts for 4.1 MMbpd of the total.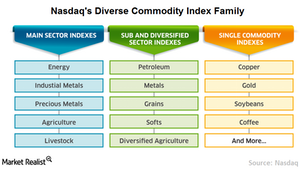
Nasdaq Commodity Index: Reflecting the Global Commodity Market
On the commodities side, we have broad-based commodity benchmark, the Nasdaq Commodity Index, aptly named.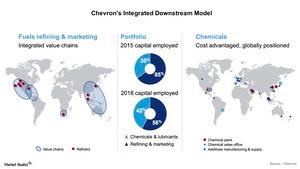
Chevron’s Downstream Value Chains: Is It the Focus Area?
Chevron (CVX) is focusing on expanding its high-return sectors like Petrochemicals, Additives, and Lubricants.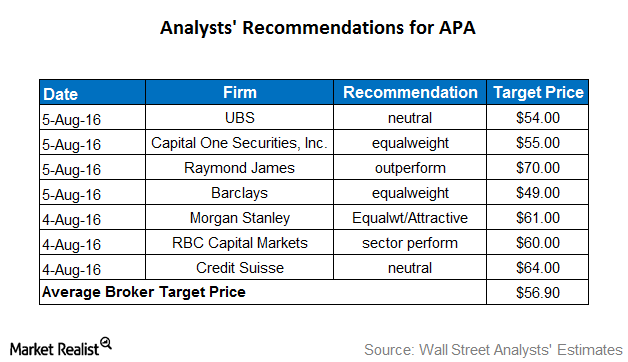
What Analysts Recommend for Apache after 2Q16 Earnings
Approximately 33% of analysts rate Apache (APA) a “buy,” and 55% rate it a “hold.” The remaining 12% rate it a “sell.”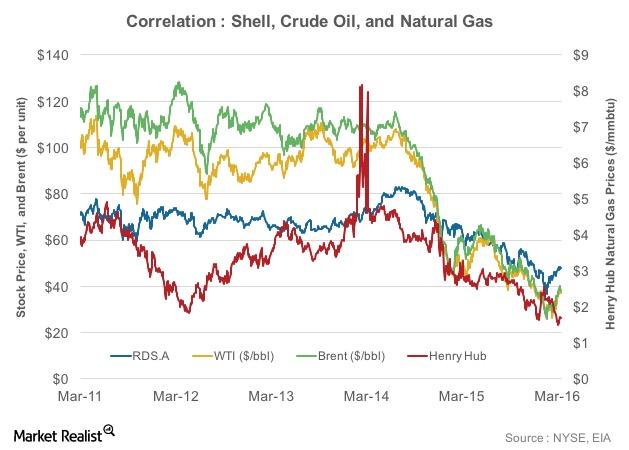
Correlation Analysis: Shell and Oil Price
Shell’s stock price has largely moved in-line with crude oil prices. This is reflected in the results of a correlation test.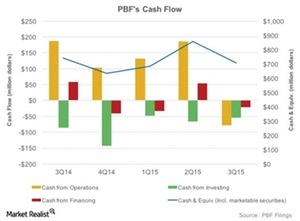
PBF’s Cash Flow Is Volatile amid Changes in Working Capital
PBF Energy has seen a fall in cash balances from 3Q14 to 3Q15. PBF’s cash balance in 3Q15 stood at $707 million, showing a 5% fall over 3Q14.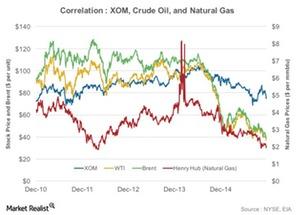
Correlation Analysis: ExxonMobil’s Crude Oil, Natural Gas prices
The correlation coefficients of ExxonMobil to Brent, West Texas Intermediate, and Henry Hub natural gas prices stand at 0.22, 0.35, and 0.36, respectively.