ProShares Ultra Oil & Gas
Latest ProShares Ultra Oil & Gas News and Updates
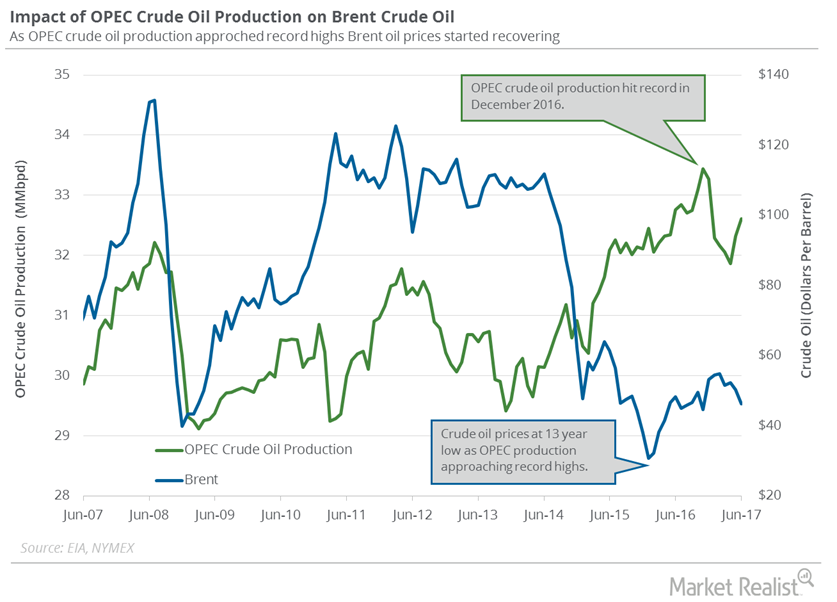
What to Expect from OPEC’s Crude Oil Production in August 2017
October WTI (or West Texas Intermediate) crude oil (USO) (UCO) futures contracts rose 0.4% and were trading at $47.73 per barrel in electronic trade at 2:00 AM EST on August 22, 2017.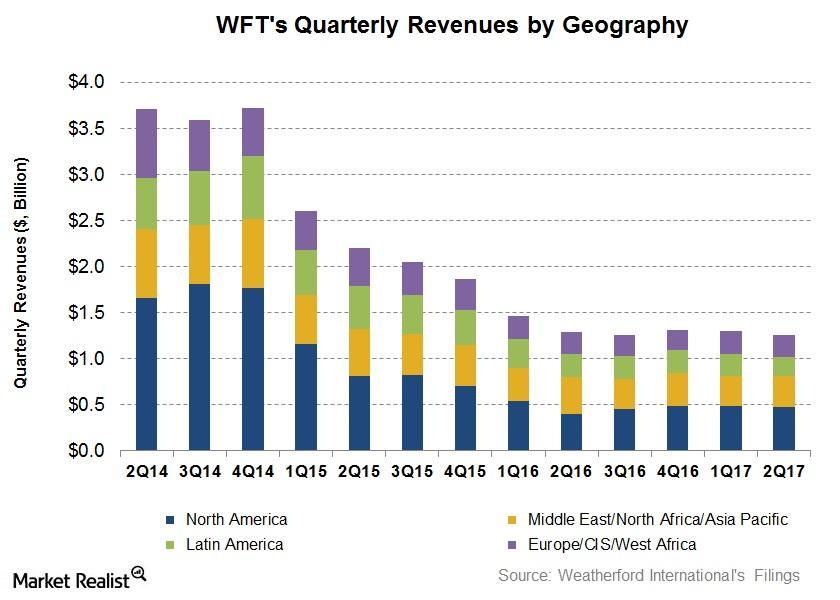
Weatherford International’s Value Drivers in 2Q17
Revenues from Weatherford International’s (WFT) Latin American region fell the most by 18.5% from 2Q16 to 2Q17.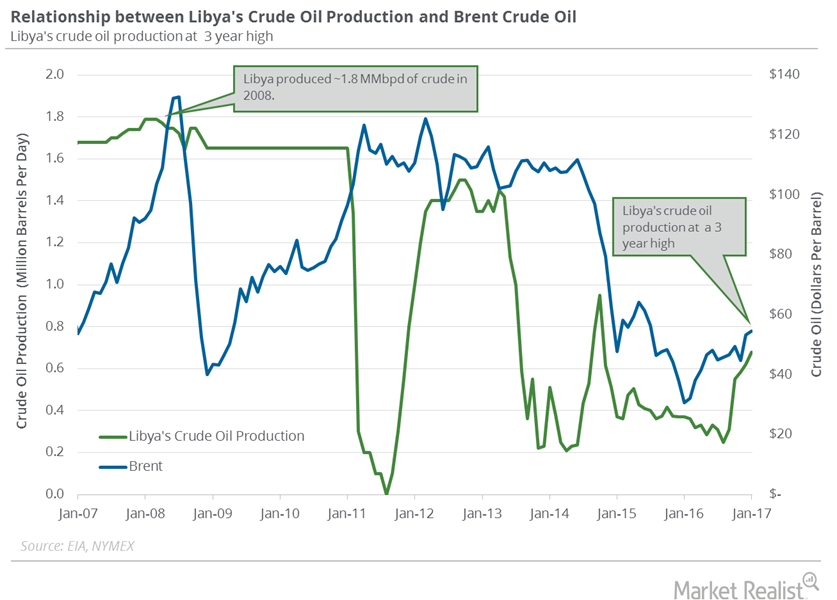
Analyzing Libya’s Crude Oil Production
A Reuters survey estimates that Libya’s crude oil production fell by ~20,000 bpd (barrels per day) to 670,000 bpd in February 2017—compared to January 2017.
Why Did Crude Oil Prices Rise?
On February 9, 2017, US crude oil futures contracts for March delivery closed at $53.00 per barrel—an ~1.3% rise compared to the previous trading session.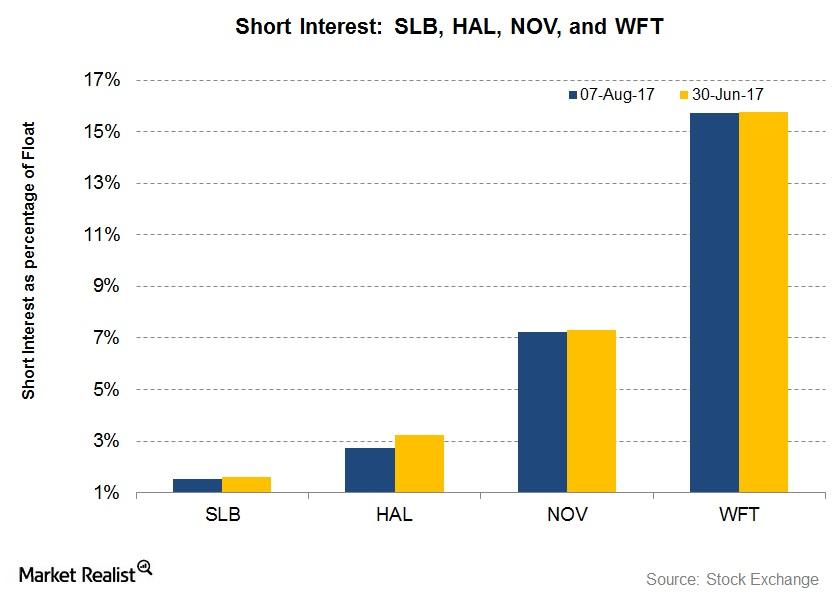
Short Interest in SLB, HAL, WFT, and NOV after 2Q17
The short interest in Schlumberger (SLB), as a percentage of its float, is 1.5% as of August 7, 2017—compared to 1.6% as of June 30, 2017.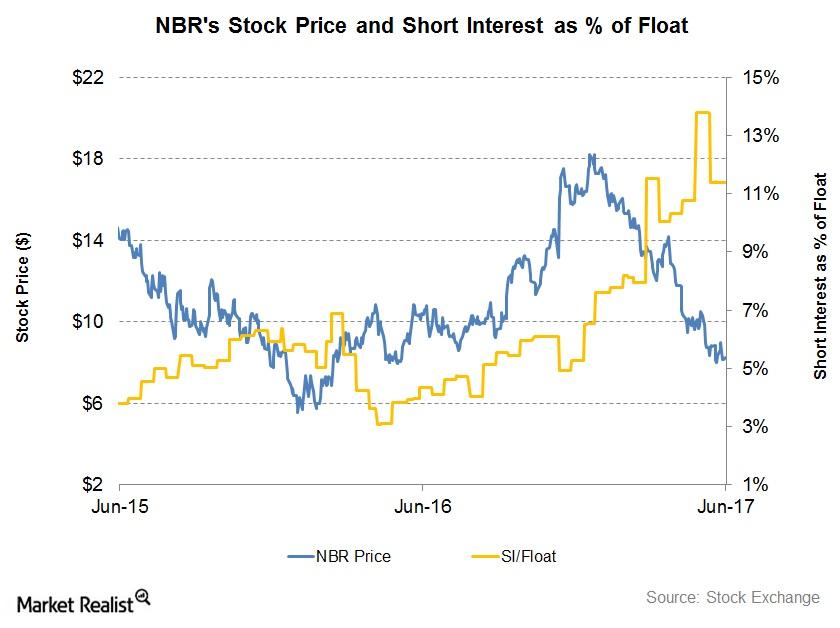
What’s Nabors Industries’ Short Interest as of June 19?
Short interest in Nabors Industries (NBR) as a percentage of its float was 11.4% as of June 19, 2017, compared to 10.1% as of March 31, 2017.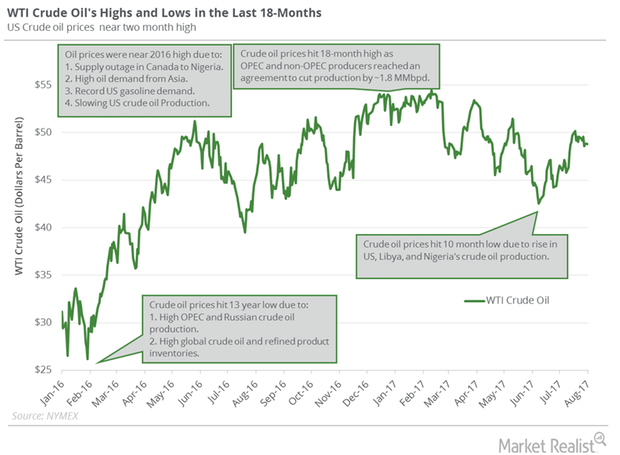
Will US Crude Oil Futures Surpass their 200-Day Moving Average?
Let’s track some important events for oil and gas traders from August 14 to 18, 2017.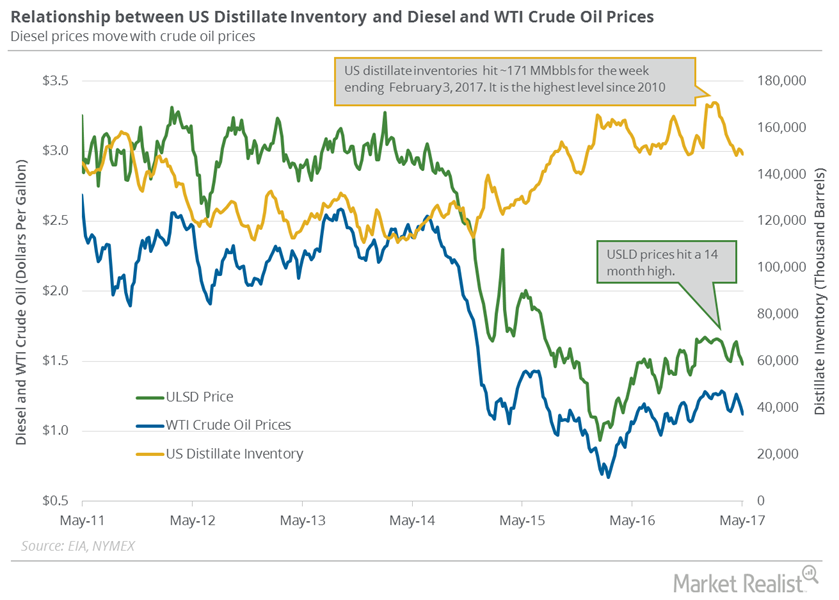
Why Did US Distillate Inventories Fall Again?
June diesel futures contracts rose 2.1% to $1.47 per gallon on May 10, 2017. Prices rose due to the larger-than-expected fall in distillate inventories.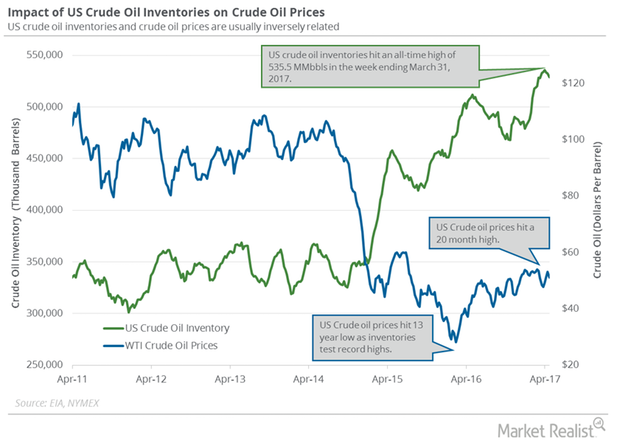
Energy Calendar for Oil and Gas Traders: May 1–5
The energy sector contributed to ~6.3% of the S&P 500 (SPY) (SPX-INDEX) on April 28, 2017. Oil and gas are major parts of the energy sector.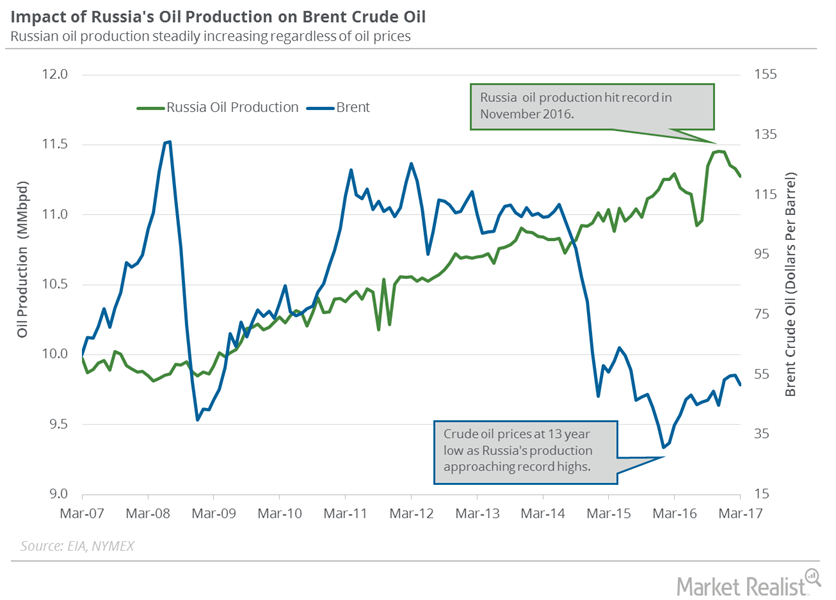
Will Russia’s Oil Production Fall in the Coming Months?
Russia’s Energy Ministry reported that its oil production fell in the first half of April 2017 due to major producers’ production cut deal.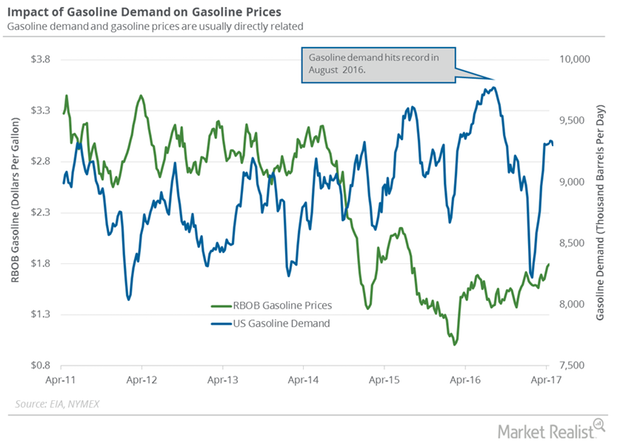
Why Investors Are Tracking US Gasoline Demand
The EIA (U.S. Energy Information Administration) estimated that four-week average US gasoline demand fell by 80,000 bpd to 9,237,000 bpd on April 14–21.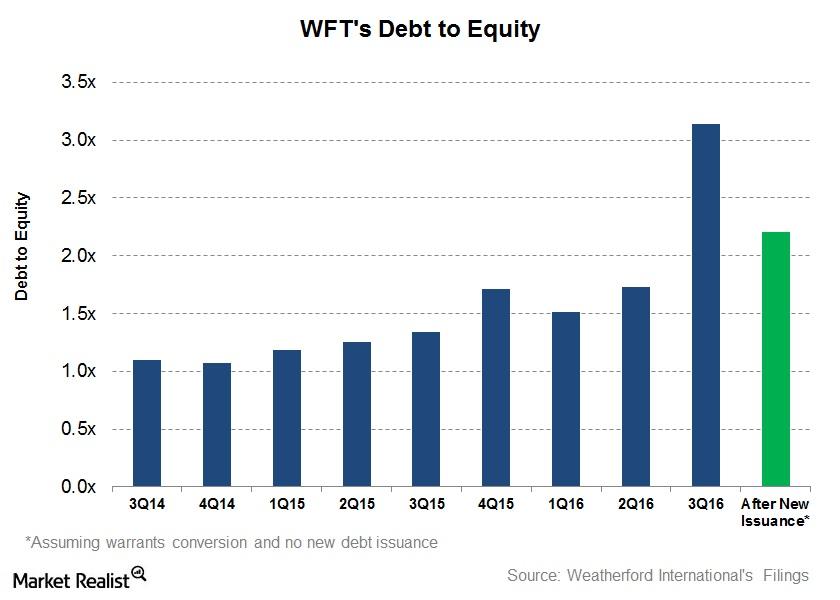
Weatherford International Issues Stocks Again
On November 16, Weatherford International (WFT), an oilfield equipment and services company, disclosed that it issued 84.5 million ordinary stocks.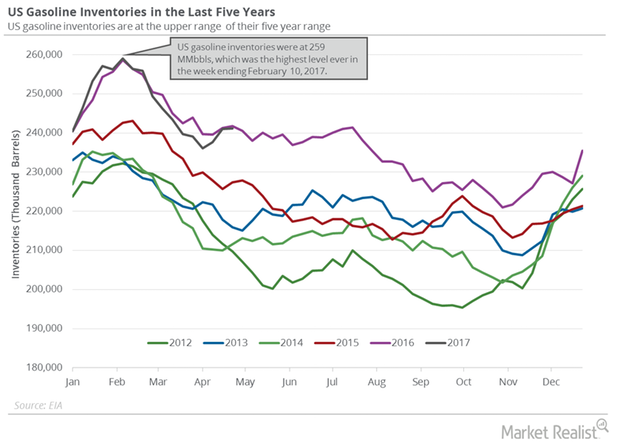
Why US Gasoline Inventories Rose for the Third Straight Week
A less-than-expected rise in gasoline inventories supported gasoline prices on May 3, 2017. Gasoline and crude oil (DIG) (SCO) (VDE) prices rose on May 3.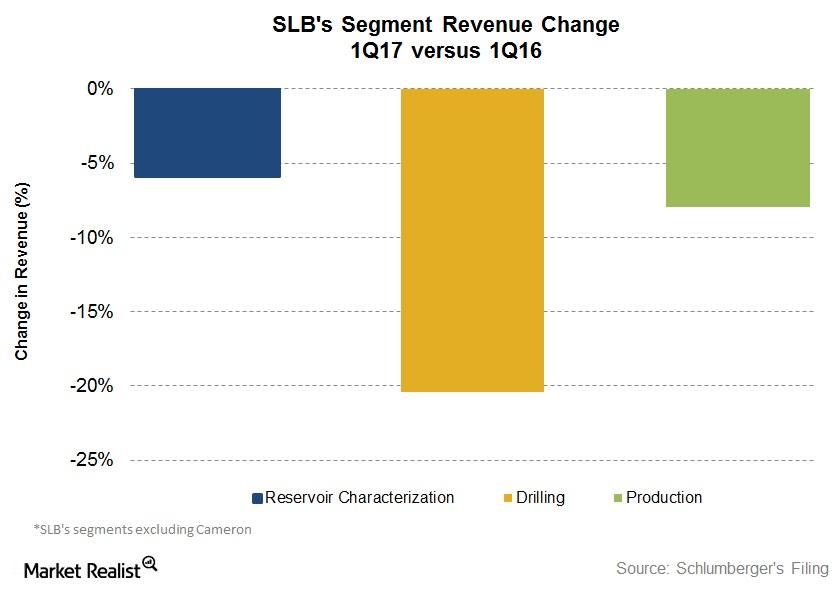
Analyzing Schlumberger’s Growth Drivers in 1Q17
Schlumberger’s (SLB) Drilling segment witnessed the highest revenue fall of 20% in 1Q17—compared to 1Q16. Its Production segment fell ~8%.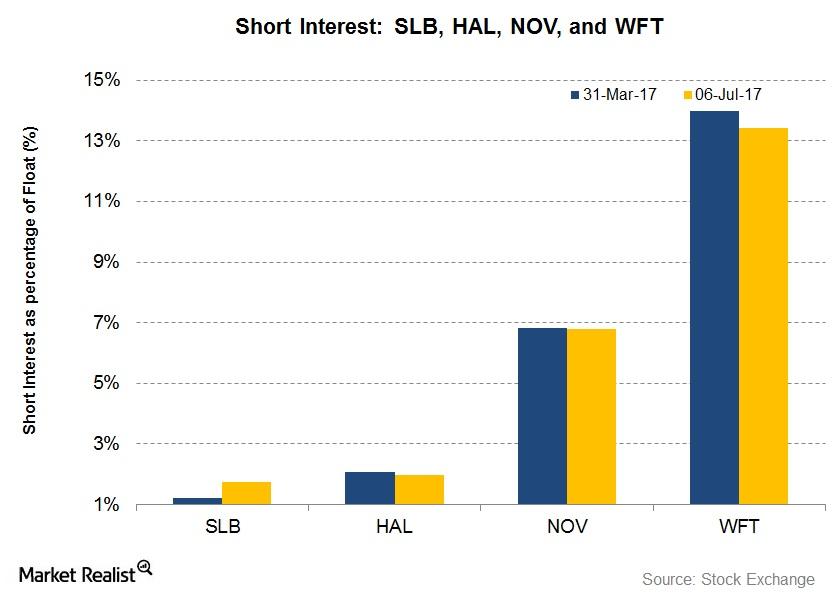
What’s the Short Interest in Large OFS Companies on July 6?
Short interest in Schlumberger (SLB) as a percentage of its float is 1.2% as of July 6, 2017, compared to 1.2% as of March 31, 2017.
What Could Drive Schlumberger’s Performance in 1Q17 and Beyond?
Schlumberger’s (SLB) Drilling segment witnessed the highest revenue fall of 32% in 4Q16 compared to 3Q16.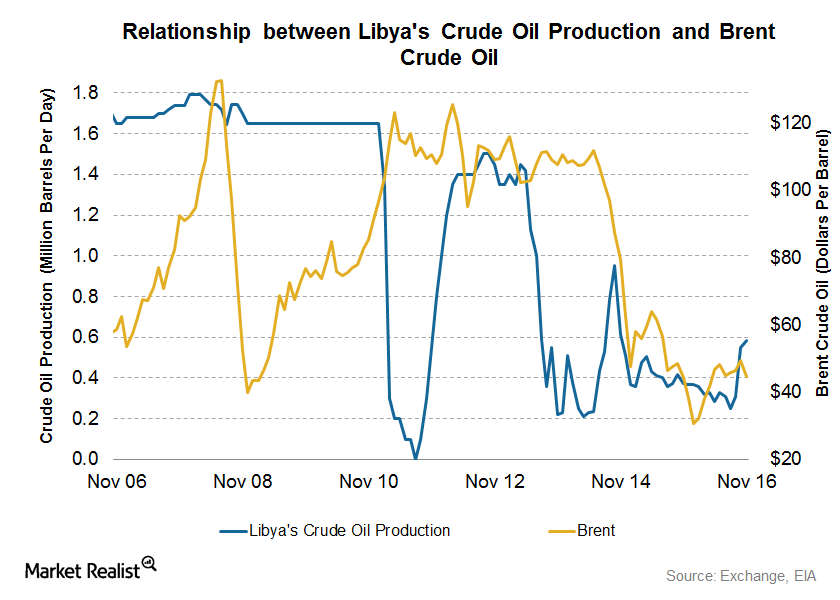
Libya, Iran, and Nigeria Could Impact Crude Oil Prices in 2017
Libya’s crude oil production On December 20, 2016, Libya’s National Oil Corporation reported that pipelines leading from the Sharara and El Feel fields were reopened. The pipelines were closed for two years due to militant attacks. The pipelines are expected to add 270,000 bpd (barrels per day) of crude oil supply over the next three months. The […]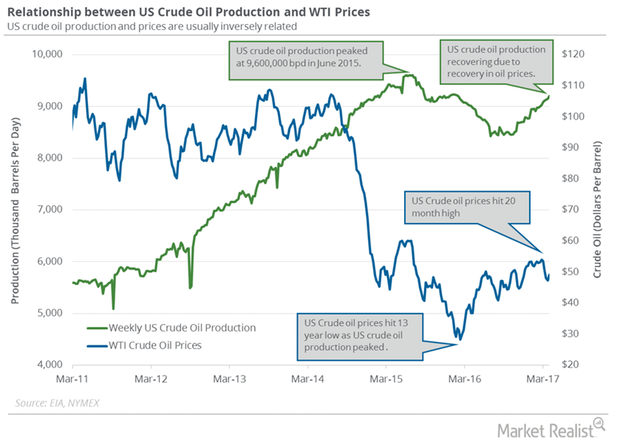
Why US Crude Oil Output Hit a High from January 2016
US crude oil output is at the highest level since January 25, 2016. The rise in crude oil output is the biggest bearish driver for crude oil prices in 2017.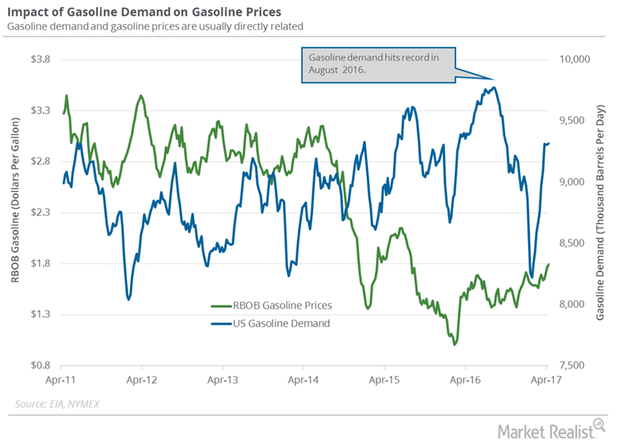
US Gasoline Demand: Bullish or Bearish for Oil Prices?
The EIA (U.S. Energy Information Administration) estimated that four-week average US gasoline demand rose by 6,000 bpd to 9,317,000 bpd on April 7–14.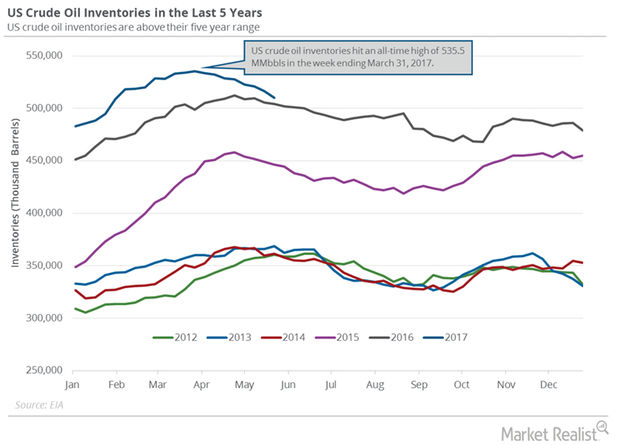
US Crude Oil Inventories: Lower than the Market’s Expectation
The EIA reported that US crude oil inventories fell by 6.4 MMbbls (million barrels) to 509.9 MMbbls on May 19–26, 2017.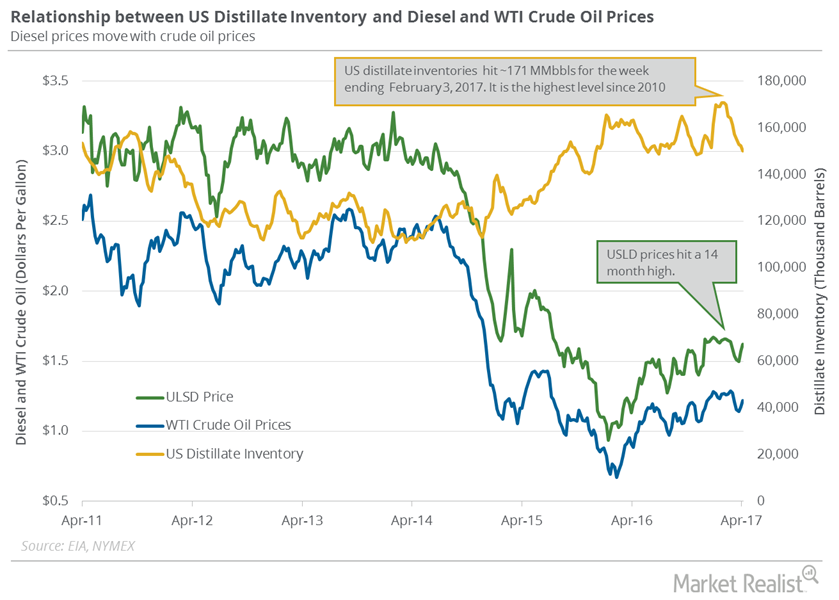
How US Distillate Inventories Affect Diesel and Oil Prices
The EIA (U.S. Energy Information Administration) reported that US distillate inventories fell by 2.2 MMbbls (million barrels) to 150.2 MMbbls between March 31 and April 7, 2017.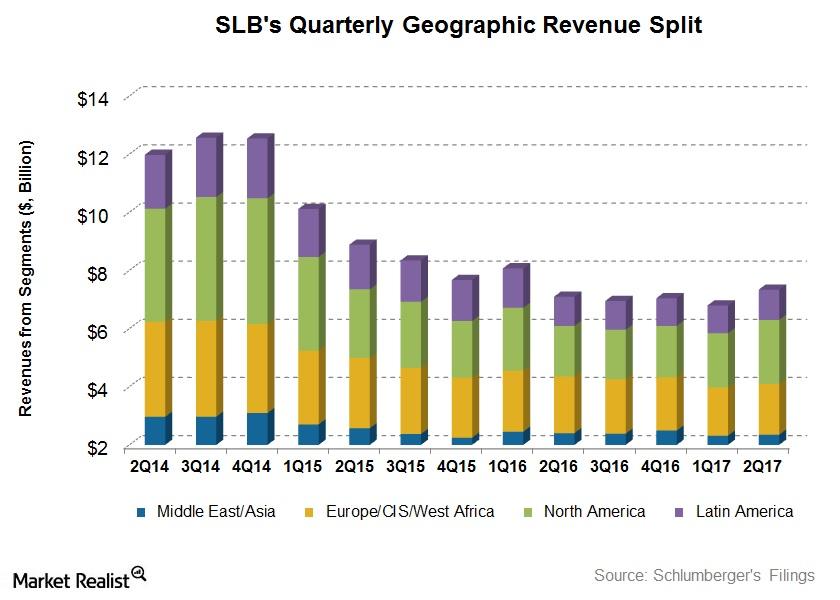
What Were Schlumberger’s Drivers in 2Q17?
In 2Q17, Schlumberger reported a net loss of ~$74 million—a sharp improvement compared to 2Q16 when it reported a net loss of $2.16 billion.
Will the EIA’s Crude Oil Inventories Support Crude Oil Bulls?
On April 18, 2017, the API released its weekly crude oil inventory report. It reported that US crude oil inventories fell by 0.84 MMbbls from April 7–14.
Could US Crude Oil Production Push Production Cut Deal Past 2017?
The EIA reported that monthly US crude oil production rose 196,000 bpd to 9.0 MMbpd in February 2017.
Global Crude Oil Supply Outages Near 5-Year Low
The US Energy Information Administration estimates that global crude oil supply outages fell by 247,000 bpd (barrels per day) to 2.0 MMbpd (million barrels per day) in June 2017.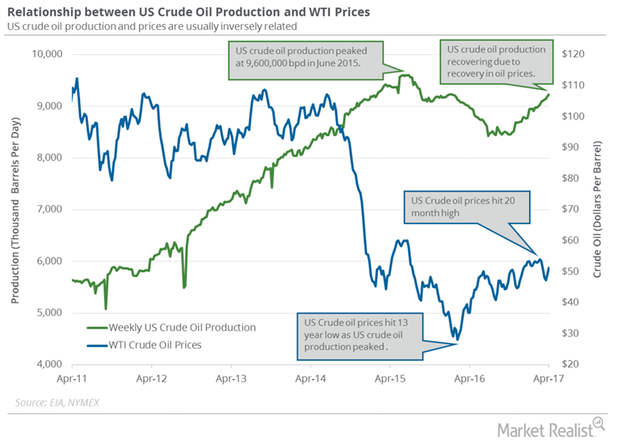
EIA Raises Estimates for US Crude Oil Production in 2018
The EIA (U.S. Energy Information Administration) reported that US crude oil production rose by 36,000 bpd (barrels per day) to 9,235,000 bpd between March 31 and April 7, 2017.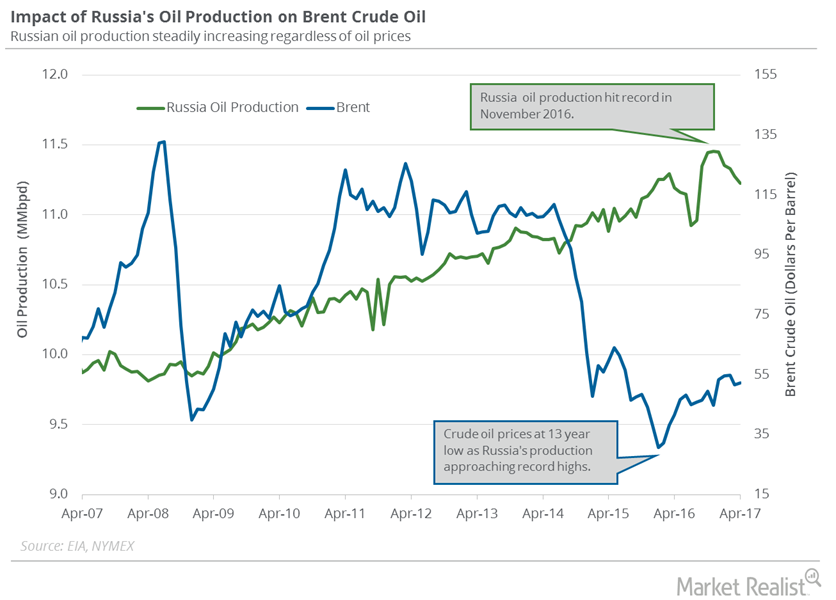
Russia Could Leave OPEC’s Production Cut Deal
Rosneft is Russia’s largest oil producer. On June 1, a Rosneft board member stated that Russia wouldn’t extend the production cut deal beyond March 2018.
US Distillate Inventories Fell for the Tenth Straight Week
The EIA (U.S. Energy Information Administration) reported that US distillate inventories fell by 2 MMbbls to 148.3 MMbbls on April 7–14, 2017.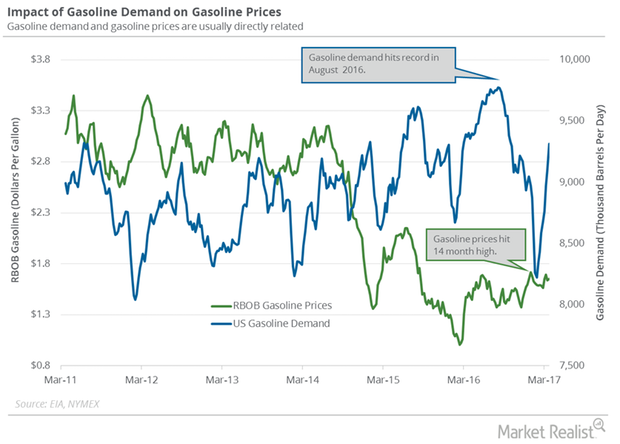
US Gasoline Demand: Key Crude Oil Driver in 2017
The EIA estimated that four-week average US gasoline demand rose by 210,000 bpd (barrels per day) to 9,312,000 bpd from March 17–24, 2017.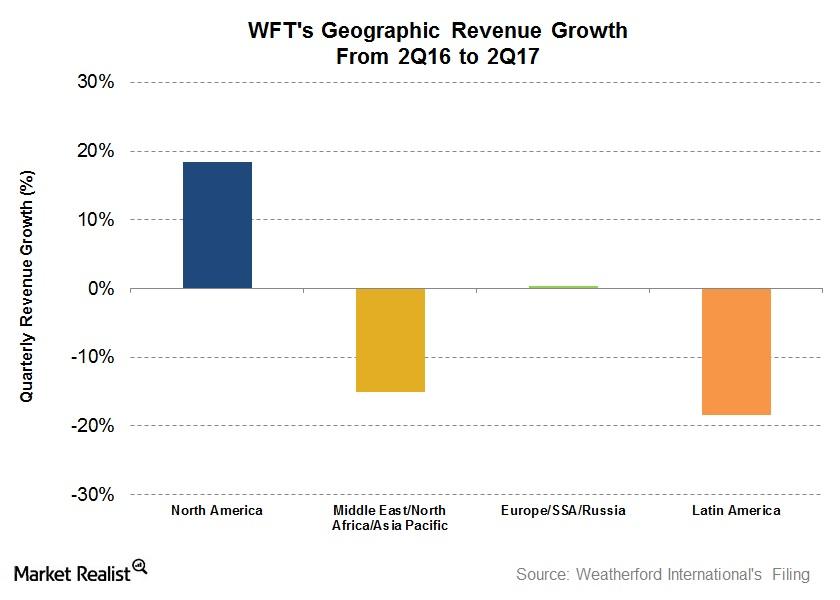
Analyzing Weatherford International’s 2Q17 Performance
In 1H17, Weatherford’s revenues fell 8%—compared to 1H16. It managed to lower its net losses significantly during this period.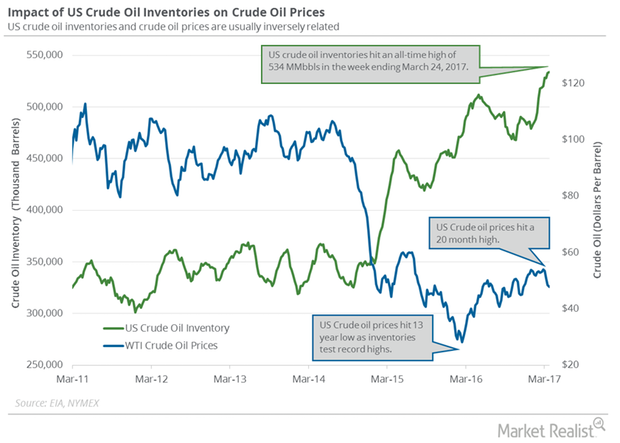
Energy Calendar: Analyzing Key Oil and Gas Drivers
The energy sector contributed to ~6.6% of the S&P 500 on March 31, 2017. Oil and gas producers’ earnings depend on crude oil and natural gas prices.
Monthly US Crude Oil Production Hit May 2016 High
The EIA reported that monthly US crude oil production rose by 60,000 bpd (barrels per day) to 8.8 MMbpd in January 2017—compared to the previous month.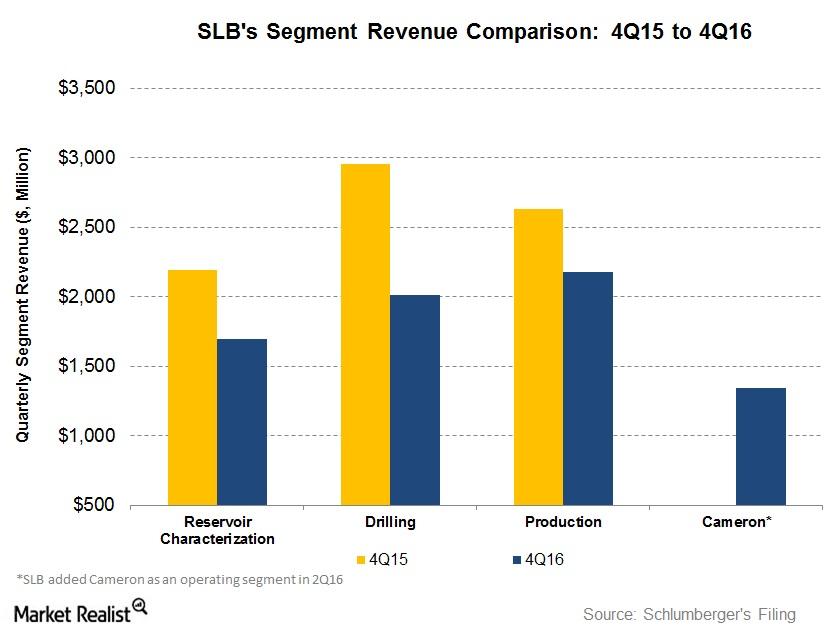
Analyzing the Factors Affecting Schlumberger’s Revenue
Schlumberger’s Drilling segment witnessed the highest revenue fall at 32% in 4Q16 compared to 4Q15. The segment was followed by the Reservoir Characterization and Production segments.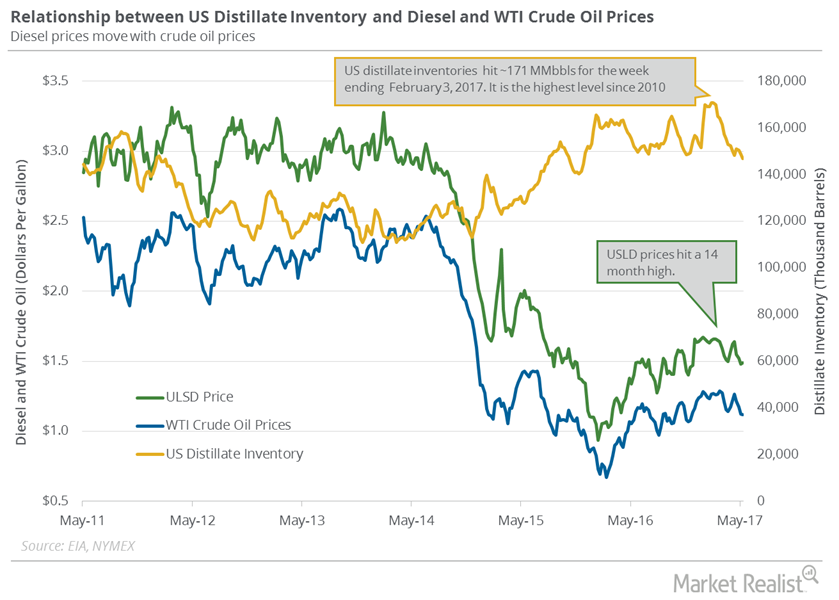
US Distillate Inventories Fell for the Third Straight Week
The EIA reported that US distillate inventories fell by 1.9 MMbbls (million barrels) to 146.8 MMbbls on May 5–12, 2017.
Hedge Funds Are Turning Bearish on US Crude Oil
Hedge funds reduced their net long positions in US crude oil futures and options by 12,094 contracts to 157,891 contracts on September 5–12, 2017.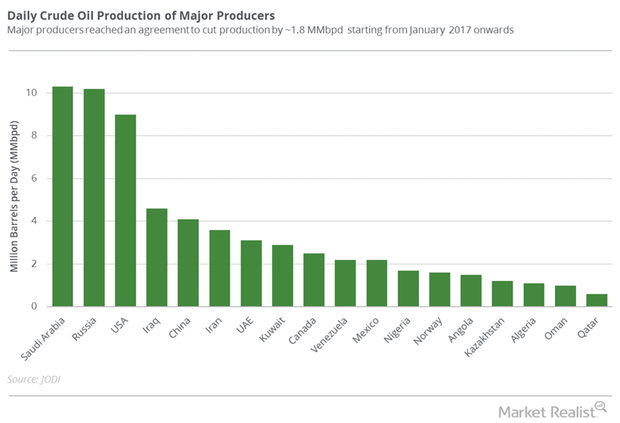
Will Major Oil Producers Extend the Output Cut Deal past March?
October WTI (West Texas Intermediate) crude oil (USO)(UCO)(DIG) futures contracts rose 0.16% and were trading at $49.98 per barrel in electronic trading at 2:10 AM EST on September 18.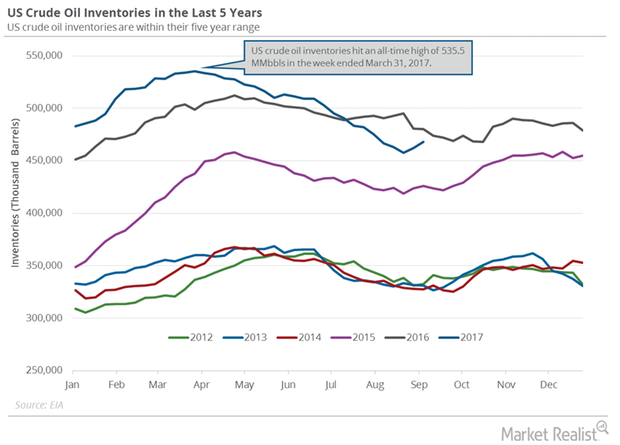
Why US Crude Oil Inventories Rose Again
On September 13, the EIA (U.S. Energy Information Administration) released its weekly crude oil inventory report.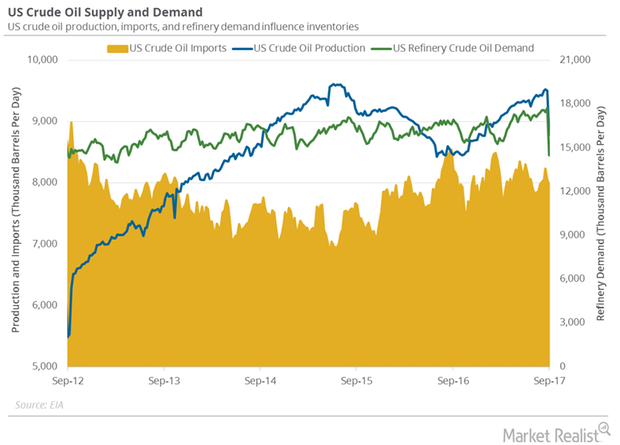
Hurricanes Could Impact Global and US Crude Oil Demand
West Texas Intermediate crude oil (DBO) (DIG) (XLE) futures contracts for October delivery rose 1.2% to $48.07 per barrel on September 11, 2017.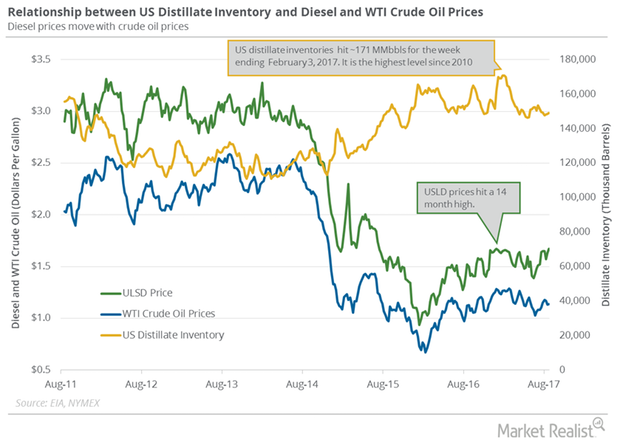
US Distillate Inventories Rise for a Third Week
US distillate inventories On August 30, 2017, the EIA (U.S. Energy Information Administration) released its weekly crude oil inventory report. The EIA estimates that US distillate inventories rose by 0.5% to 149.1 MMbbls (million barrels) between August 18 and 25, 2017. Inventories fell by 5.6 MMbbls, or 3.6%, from the same period in 2016. Inventories […]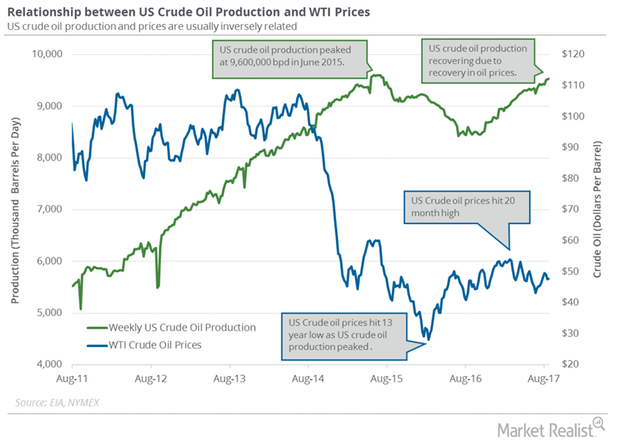
How Hurricane Harvey May Impact US Crude Oil Production
US crude oil production The EIA (U.S. Energy Information Administration) estimates that US crude oil production rose by 2,000 bpd (barrels per day) to 9,530,000 bpd between August 18 and 25, 2017. Production rose 1,042,000 bpd, or 12.3%, from the same period in 2016. It has risen for three consecutive weeks to August 25, and has reached […]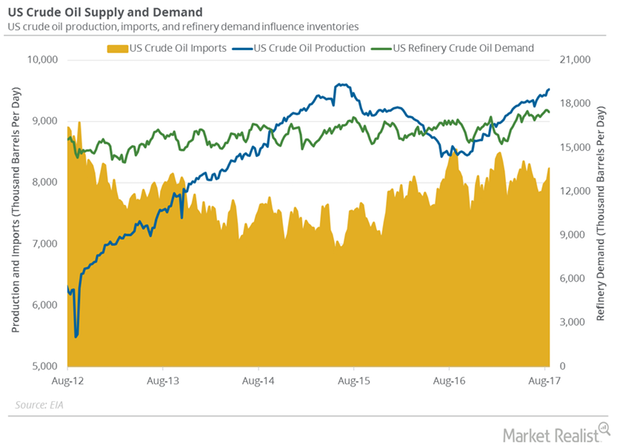
Will US Crude Oil Futures Rise above Key Moving Averages?
Let’s track some important events for oil and gas traders between August 28 and September 1, 2017.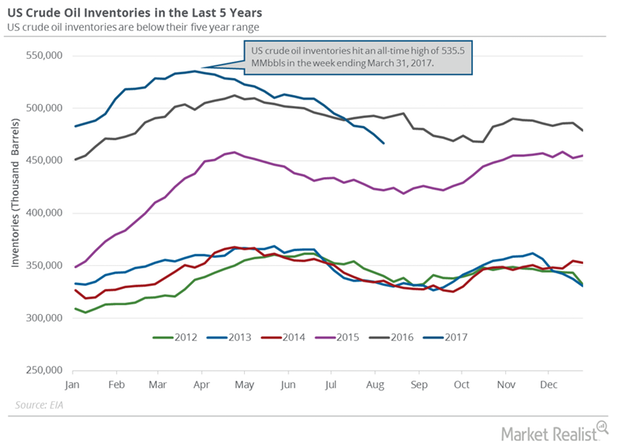
US Crude Oil Inventories: Biggest Draw since September 2016
The EIA reported that US crude oil inventories fell by 8.9 MMbbls or 1.8% to 466.4 MMbbls on August 4–11, 2017—the biggest draw since September 2016.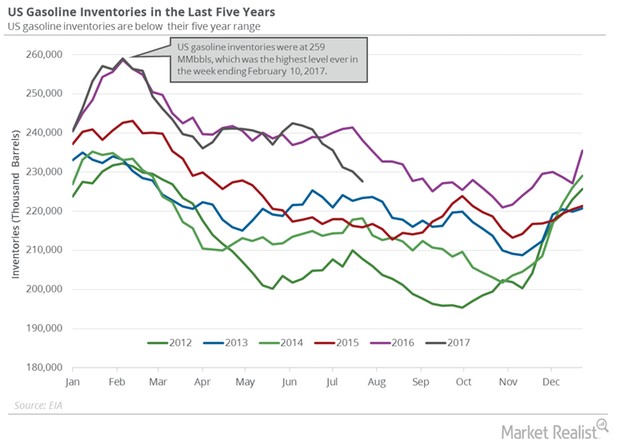
Will US Crude Oil and Gasoline Inventories Support Oil Prices?
September WTI (West Texas Intermediate) crude oil (OIH) (SCO) (DIG) futures contracts rose 0.5% to $47.81 per barrel in electronic trading at 1:50 AM EST on August 16, 2017.
Analyzing US Crude Oil and Gasoline Inventories
The API estimates that US gasoline inventories rose by 1.5 MMbbls (million barrels) on July 28–August 4, 2017.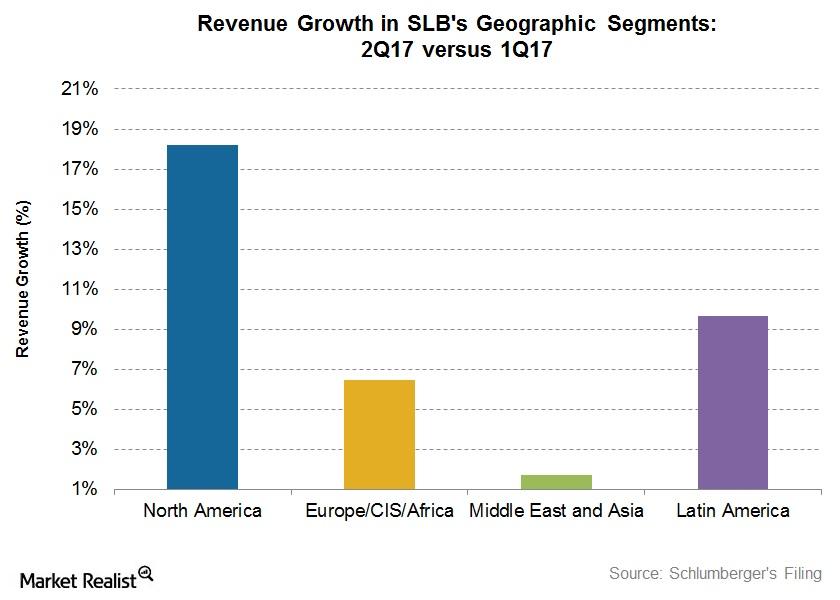
Analyzing Schlumberger’s Growth Drivers in 2Q17
Schlumberger’s (SLB) Production segment witnessed the highest revenue growth (17.6% rise) in 2Q17 over 2Q16.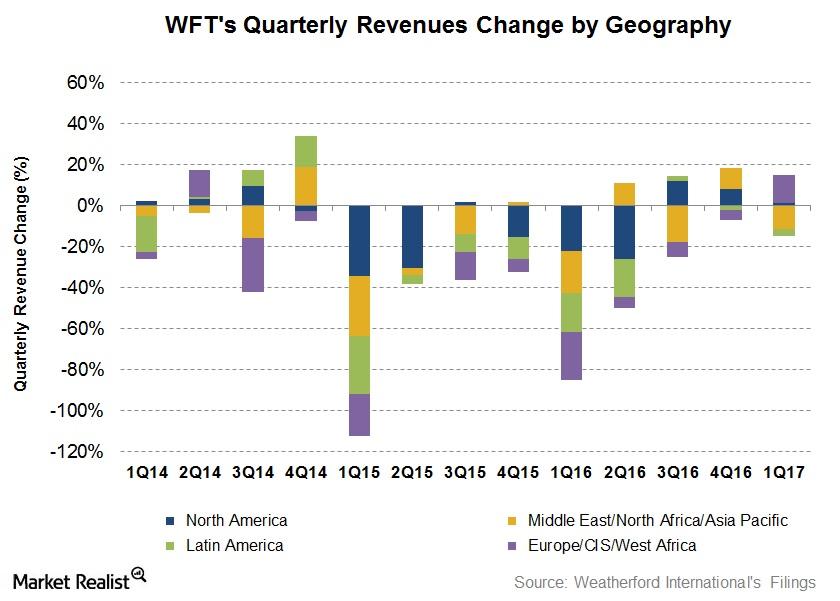
What Are Weatherford International’s Growth Drivers in 1Q17?
In 1Q17, Weatherford International’s net loss was $443 million.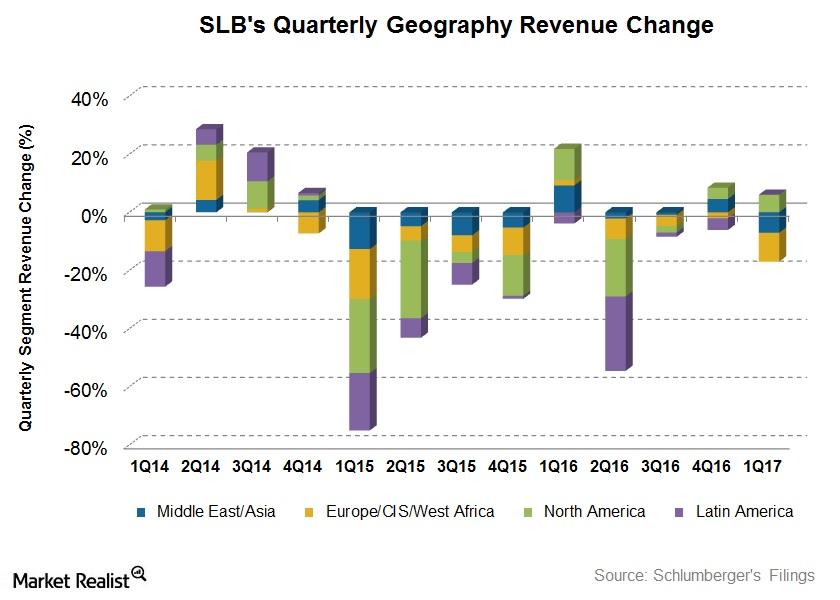
What Drove Schlumberger in 1Q17
Schlumberger’s 1Q17 revenue by geography From 4Q16 to 1Q17, Schlumberger (SLB) witnessed 6% revenue growth in North America, while it saw a steep revenue decline of ~10% in the Europe/CIS[1.Commonwealth of Independent States]/West Africa region. Schlumberger’s revenue from Latin America was resilient in 1Q17, remaining unchanged from 4Q16. Schlumberger accounts for 6.5% of the ProShares […]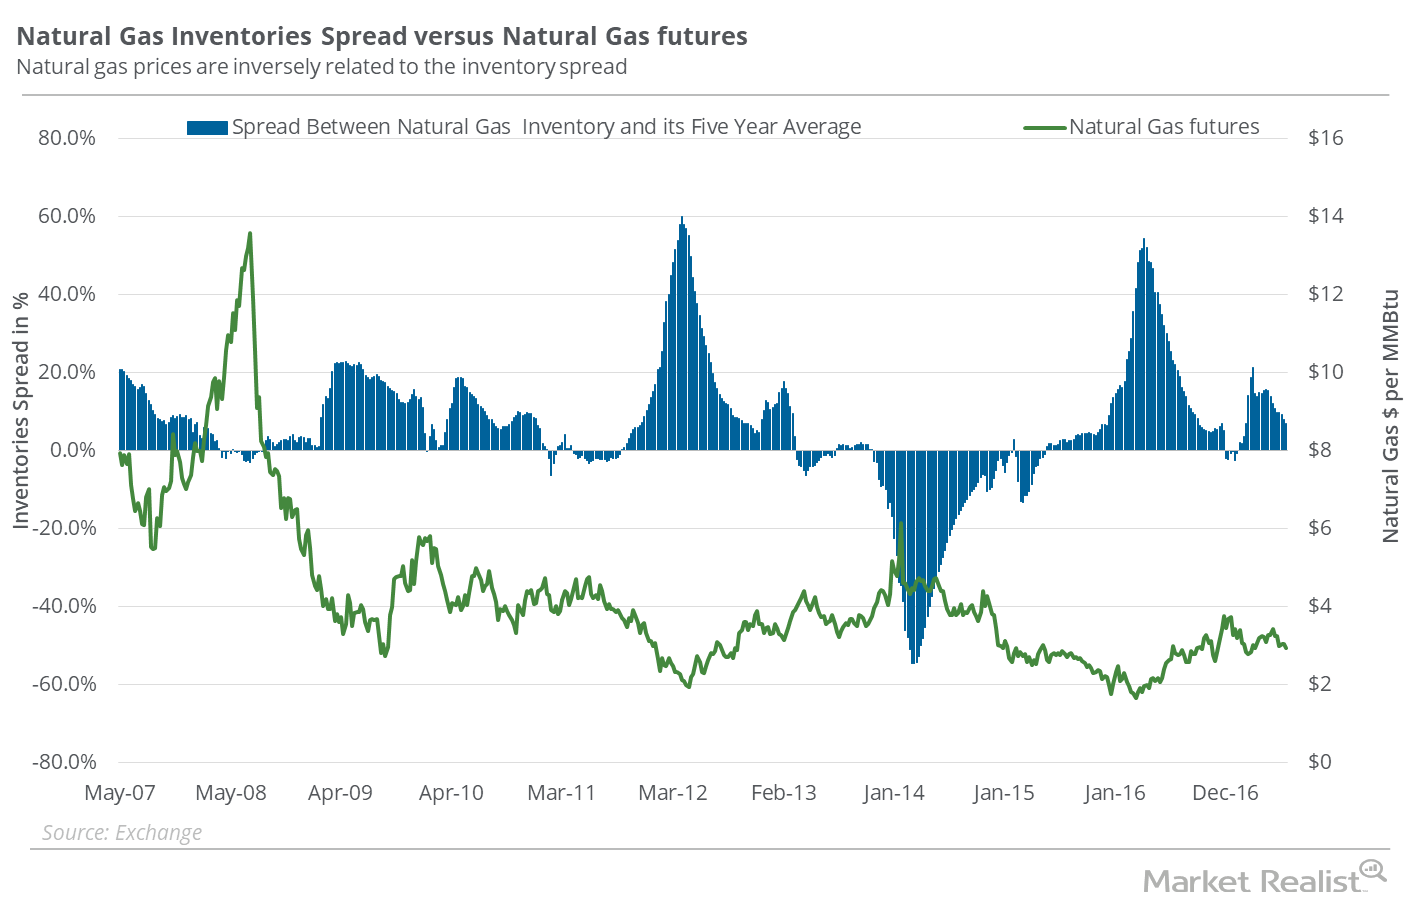
Can the Natural Gas Inventories Spread Rescue Natural Gas Bulls?
In the week ended June 23, 2017, natural gas inventories were at 2,816 Bcf (billion cubic feet)—46 Bcf more compared to the week earlier.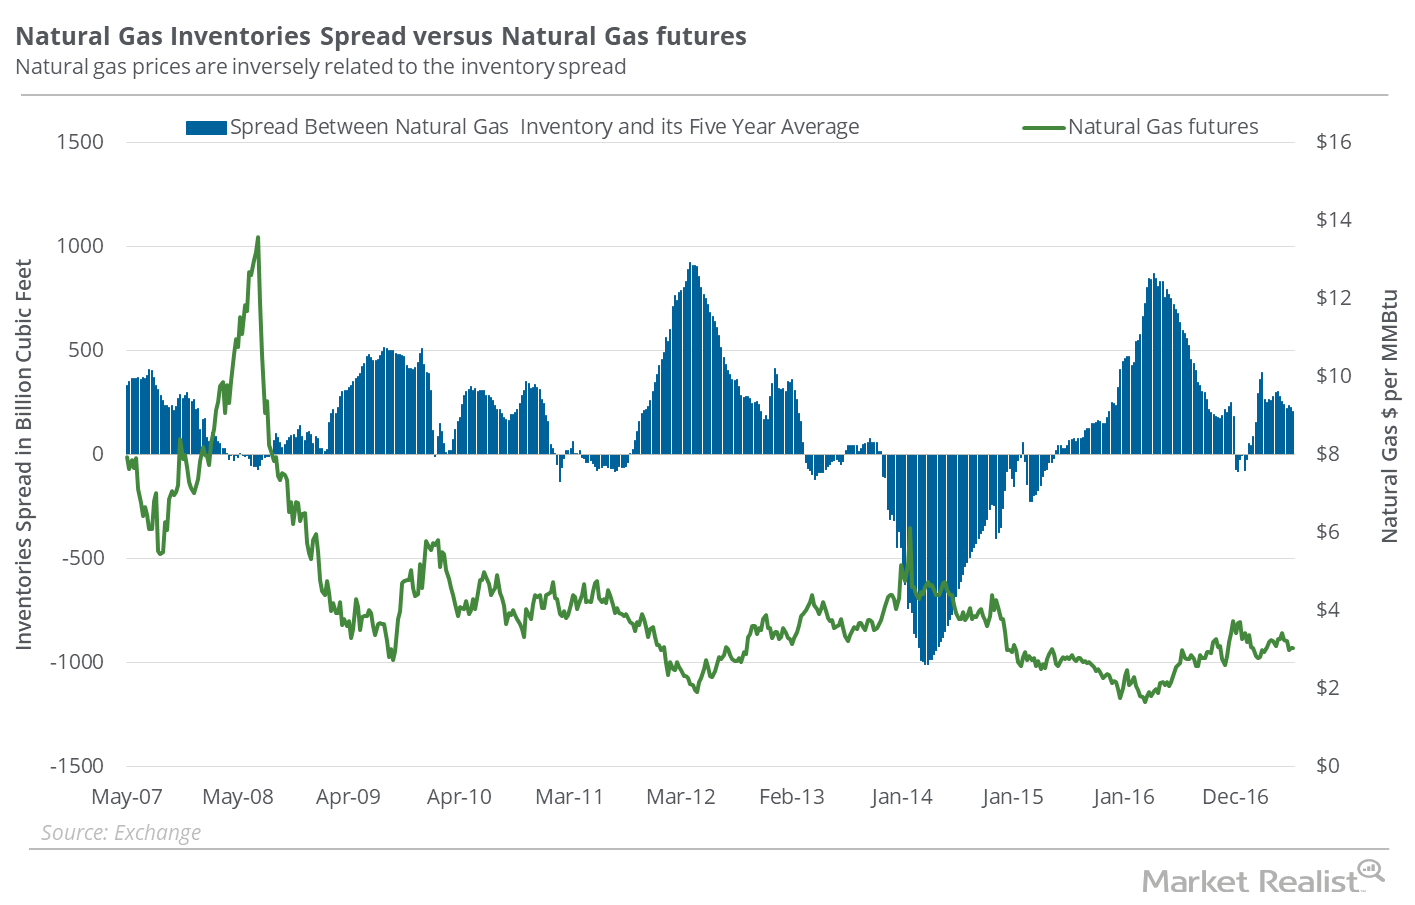
Why the Natural Gas Inventory Spread Supports Its Recent Recovery
In the week ended June 16, 2017, natural gas inventories rose 61 Bcf (billion cubic feet) to 2,770 Bcf based on EIA data released on June 22, 2017.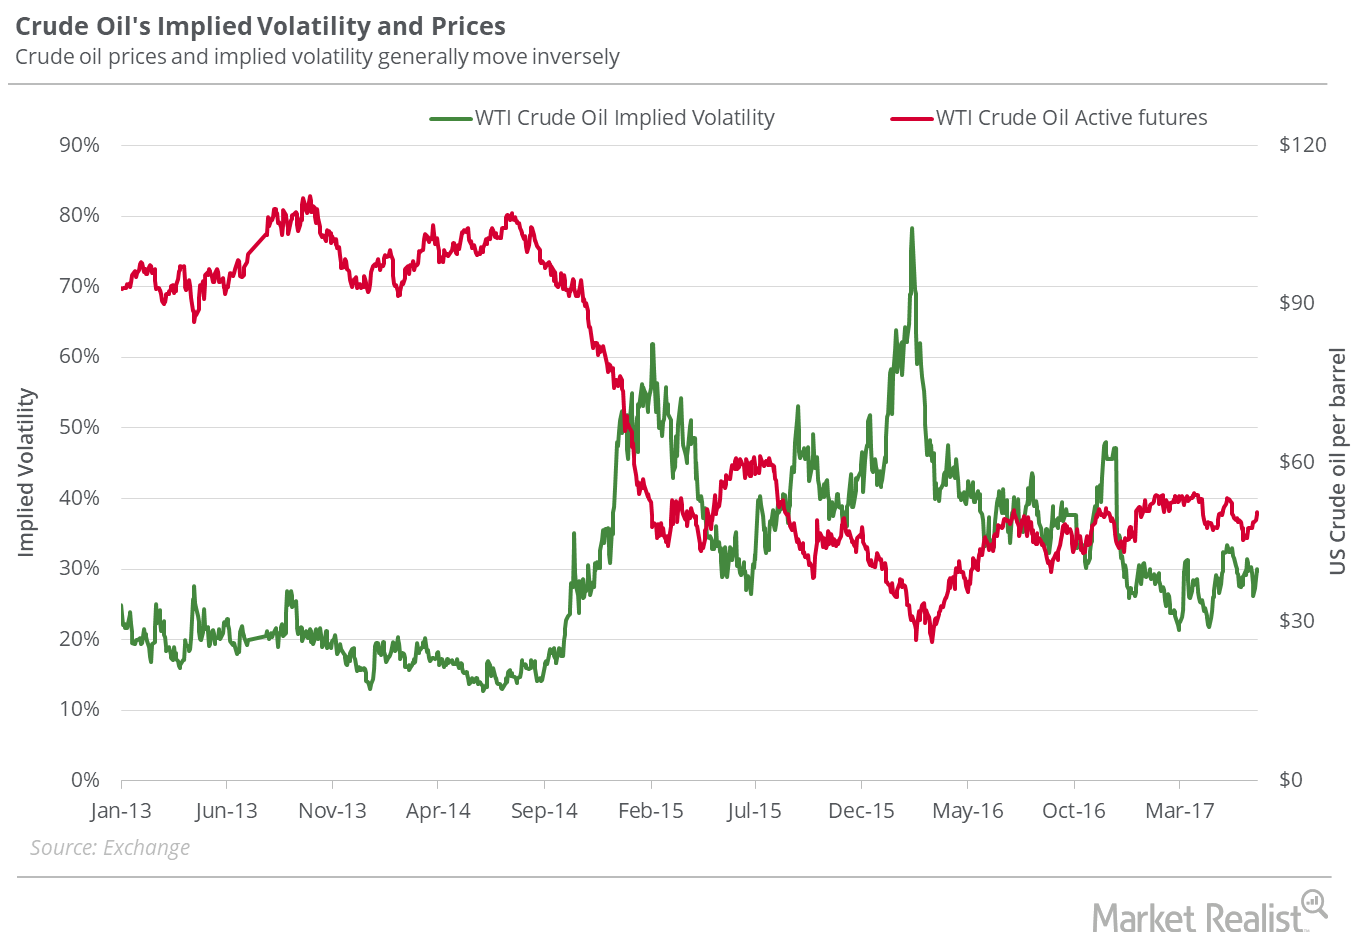
Will US Crude Oil Hit $40 Next Week?
On June 22, 2017, WTI crude oil (USO) (OIIL) active futures’ implied volatility was 29.7%, up 1.7% compared to its 15-day average.