SPDR® S&P Oil & Gas Explor & Prodtn ETF
Latest SPDR® S&P Oil & Gas Explor & Prodtn ETF News and Updates
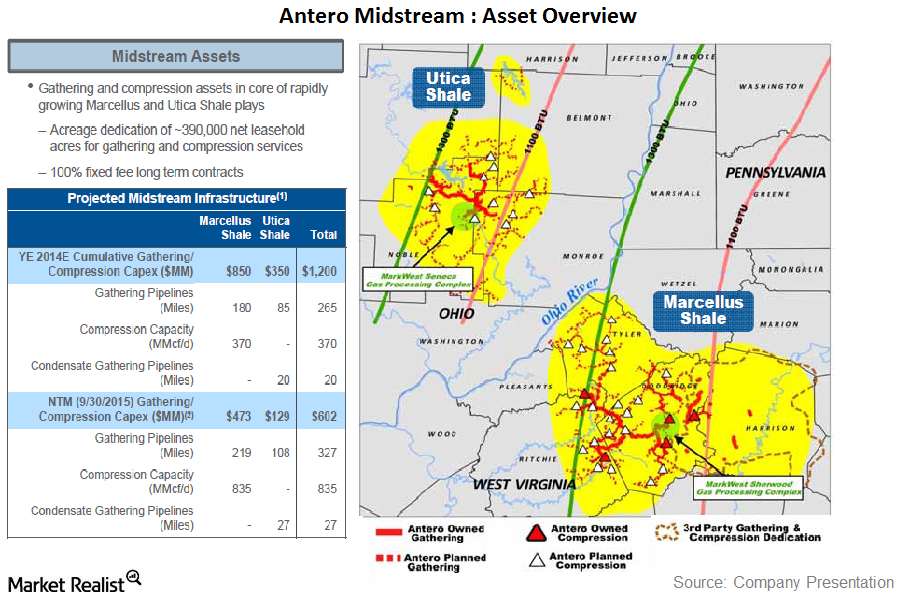
Must-know: A quick look into the Antero Midstream IPO
On October 27, Antero Resources Corporation announced the initial public offering of Antero Midstream Partners LP.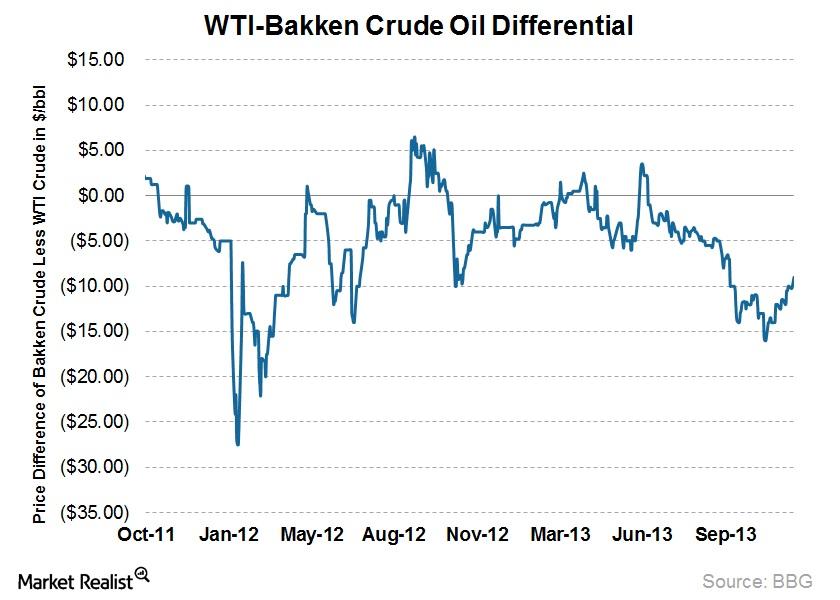
Why oil takeaway capacity in the Bakken can affect earnings
The availability of takeaway capacity from the Bakken can affect producers’ earnings.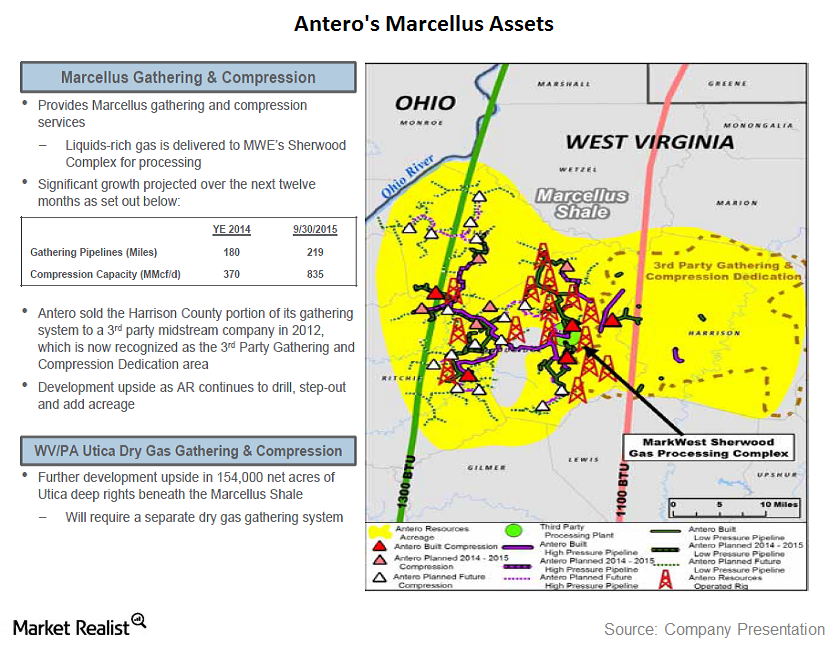
Key update on Antero Midstream’s assets
Antero Resources’ current acreage is focused in the Marcellus Shale in West Virginia and the Utica Shale in Ohio.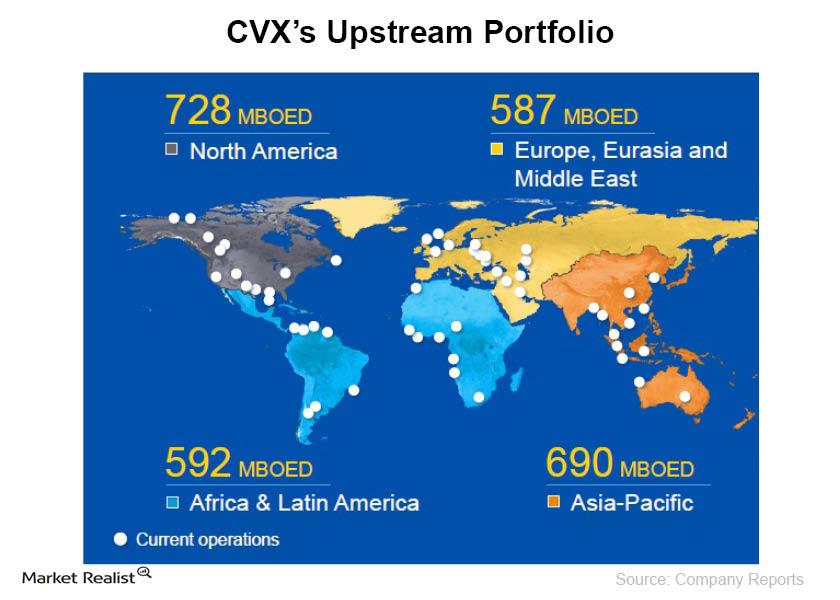
Chevron Corporation: A must-know brief overview
Chevron Corporation is currently trading at EV-to-2014E EBITDA of 5x, has an approximately $239 billion market cap, and ~$245 billion enterprise value.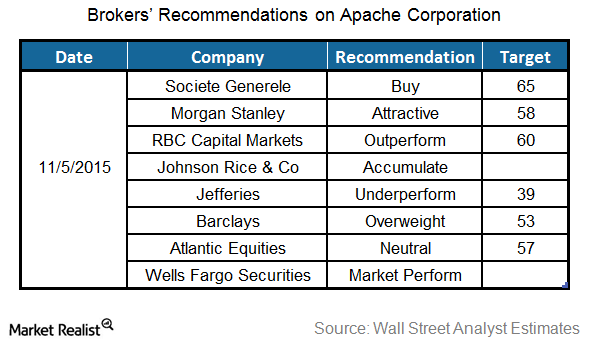
What Are Analyst Recommendations for Apache?
Wall Street analysts gave mixed recommendations after Apache’s quarterly results. Apache shares fell 5% on November 6, 2015, after the earnings release.Energy & Utilities Why improvement in Libya pushed down the crude price last week
For most of the last two years, WTI crude oil has been range-bound between ~$85 per barrel and ~$110 per barrel.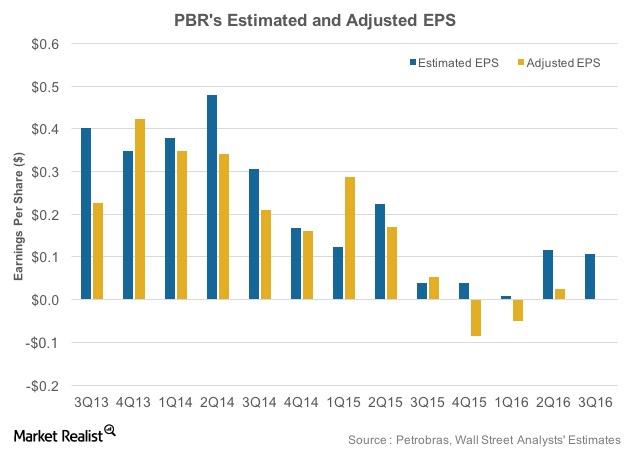
Petrobras’s Upcoming 3Q16 Results: Where Are Earnings Headed?
Petrobras (PBR) is expected to post its 3Q16 results on November 10, 2016. In 2Q16, it had adjusted EPS of $0.03 compared to analysts’ estimates of $0.12.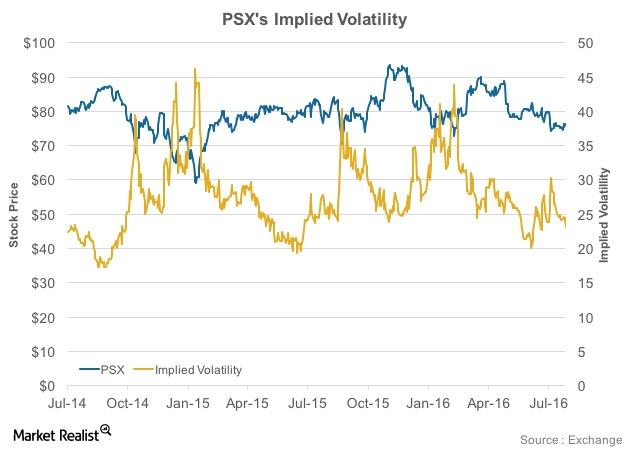
How PSX’s Implied Volatility Trended Post-Earnings
Phillips 66 (PSX) posted its earnings on July 29, 2016. On the day, PSX’s implied volatility fell by 5% to 23.2 compared to the previous day.
Oil’s Contango: Supply–Demand Fears Could Impact the Market
On October 3, 2017, US crude oil (USL) (OIIL) November 2018 futures settled $0.33 higher than the November 2017 futures.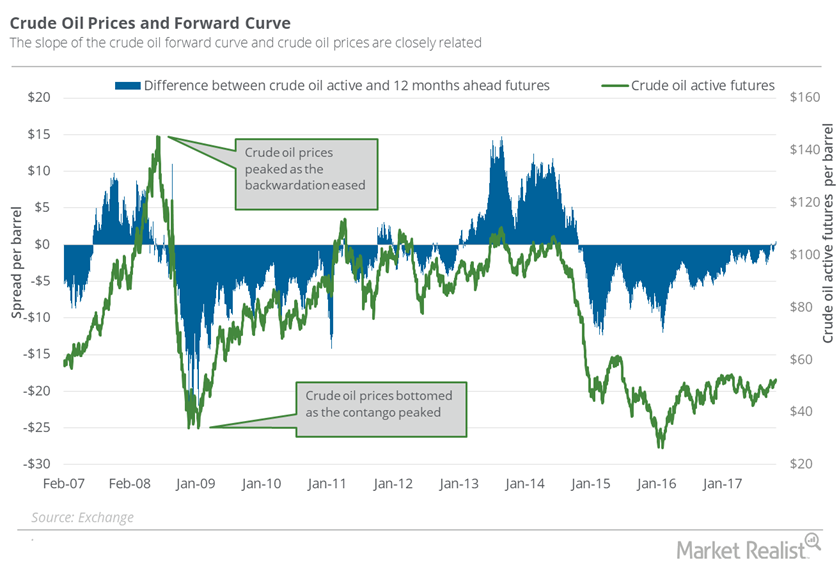
Brent-WTI Spread: Will US Oil Exports Rise Further?
On October 24, 2017, Brent crude oil (BNO) active futures were $5.86 above WTI crude oil active futures.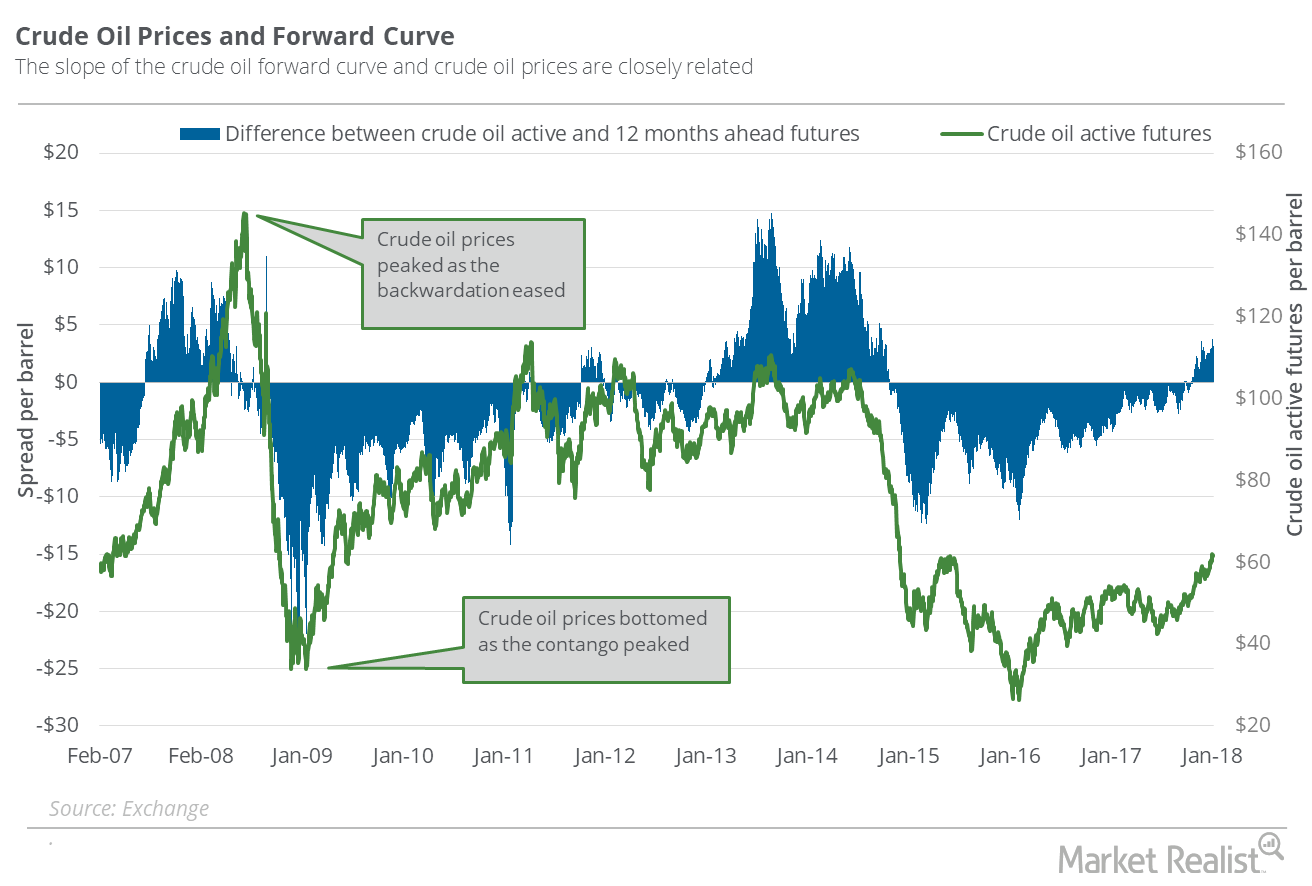
Are Traders Confident about the Oil Supply-Demand Balance?
Between December 29, 2017, and January 8, 2018, the premium and the oil prices rose. The market expects a tightening supply-demand balance for oil in 2018.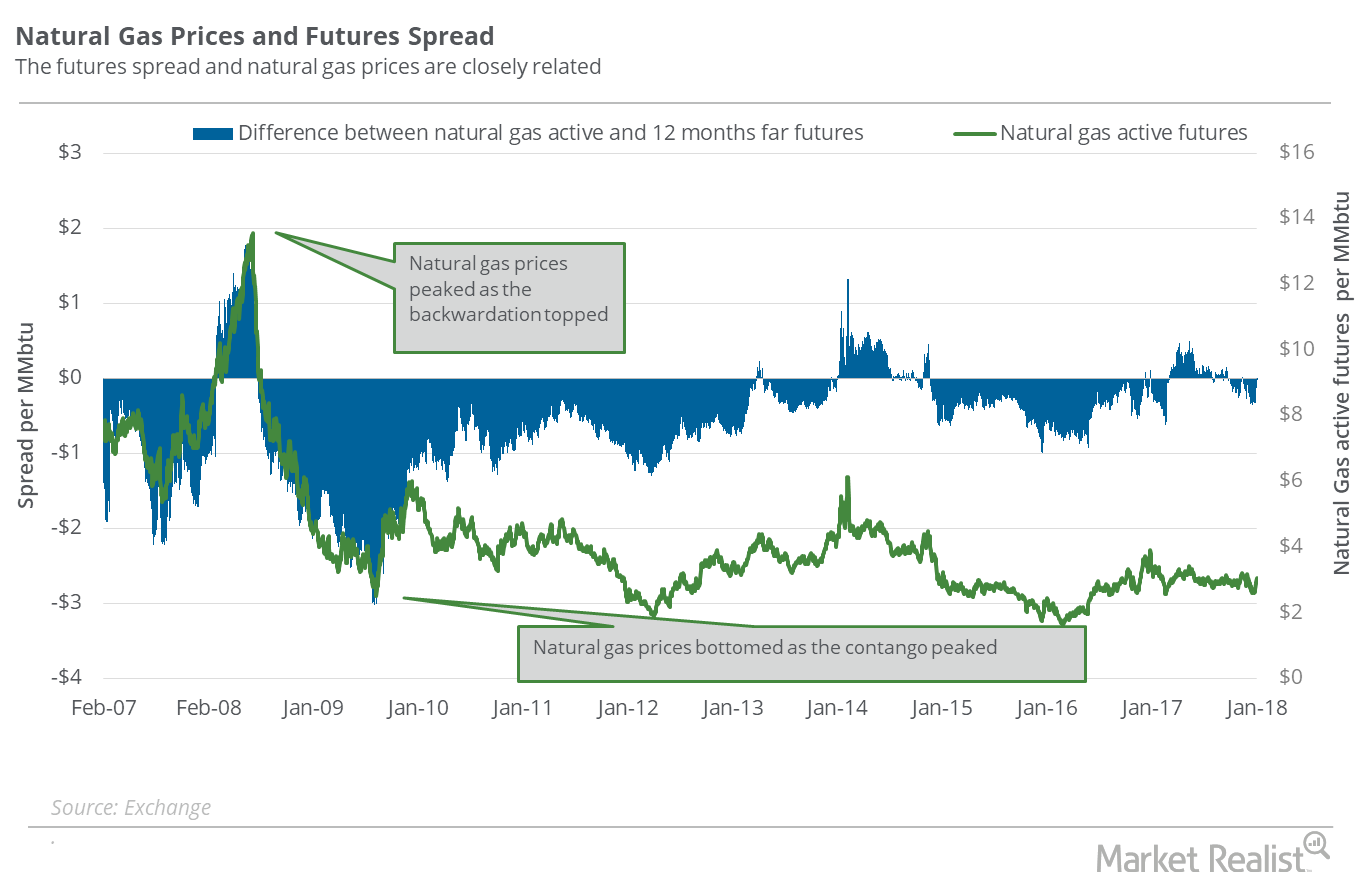
Natural Gas: Are Winter Demand Fears Rising?
On January 2, 2018, natural gas (UNG) (BOIL) (FCG) February 2018 futures settled $0.025 less than February 2019 futures.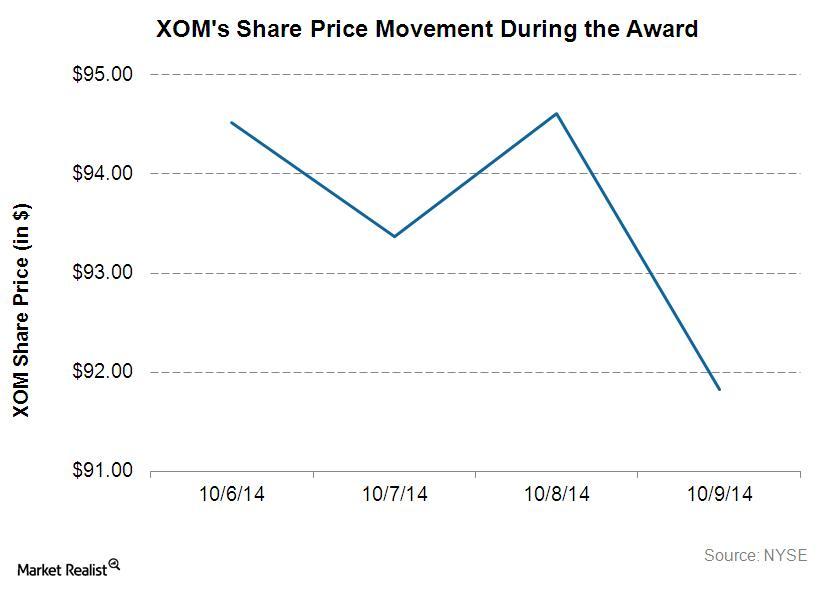
Exxon Mobil wins $1.6 billion in arbitration case against Venezuela
Exxon Mobil alleged that the Venezuelan government illegally expropriated its Venezuelan assets in 2007 and paid unfair compensation.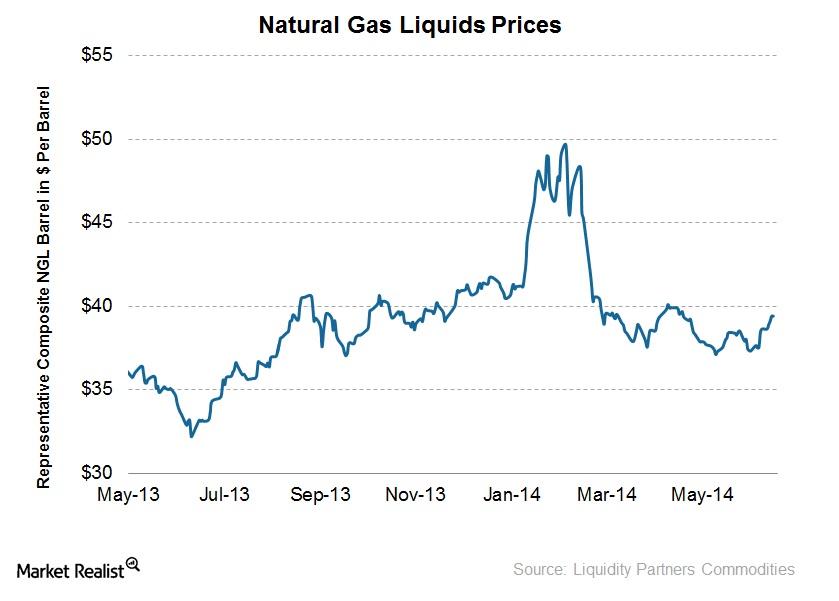
Natural gas liquids prices rise, boosted by propane prices
The representative NGL barrel reached highs of up to ~$50 per barrel in early February, given the strength in propane prices due to a cold winter as well as natural gas prices that pushed ethane prices up.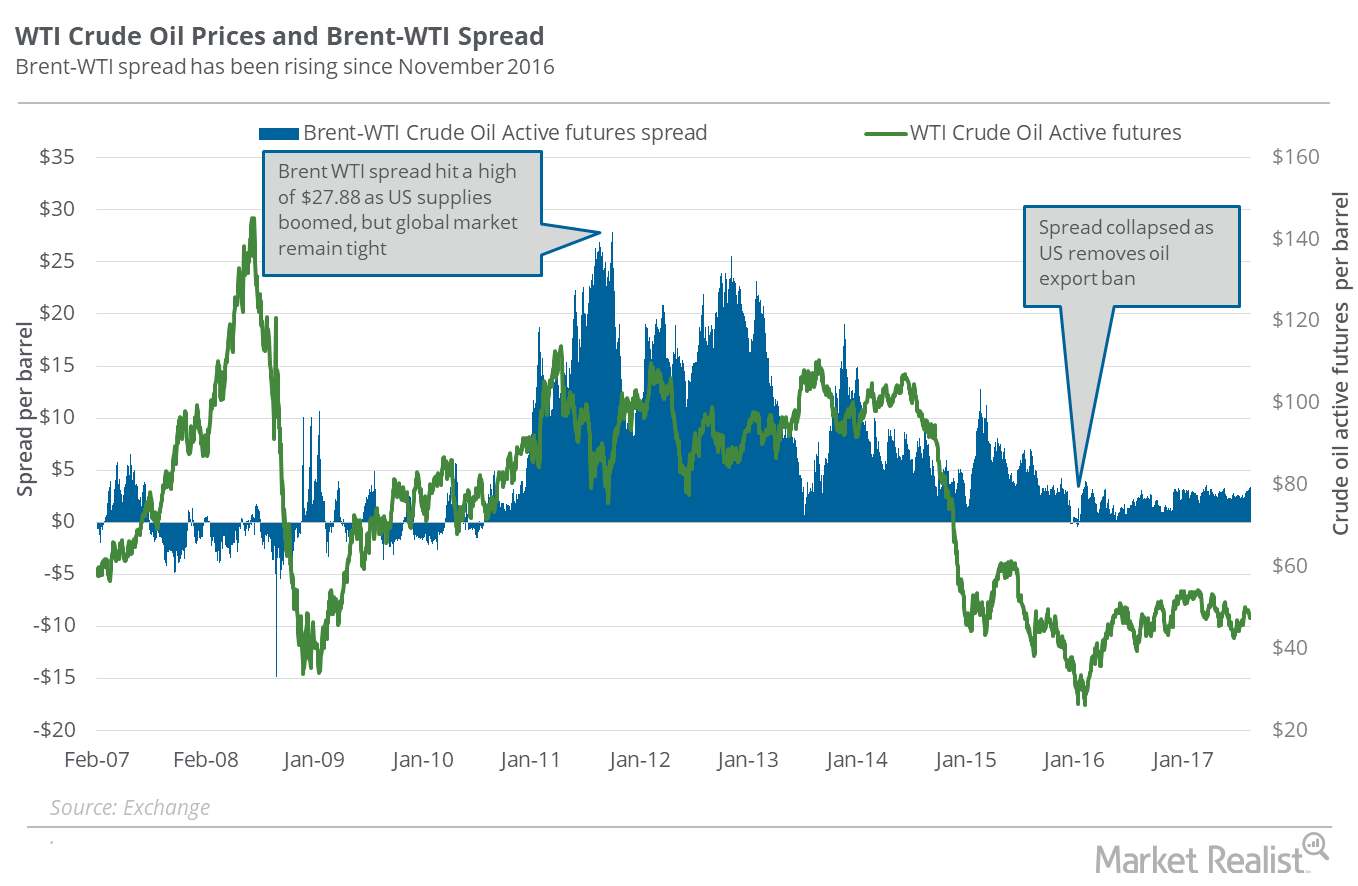
What the Brent–WTI Spread Indicates
On August 15, Brent crude oil active futures were trading $3.25 more than the WTI crude oil active futures. On August 8, the spread stood at $2.97.
Will US Crude Oil Prices Outperform in 2H17?
WTI crude oil (BNO) (PXI) (UCO) (XOP) prices have fallen 18% year-to-date. They have fallen 7% in the past year due to bearish drivers.
Oil Majors Keep New Projects Worth $200 billion on Ice
Wood Mackenzie research shows that the oil majors have deferred more than 45 significant oil and gas projects since the beginning of the crude oil price collapse last year.
Are Natural Gas Supplies Overtaking Demand?
Futures spread On September 27, 2017, natural gas (FCG) (GASL) (BOIL) 2018 November futures traded $0.04 lower than November 2017 futures. That is, the futures spread was at a discount of $0.04. On September 20, 2017, the futures spread was at a discount of $0.10. Between September 20 and 27, 2017, natural gas November futures […]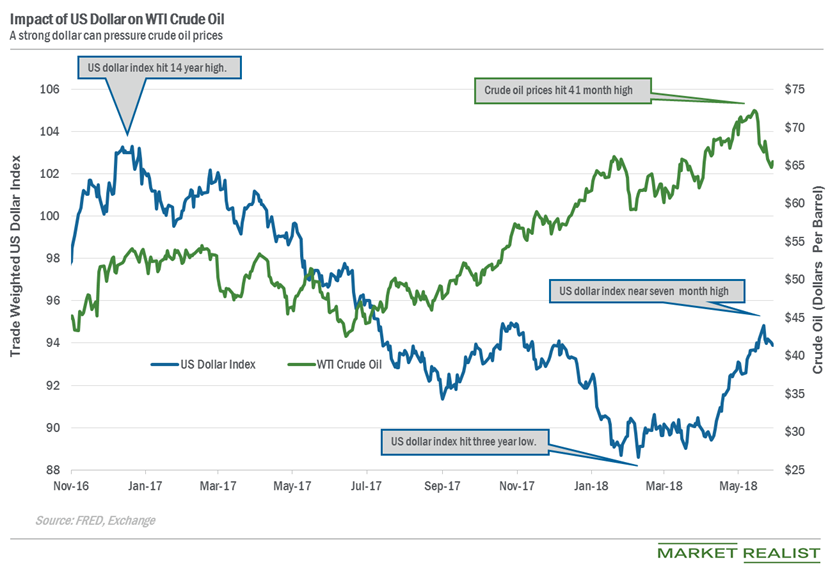
Can the US Dollar Index Help WTI Crude Oil Prices?
The US Dollar Index fell ~0.13% to 93.89, and July WTI oil futures rose ~1.2% on June 5.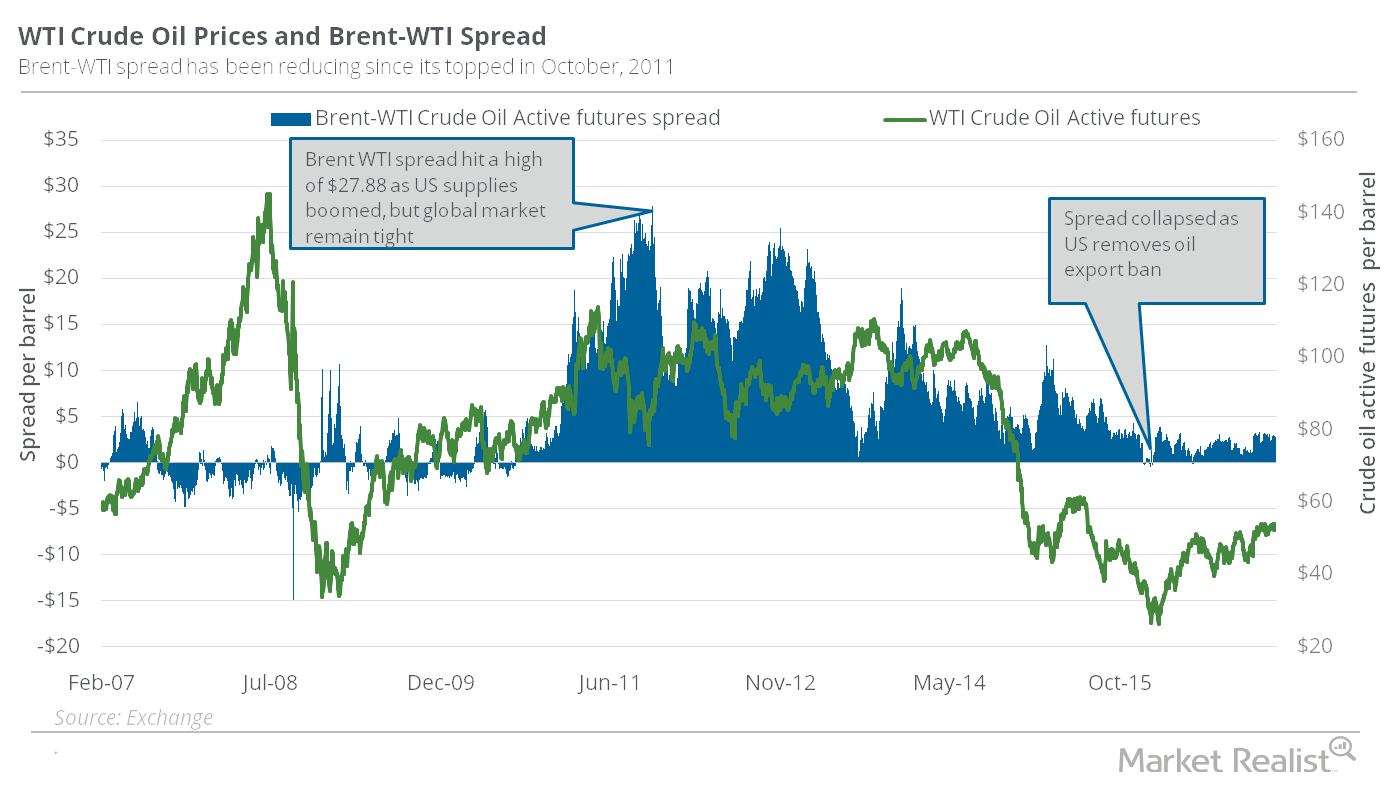
Brent-WTI Spread Impacts Your Oil-Related Investments
On February 14, WTI crude oil (USO) (USL) (OIIL) (SCO) active futures traded at a discount of $2.84 per barrel compared to Brent crude oil active futures.
Why the Brent-WTI Spread Could Make Global Oil Supplies Rise
On October 17, 2017, Brent crude oil (BNO) active futures closed $6 above the WTI (West Texas Intermediate) crude oil futures.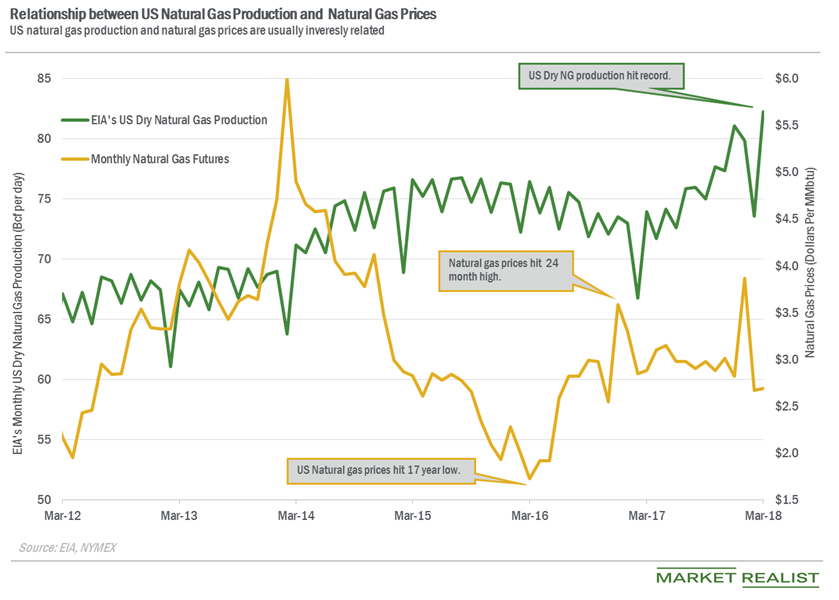
Decoding US Natural Gas Consumption Trends
PointLogic estimates that US natural gas consumption rose ~2.1% to 57.8 Bcf (billion cubic feet) per day from May 31 to June 6.
Oil Market Could Be Pricing in a Supply Deficit
The rise in the premium, along with the rise in oil prices in the trailing week, could mean that the market expects a supply deficit in the oil market.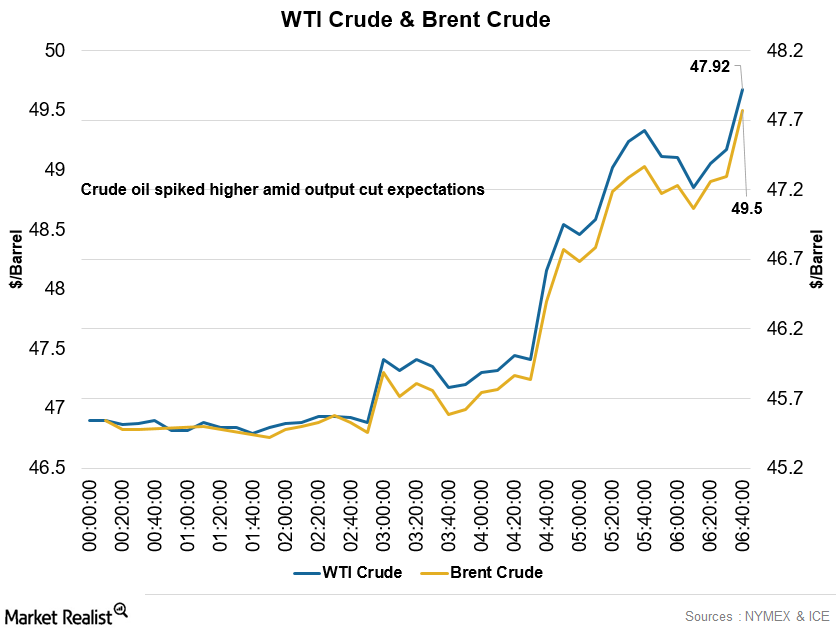
Crude Oil Rose, Copper and Gold Were Weaker in the Early Hours
At 5:35 AM EST, the West Texas Intermediate crude oil futures contract for January 2017 delivery was trading at $47.91 per barrel—a rise of ~5.9%.
Futures Spread: Is the Natural Gas Market Turning Bullish?
On September 20, 2017, natural gas (FCG) (BOIL) October 2018 futures closed $0.10 below its October 2017 futures.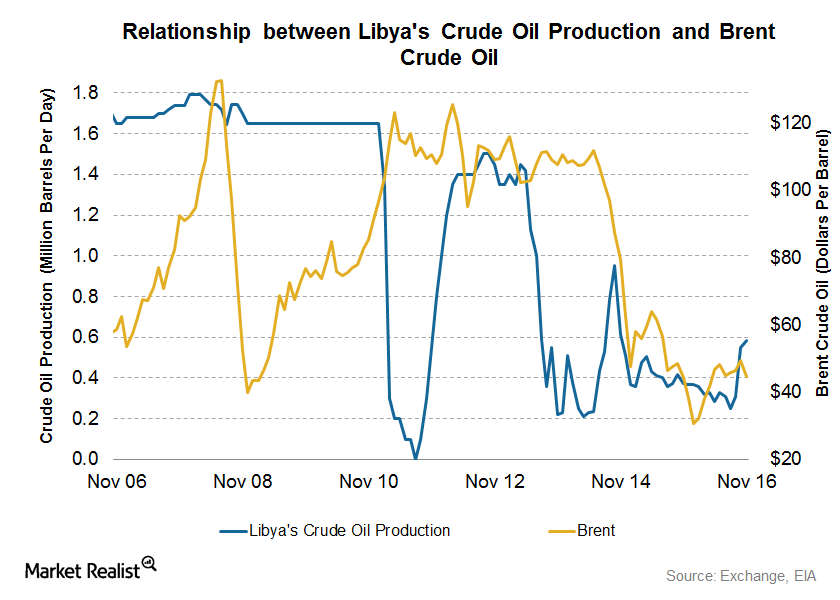
Libya, Iran, and Nigeria Could Impact Crude Oil Prices in 2017
Libya’s crude oil production On December 20, 2016, Libya’s National Oil Corporation reported that pipelines leading from the Sharara and El Feel fields were reopened. The pipelines were closed for two years due to militant attacks. The pipelines are expected to add 270,000 bpd (barrels per day) of crude oil supply over the next three months. The […]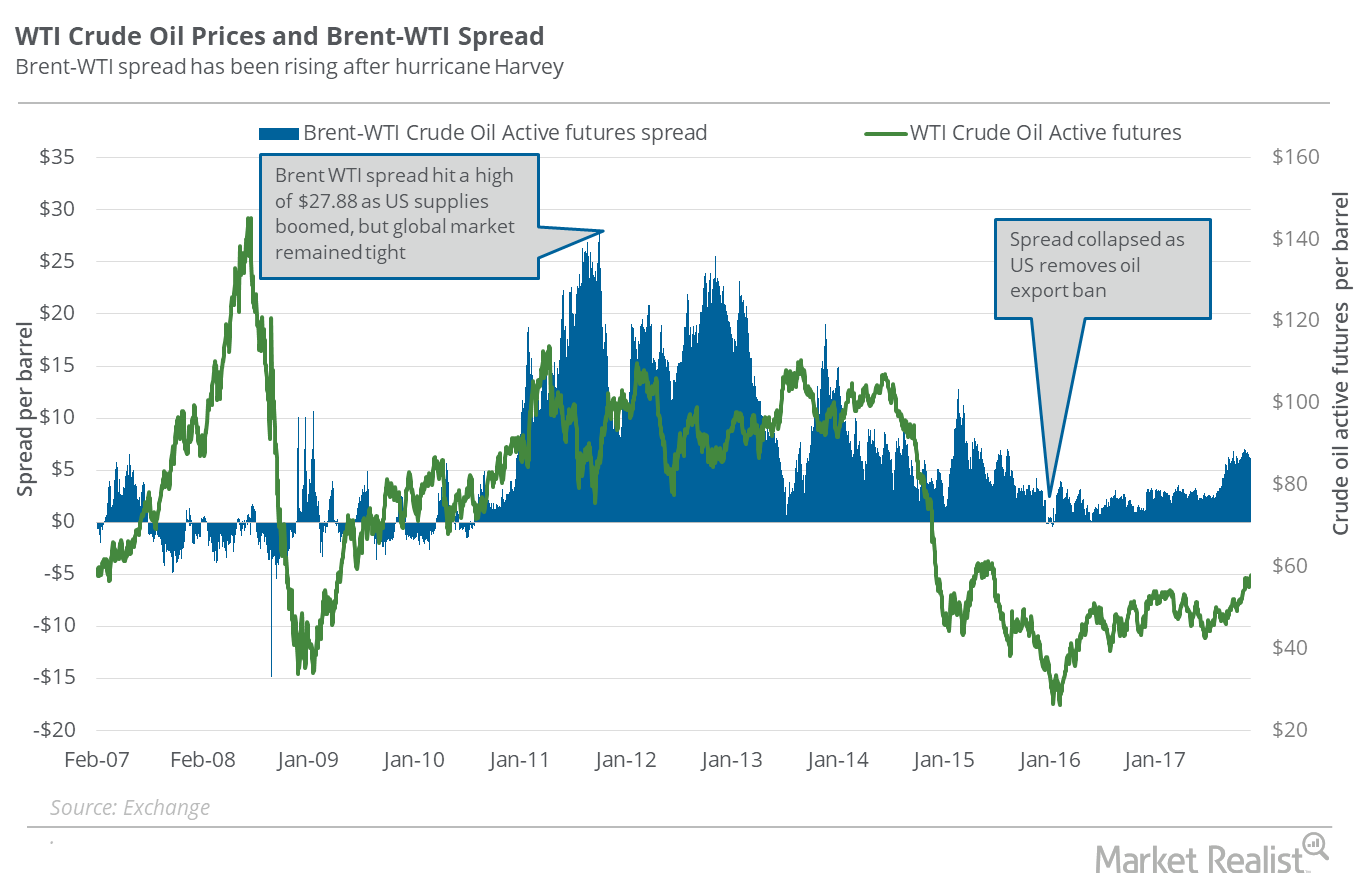
Is WTI Crude Oil Outdoing Brent?
On November 21, Brent crude oil (BNO) active futures closed $5.74 above US crude oil (USO)(UCO) active futures. In other words, the Brent-WTI (West Texas Intermediate) spread was $5.74.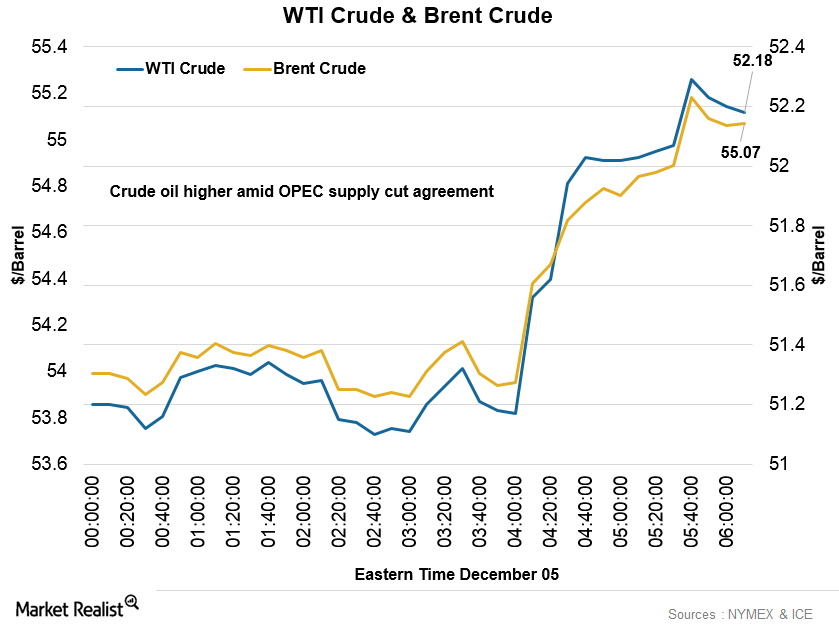
Why Did Crude Oil Prices Hit a 16-Month High?
At 5:45 AM EST on December 5, the WTI crude oil futures contract for January 2017 delivery was trading at $52.18 per barrel—a rise of ~0.97%.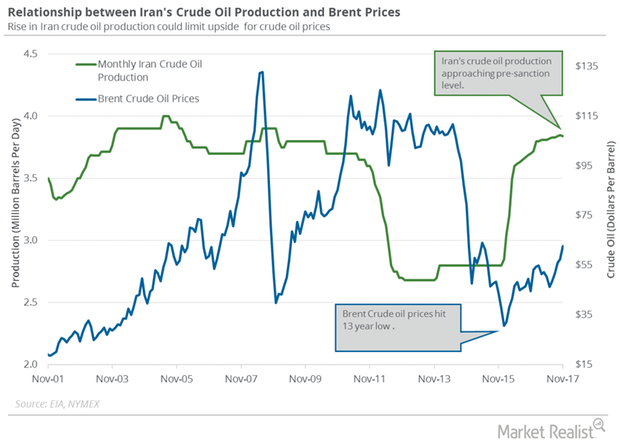
Will Crude Oil Futures and S&P 500 Move in the Same Direction?
February US crude oil (UWT) (USL) futures contracts rose 0.5% to $61.73 per barrel on January 8. Prices are near the highest level since December 2014.
WTI Crude Oil Is Rising Faster than Brent
On November 28, 2017, Brent crude oil (BNO) active futures closed at $5.62 higher than US WTI crude oil (USO) (UCO) active futures.Energy & Utilities Must-know: An overview of Athlon Energy
Athlon is an independent oil and gas exploration and production company. Its activities include the acquisition, exploration, and development of oil and liquids-heavy gas resources in the Permian Basin.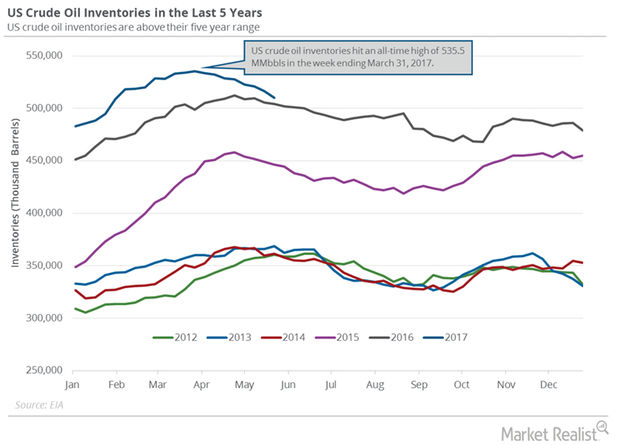
US Crude Oil Inventories: Lower than the Market’s Expectation
The EIA reported that US crude oil inventories fell by 6.4 MMbbls (million barrels) to 509.9 MMbbls on May 19–26, 2017.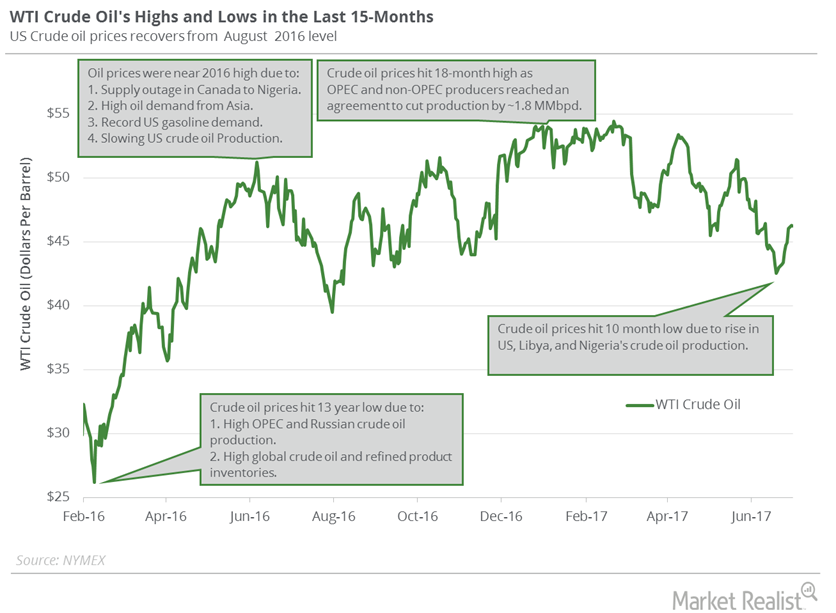
Geopolitical Tension Could Drive Brent and US Crude Oil Futures
Brent crude oil futures fell 0.7% to $49.61 per barrel on July 4, 2017. August WTI crude oil (XLE) (XOP) (PXI) futures contracts rose in electronic trading.
Will the EIA’s Crude Oil Inventories Support Crude Oil Bulls?
On April 18, 2017, the API released its weekly crude oil inventory report. It reported that US crude oil inventories fell by 0.84 MMbbls from April 7–14.
Brent Is Outperforming WTI Crude Oil
On December 11, 2017, Brent crude oil (BNO) active futures settled $6.7 more than WTI (West Texas Intermediate) crude oil (USO) (UCO) active futures.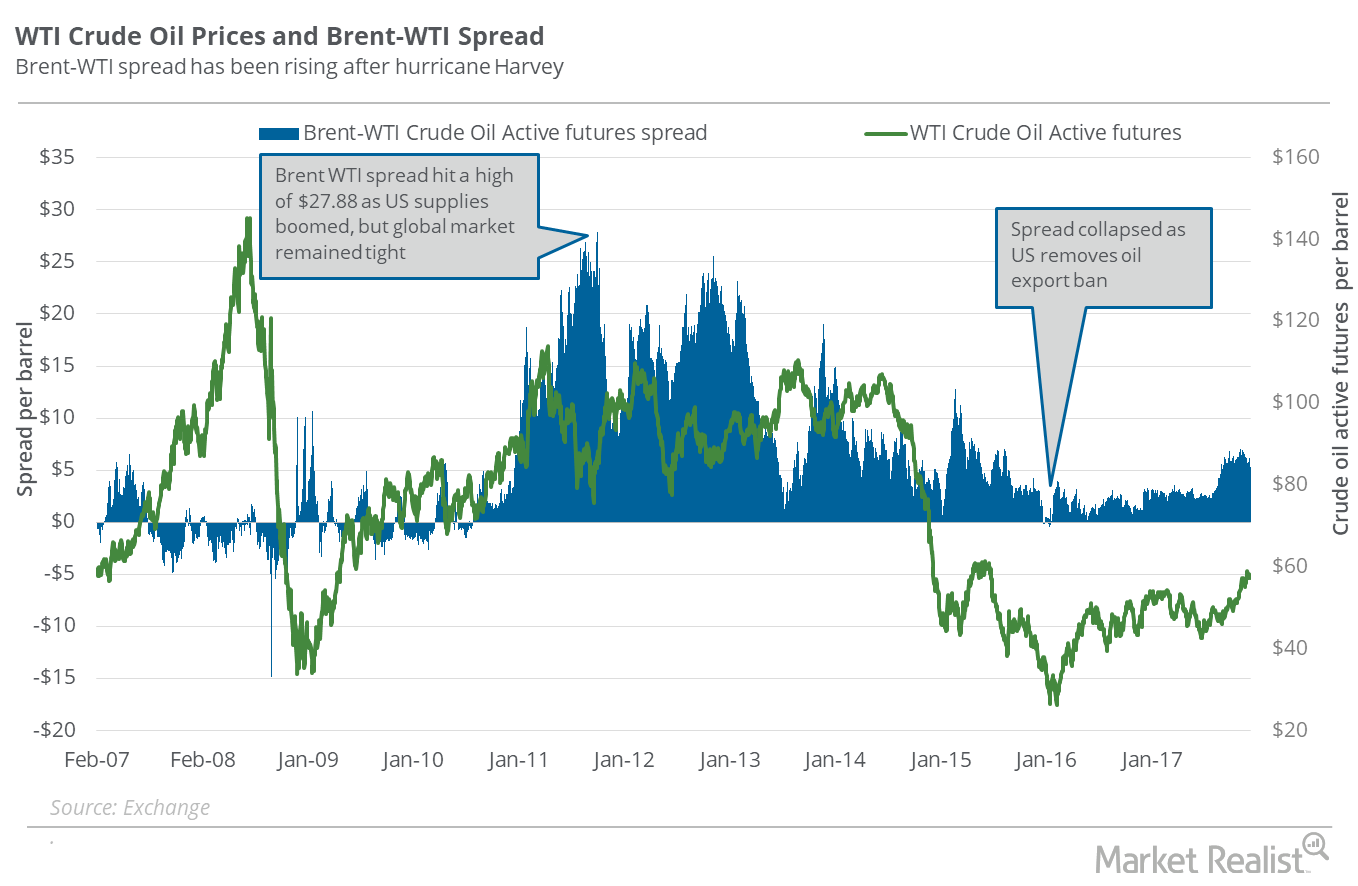
Oil Traders Should Watch US Oil Exports
On December 5, 2017, Brent crude oil (BNO) active futures were priced $5.24 higher compared to WTI crude oil (USO) (UCO) active futures.
US Crude Oil Inventories Fell below the 5-Year Average
The EIA reported that US crude oil inventories fell by 7.2 MMbbls to 483.4 MMbbls on July 14–21, 2017. Inventories fell below the five-year range.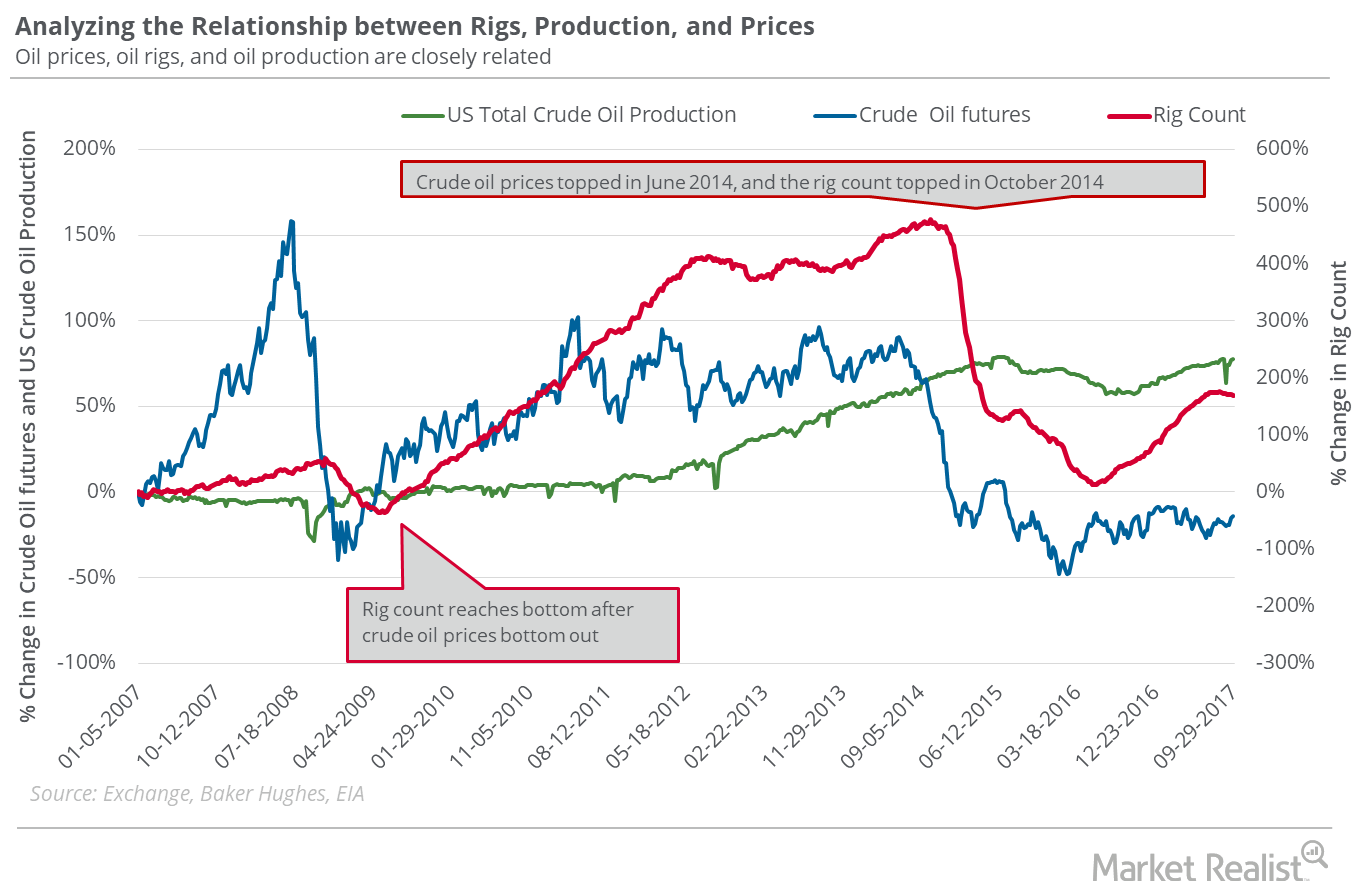
Futures Spread: Does It Signal End of Oil’s Oversupply Concern?
On October 17, 2017, US crude oil (USO) (OIIL) December 2018 futures traded $0.46 below the December 2017 futures.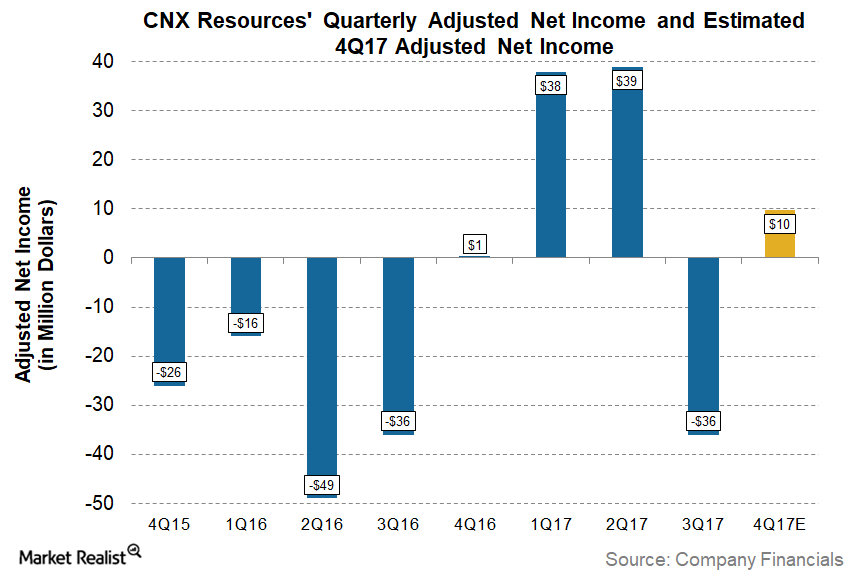
Can CNX Resources Report Higher Profits in 4Q17?
CNX Resources (CNX) is set to report its 4Q17 and 2017 earnings on February 6, 2018, before the market opens. CNX is expected to report 1,000% higher profits YoY than 4Q16.
Dover Fluids: A Brief Overview
Dover Corporation’s (DOV) Fluids businesses include the Pump Solutions Group (or PSG), which provides pumping solutions to several end markets.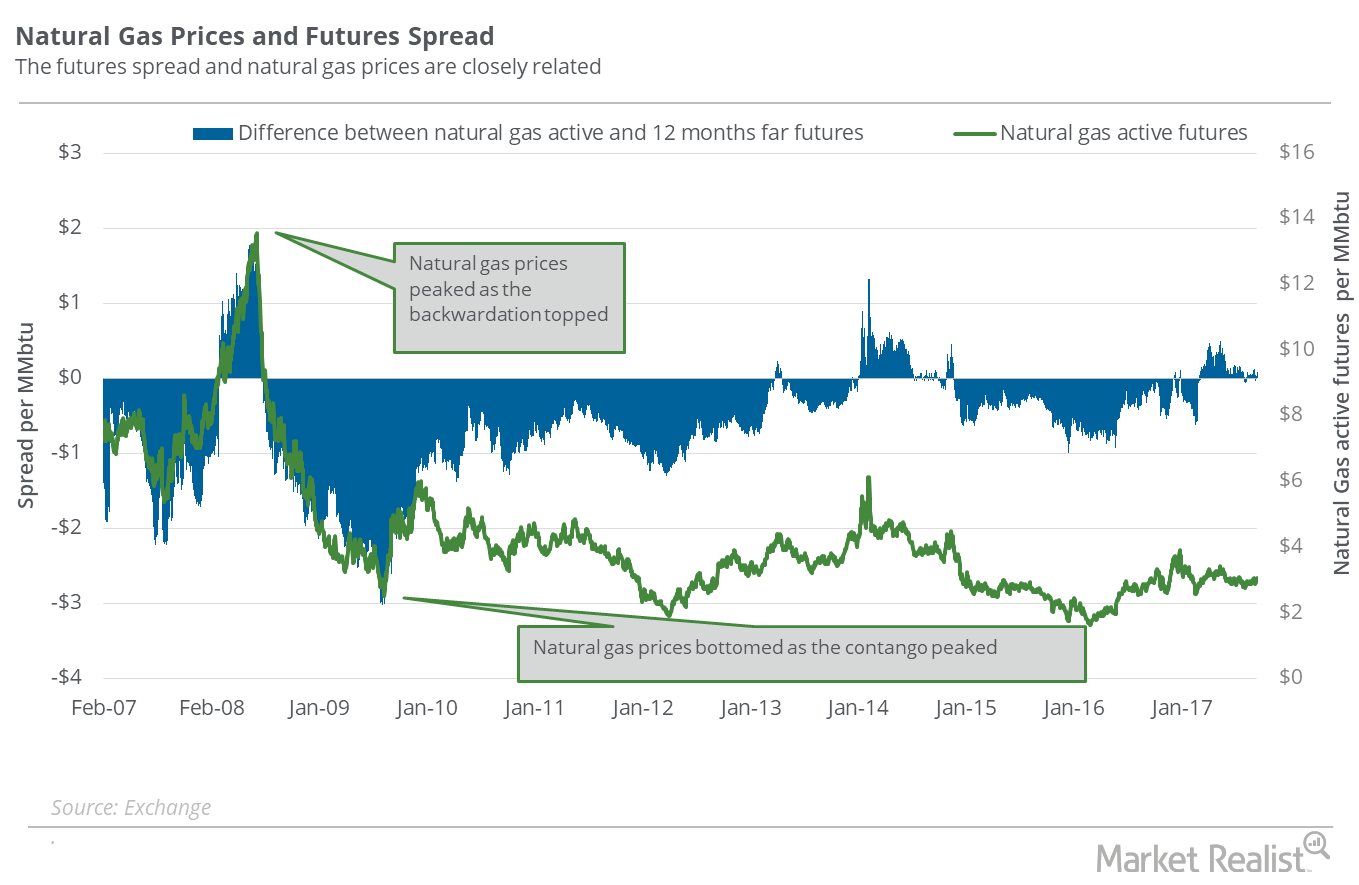
What the Natural Gas Futures Spread Tells Us about the Current Sentiment
On September 6, 2017, the futures spread was at a discount of $0.06, but on September 8, 2017, the futures spread shifted to a premium.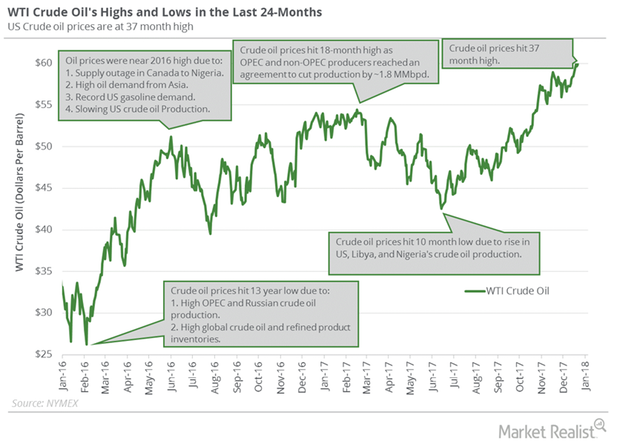
Will Crude Oil Futures Rise or Fall This Week?
WTI crude oil (SCO) futures settled at $64.30 per barrel on January 12, 2018—the highest level since December 2014.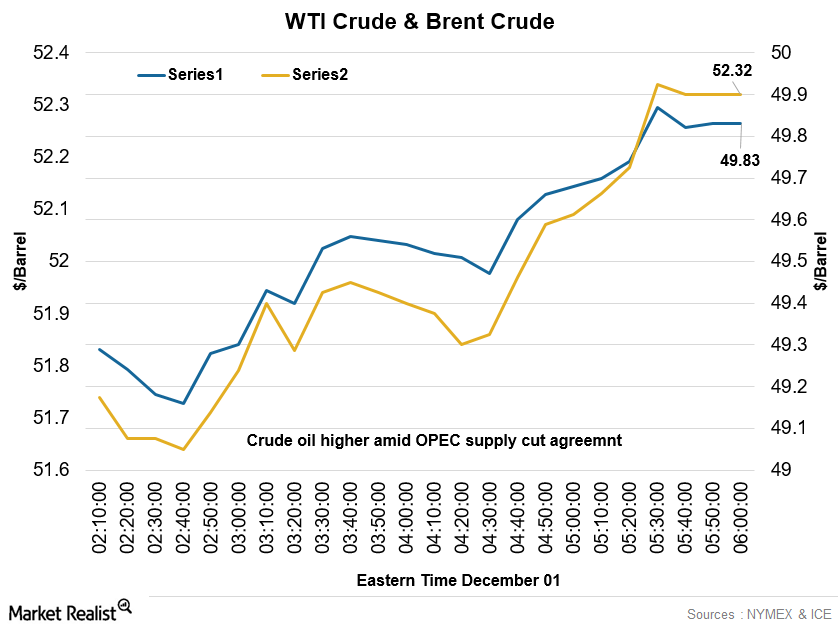
Crude Oil Continued to Rise, OPEC Agreed to the Supply Cut
At 5:45 AM EST, the WTI crude oil futures contract for January 2017 delivery was trading at $49.88 per barrel—a rise of ~0.89%.
Comparing WTI’s and Brent’s Performance
The Brent-WTI spread On December 18, 2017, Brent crude oil (BNO) active futures’ premium to WTI (West Texas Intermediate) crude oil (USO) (UCO) active futures was $6.30. On December 11, 2017, the Brent-WTI spread was $6.70. On December 11, 2017, the shutdown of the Forties Pipeline System boosted Brent oil prices. That day, the spread expanded […]
US Crude Oil Exports: Will They Affect OPEC’s Production Cut Deal?
On November 7, 2017, the difference between Brent crude oil (BNO) active futures and US crude oil (USO) active futures, or the Brent-WTI (West Texas Intermediate) spread, was $6.50.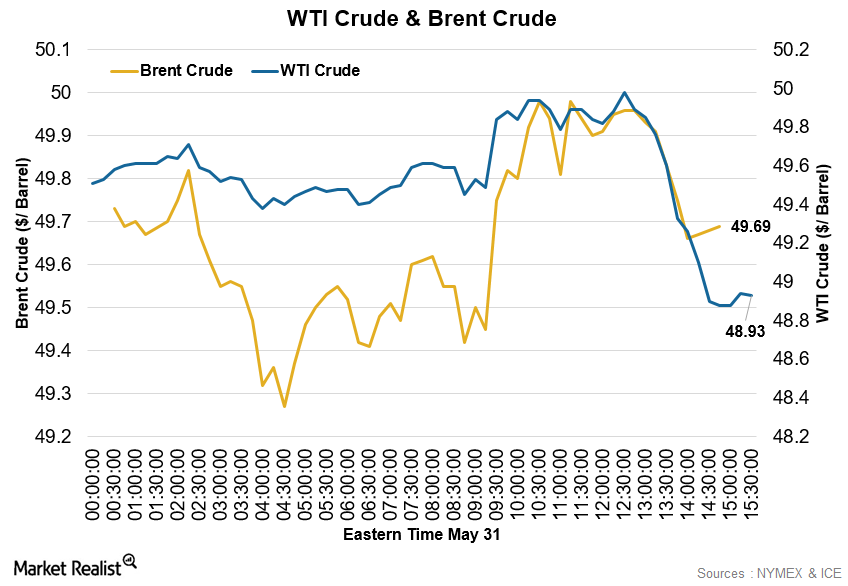
How Did Crude Oil Perform on Tuesday, May 31?
Crude oil had a volatile trading day on Tuesday, May 31, 2016. At 1:40 PM EDT, WTI crude for July delivery traded at $49.67 per barrel, a gain of 0.67%.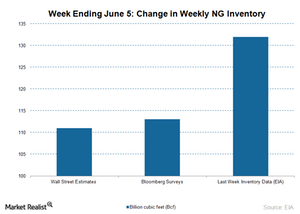
Natural Gas Prices Could Overshadow the Increasing Stockpile Data
The EIA will publish the weekly natural gas in storage report on June 11. US commercial natural gas inventories rose by 132 Bcf for the week ending May 29.
Why Elliott Management Might Be in Trouble
Last week, Elliott Management filed its 13F for the first quarter of 2020. In the last quarter, the hedge fund’s AUM was worth around $73.15 billion.Financials Technical indicators and the Relative Strength Index
The Real Strength Index (or RSI) is a measure of a stock’s overbought and oversold position. The commonly used RSI is a 14-day RSI. It refers to the 14-day stock price that’s used to calculate the RSI.Financials Why the inverted head and shoulder pattern is formed
The inverted head and shoulder pattern is the reverse of the head and shoulder pattern. It’s formed at the bottom of the downtrend.