Schlumberger by Implication: Reading Implied Volatility
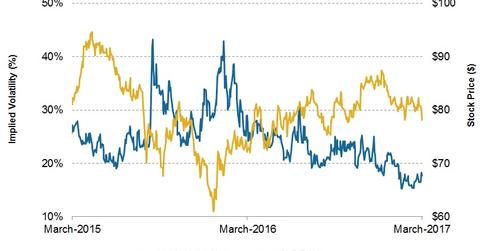
On March 10, 2017, Schlumberger’s (SLB) implied volatility was 17.7%, having fallen from 19% since its 4Q16 financial results were announced on January 20.
Nov. 20 2020, Updated 12:42 p.m. ET

Schlumberger’s IV
IV (implied volatility) reflects investors’ views of a stock’s potential movement. However, IV does not forecast direction. IV is derived from an option pricing model. Investors should note that the correctness of prices suggested by implied volatility can be uncertain.
On March 10, 2017, Schlumberger’s (SLB) implied volatility was 17.7%. Since it announced its 4Q16 financial results on January 20, Schlumberger’s implied volatility has fallen from 19% to its current level. SLB makes up 3.8% of the SPDR S&P Oil & Gas Equipment & Services ETF (XES). For details on Schlumberger’s performance in 4Q16, please see Market Realist’s Why Did Schlumberger’s 4Q16 Earnings Beat Estimates?
Implied volatility for SLB’s peers
Helmerich & Payne’s (HP) implied volatility on March 10 was ~30%, while Helix Energy Solutions’ (HLX) implied volatility was ~57% on that day. TechnipFMC’s (FTI) implied volatility on March 3 was ~30%.
What does SLB’s implied volatility suggest?
Based on Schlumberger’s implied volatility, and assuming a normal distribution of stock prices and one standard deviation probability of 68.2%, SLB’s stock will likely close between $80.63 and $76.75 in the next seven days. SLB’s stock price was $78.69 on March 10, 2017.
In the next part, we’ll discuss what Schlumberger’s short interest suggests.
