Chevron Corp
Latest Chevron Corp News and Updates
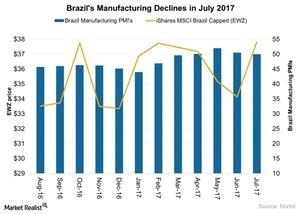
Why Manufacturing Activity in Brazil Is on a Decline
Manufacturing activity in Brazil In July 2017, the manufacturing PMI (purchasing managers’ index) in Brazil (BRZU) continued to decline, falling to 50 from 50.5 in June 2017. July 2017 brought a slowdown in both output and new business. US companies doing business in Brazil include Walmart (WMT), ExxonMobil (XOM), Chevron (CVX), and Apple (AAPL). Brazil (EWZ) […]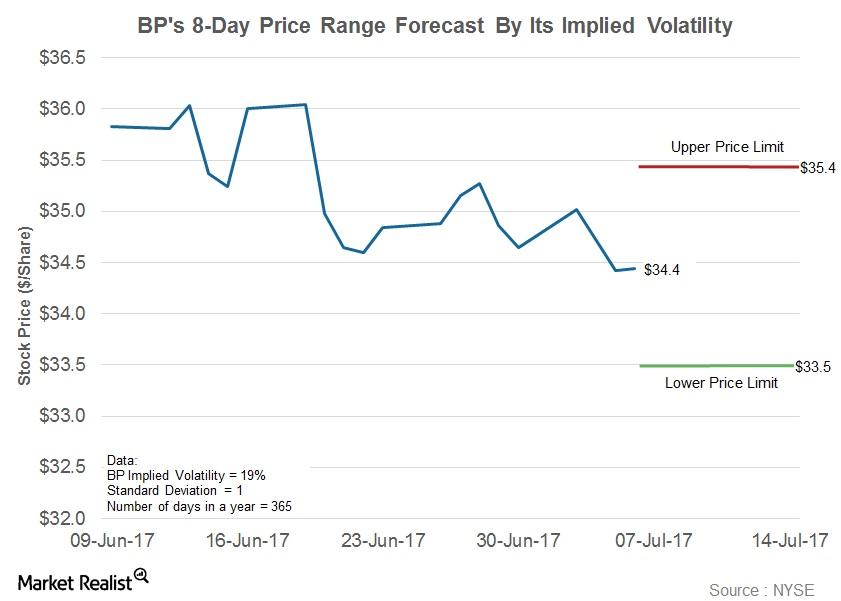
Estimating BP’s Stock Price Using Implied Volatility
What is implied volatility? Volatility gauges changes in a stock’s return over a period. When estimated based on historical stock prices, it is called historical volatility. We can estimate the future volatility, or implied volatility, of security using an option pricing model. A high implied volatility would indicate that a stock price is expected to move […]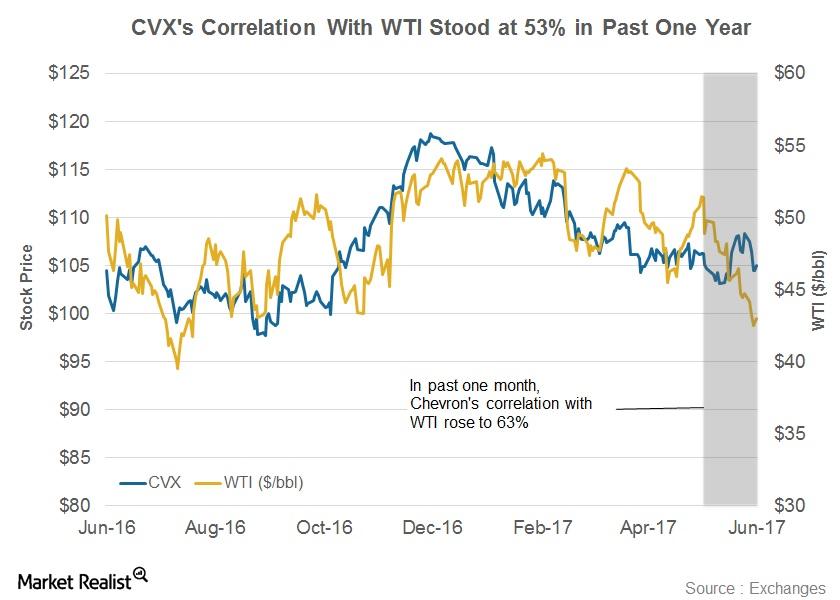
Correlation of Chevron Stock with WTI Crude Oil
The correlation coefficient of Chevron (CVX) versus WTI stood at 0.53 in the last one-year period.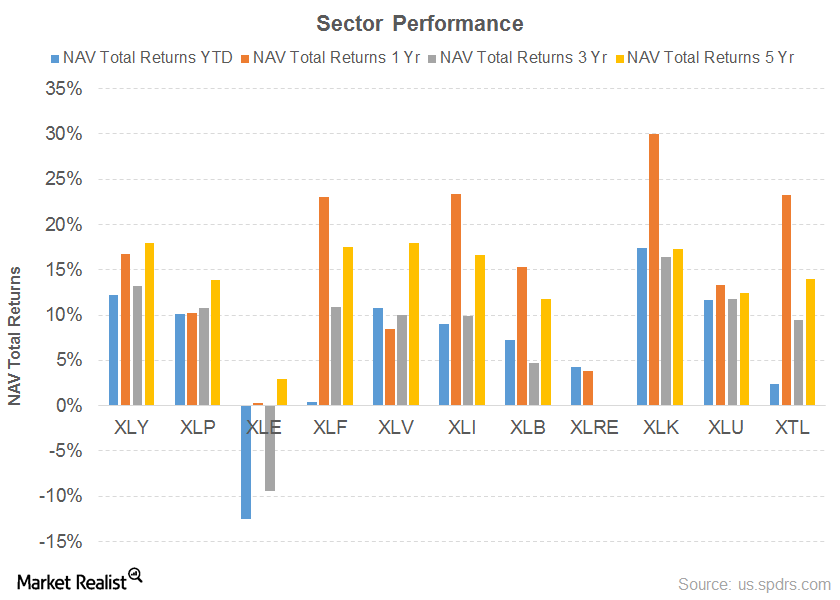
How Are the Defensive and Cyclical Sectors Performing?
If we compare the performances of the defensive sectors, we can see that their YTD performance and one-year performances have been reasonably uniform with the exception of the energy and telecom sectors.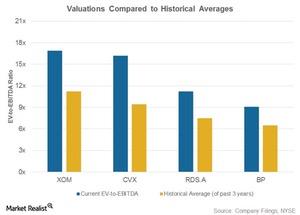
Energy Stock Valuations and Their Historical Averages
EV-to-EBITDA multiples in 1Q17 for ExxonMobil (XOM), Chevron (CVX), Royal Dutch Shell (RDS.A), and BP (BP) were above their historical averages.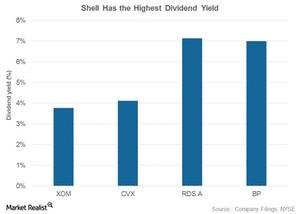
Who Has Higher Dividend Yields: RDS.A, XOM, CVX, or BP?
Shell has the highest dividend yield of 7.1% among the integrated energy stocks we’re covering in this series.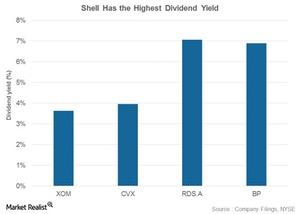
Inside Integrated Energy’s Dividend Yields: Comparing XOM, CVX, RDS.A, and BP
ExxonMobil (XOM), Chevron (CVX), Royal Dutch Shell (RDS.A), and BP (BP) have consistently given returns to shareholders in the form of dividends.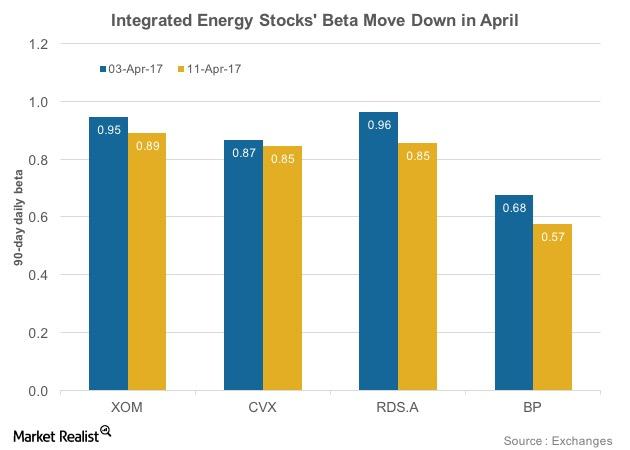
Understanding Integrated Energy Stocks’ Betas in April 2017
Royal Dutch Shell’s (RDS.A) 90-day daily beta fell from 0.96 on April 3, 2017, to 0.85 on April 11, 2017.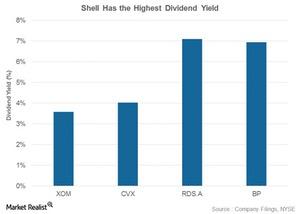
Integrated Energy Stocks: Who Stands Tall in Dividend Yield?
Shell’s dividend yield is 7.1%, the highest among the integrated energy stocks in this series.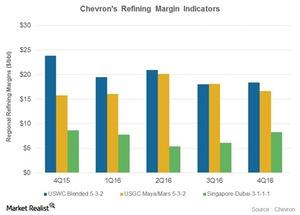
A Look at Chevron’s Refining Margin Trends
Chevron’s refining capacity Before we analyze Chevron’s (CVX) refining margin trends, le’s quickly look at its refining capacity. Chevron’s total refining capacity stands at 1.8 MMbpd (million barrels per day). Most of Chevron’s capacity, around ~1 MMbpd, is in the United States. In the international arena, Chevron has combined refining capacity of 0.3 MMbpd in South […]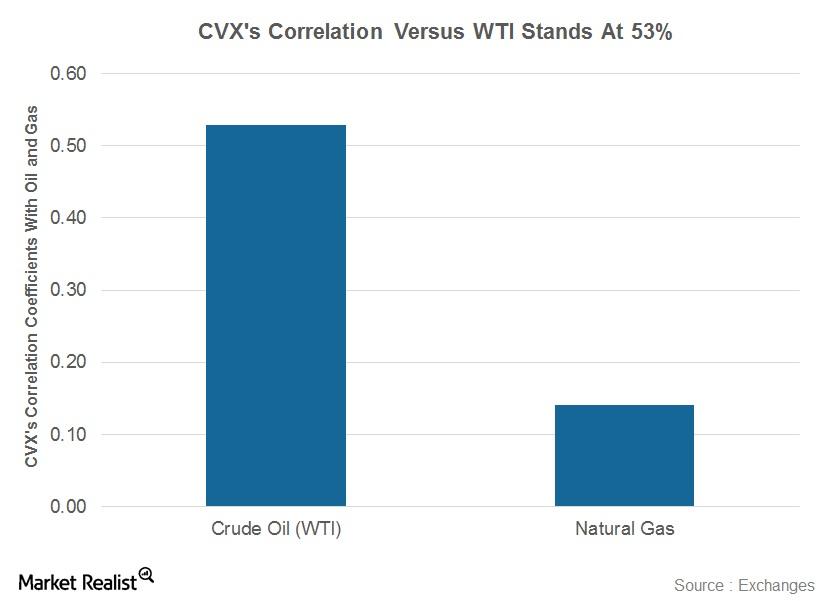
How Does Chevron’s Stock Correlate with Oil Prices?
Correlation coefficient In this series, we’ve analyzed Chevron’s (CVX) Mafumeira Sul project, stock movement, dividend yield, PEG (price-to-earnings-to-growth), ratio, beta, short interest, implied volatility, institutional holdings, and valuation. In this part, we’ll see how Chevron’s stock correlates with oil prices. The correlation coefficient shows the relationship between two variables. A correlation coefficient value of zero […]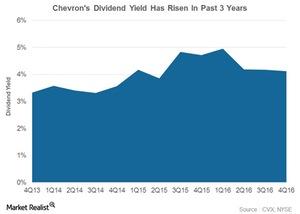
How Chevron’s Dividend Yield Has Trended
Chevron’s dividend yield Chevron (CVX) has consistently given returns to shareholders in the form of dividends. Therefore, we have evaluated its dividend yields. Yield is calculated as a ratio of the annualized dividend to stock price. Chevron’s dividend yield rose from 3.3% in 4Q13 to 4.1% in 4Q16, due to a dividend increase coupled with […]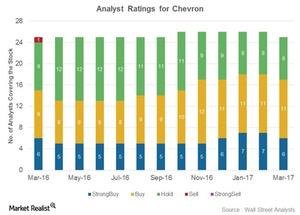
Why Most Analysts Rate Chevron a ‘Buy’
Analyst ratings for Chevron Chevron (CVX) has been rated by 25 analysts. Of the total, 17 analysts have given “buy” or “strong buy” ratings, eight have given “hold” ratings, and none have given “sell” or “strong sell” ratings on the stock. These ratings have improved from March 2016, when Chevron had fewer “buy” ratings, more […]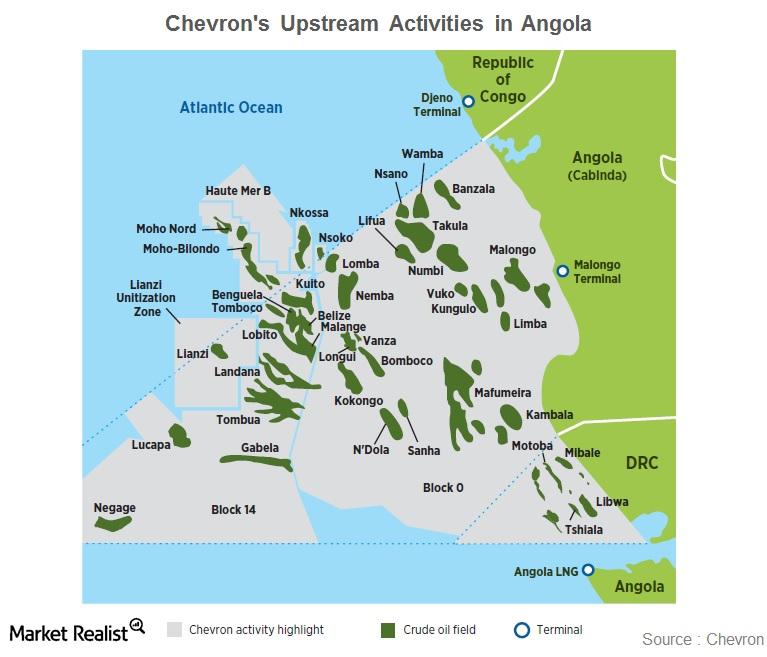
Chevron’s Mafumeira Sul Project Kick-Starts Production
In this series, we’ll provide updates on Chevron’s market performance. We’ll examine CVX’s latest stock performance, analyst ratings, dividend yield, PEG (price-to-earnings-to-growth) ratio, beta, short interest position, institutional ownership status, and implied volatility movement.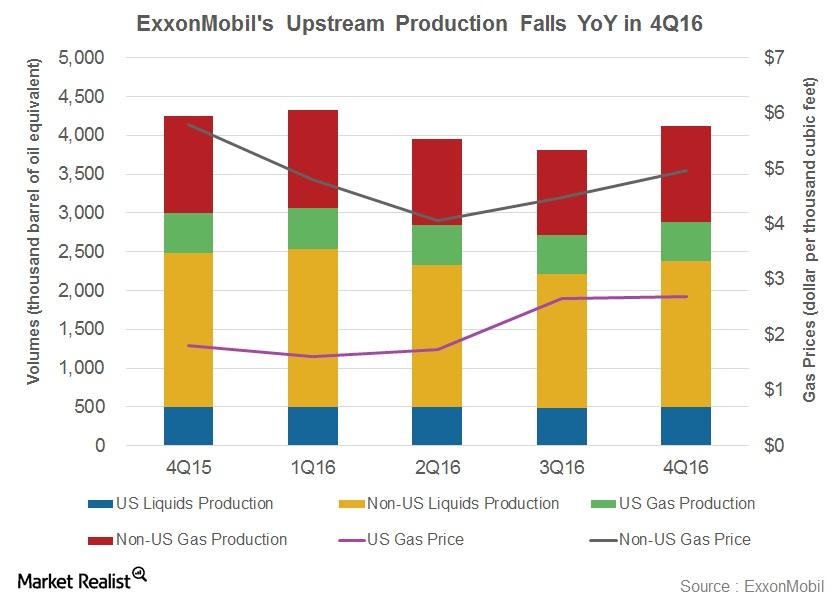
ExxonMobil’s Robust Upstream Portfolio: Poised for Growth
ExxonMobil (XOM) produced 4.1 MMboepd (million barrels of oil equivalent per day) from its worldwide operations in 4Q16.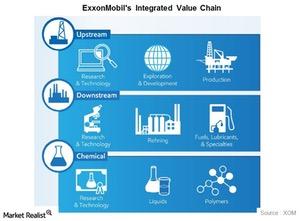
ExxonMobil Focuses on Integrated Growth, Reveals the Path Forward
In its latest analyst meeting, ExxonMobil (XOM) announced that it had plans to concentrate on an integrated earnings model, capturing value at every stage of the energy chain.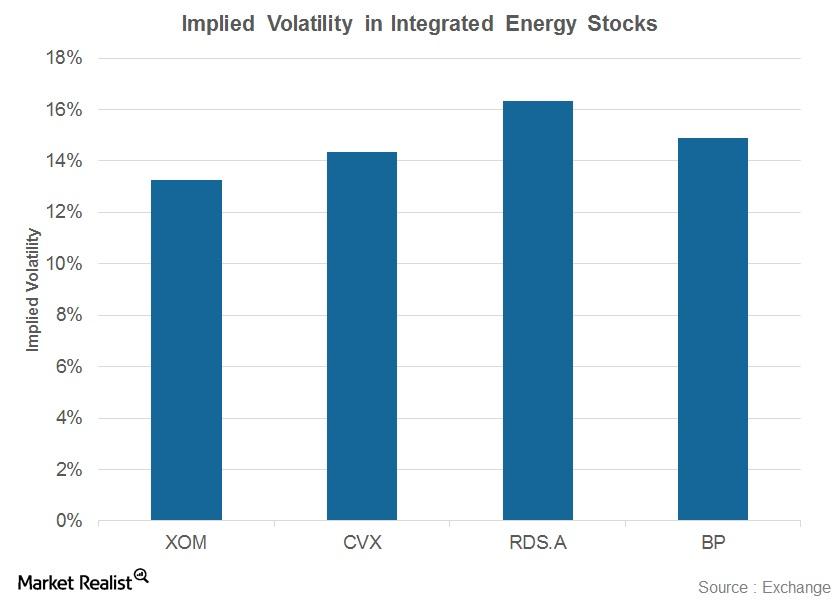
Where Do Implied Volatilities in Integrated Energy Stocks Stand?
Implied volatility in Royal Dutch Shell (RDS.A) currently stands at 16%, which is the highest compared to peers ExxonMobil (XOM), Chevron (CVX), and BP (BP).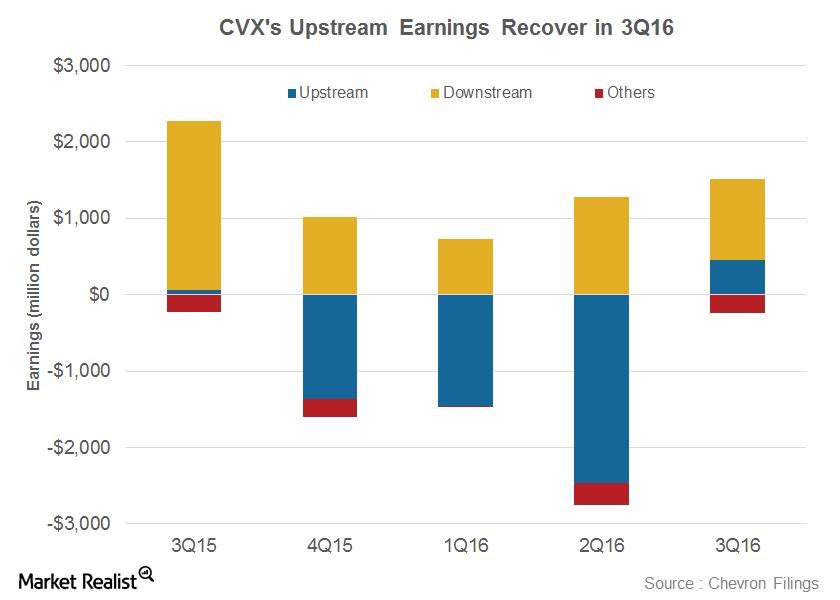
Chevron’s 4Q16 Segmental Outlook: Is It Positive?
Chevron’s (CVX) Downstream segment saw its earnings fall 52% YoY to ~$1.1 billion in 3Q16.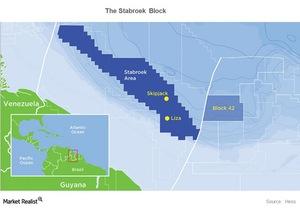
Once Again, ExxonMobil Discovers Oil in Guyana
ExxonMobil (XOM) has found oil in the Payara-1 Well in the Stabroek Block, positioned 120 miles offshore Guyana. This is the company’s second discovery in the block.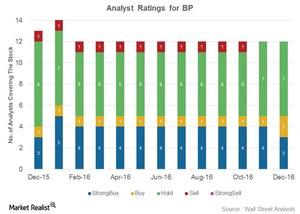
Why Do a Majority of Analysts Rate BP as a ‘Hold’?
BP (BP) plans to rebalance its sources and uses of cash by 2017 at an oil price level of $50–$55 per barrel.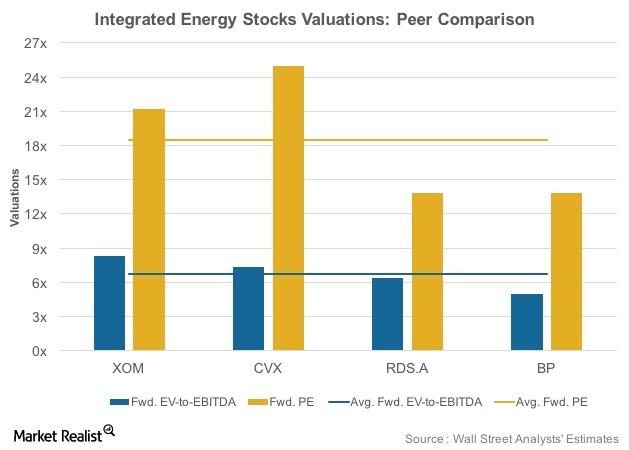
Integrated Energy Stocks’ Post-3Q16 Forward Valuations
XOM trades at 8.3x forward EV-to-EBITDA and 21.2x forward price-to-earnings, both above its peer averages.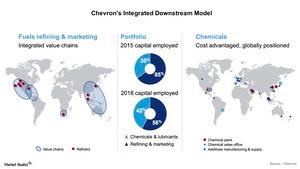
Chevron’s Downstream Value Chains: Is It the Focus Area?
Chevron (CVX) is focusing on expanding its high-return sectors like Petrochemicals, Additives, and Lubricants.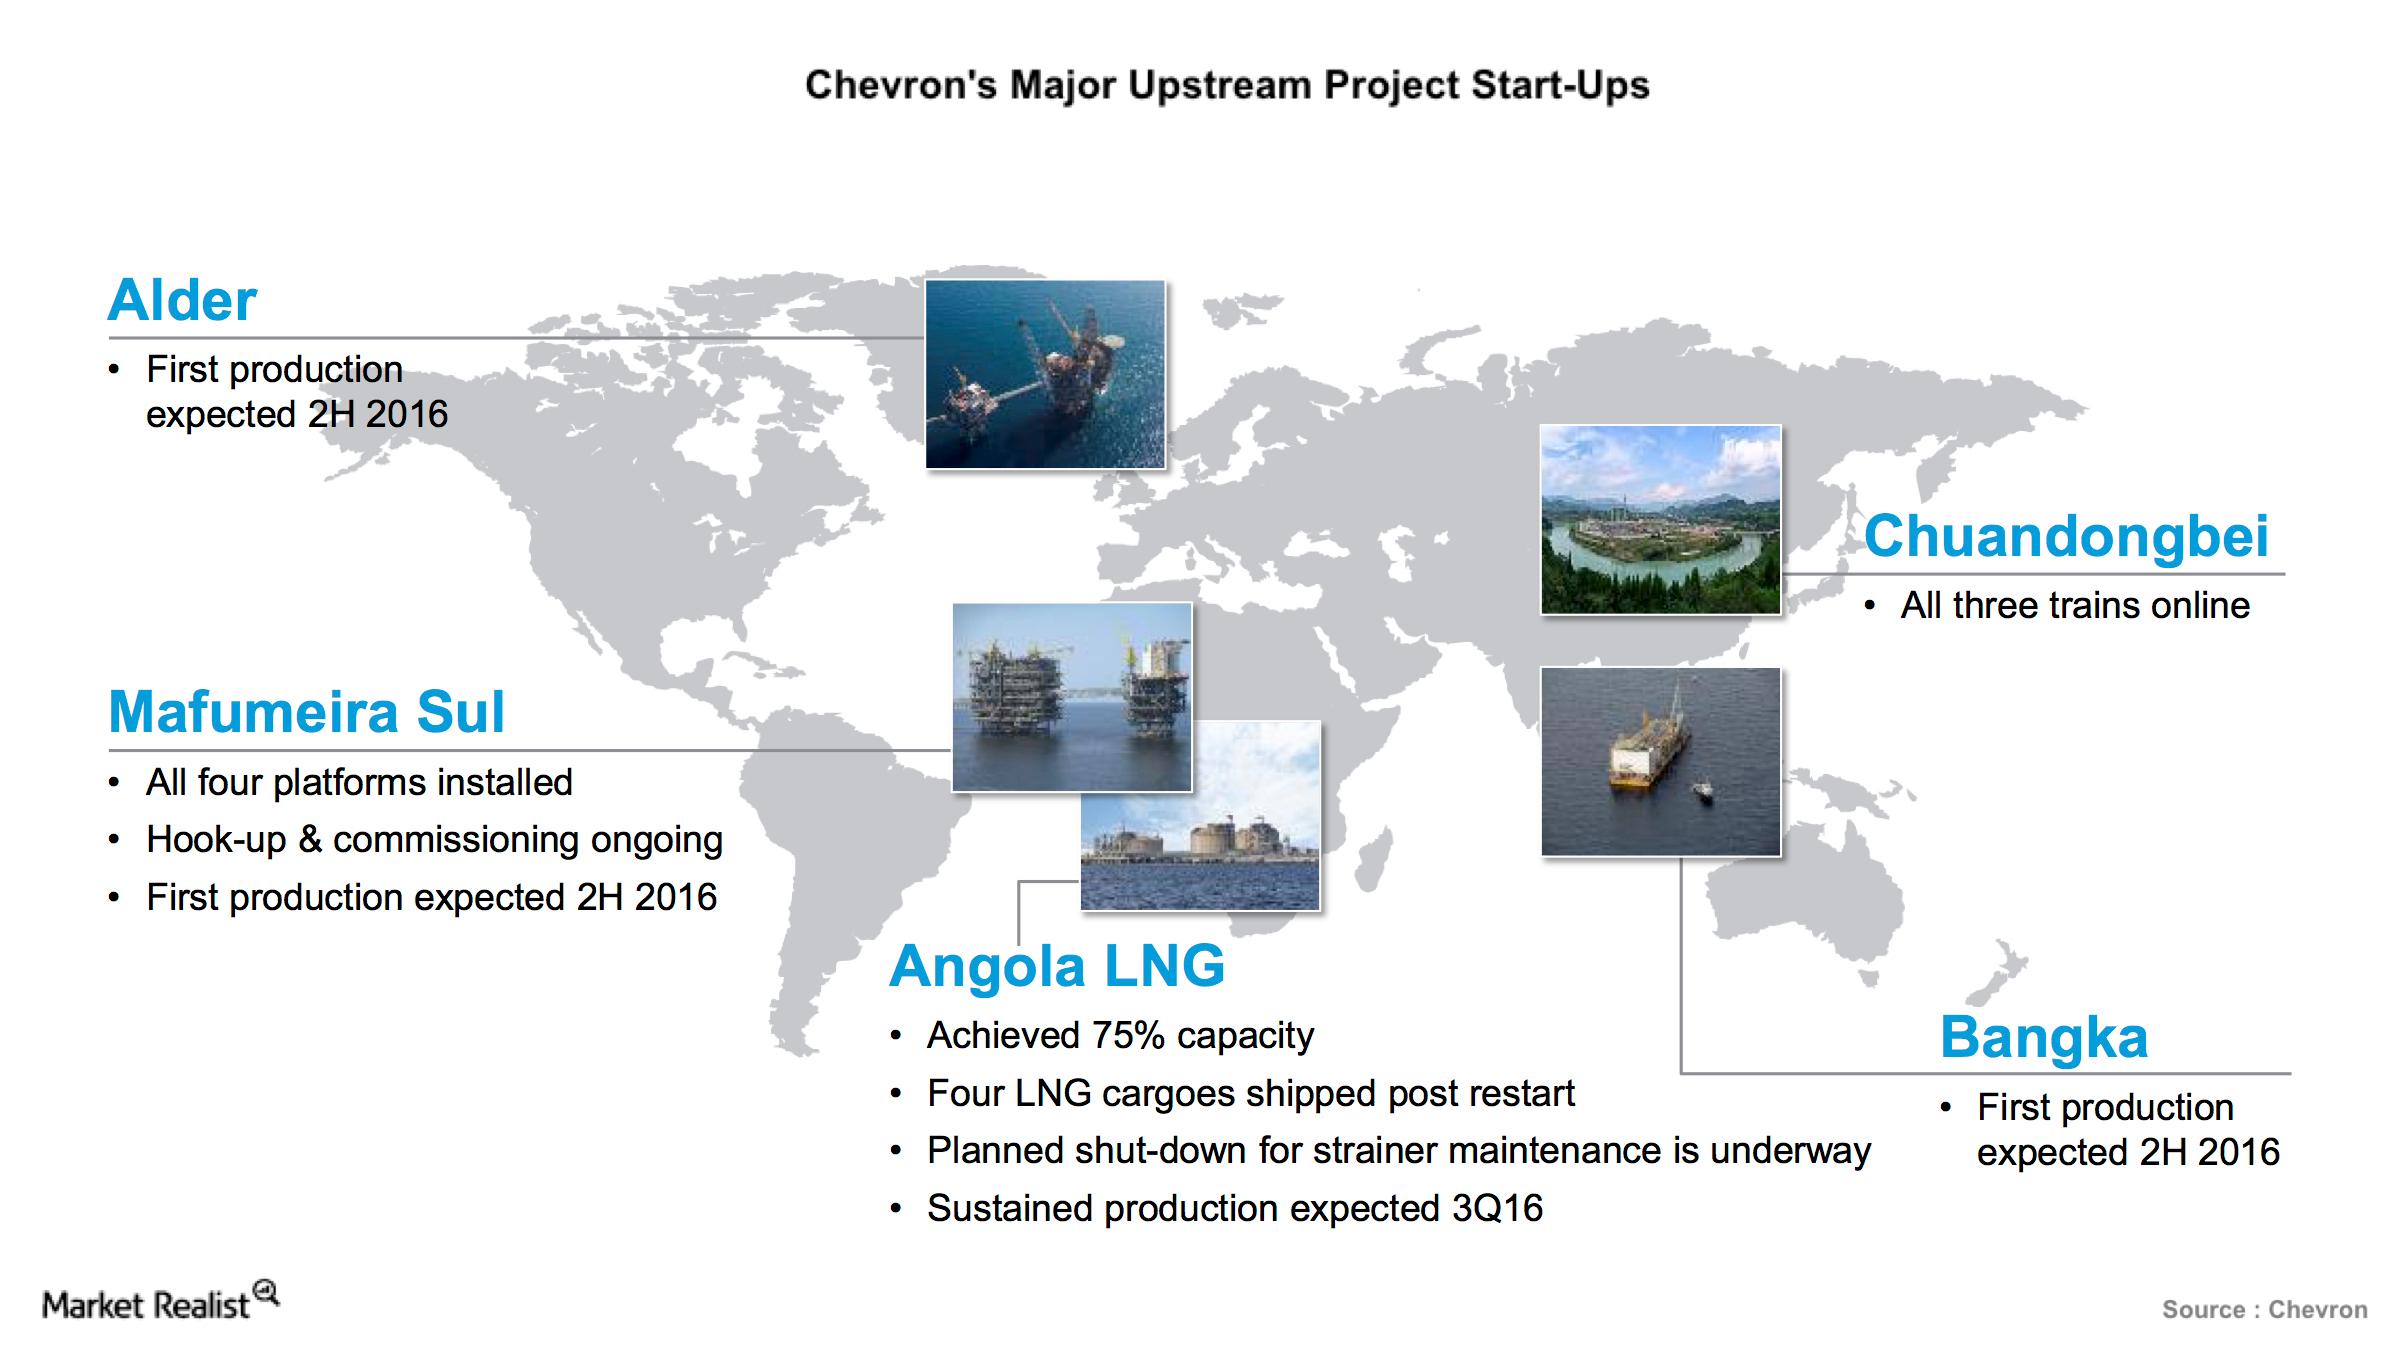
Chevron’s Upstream Portfolio: Major Projects to Start in 2016–2017
Chevron’s (CVX) Upstream segment production is poised to grow, with some of the major projects starting up in 2016–2017.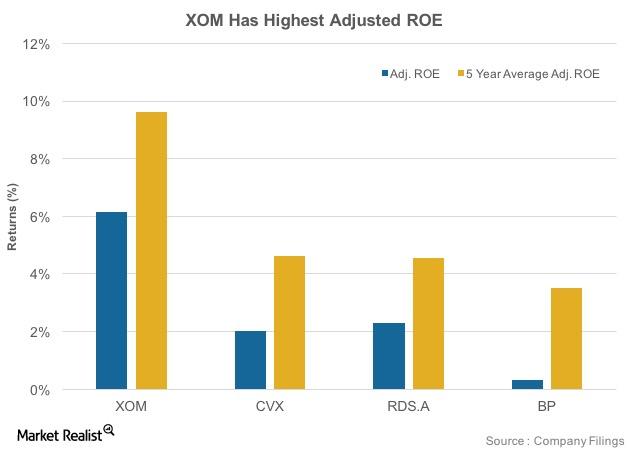
Look to This Energy Company for the Best ROE
Battered by falling oil prices, the 2Q16 ROE numbers for ExxonMobil (XOM), Chevron, Royal Dutch Shell, and BP were lower than their five-year average historical ROE figures.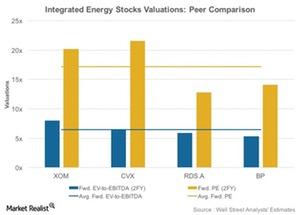
Looking 2 Years Out, Energy Stocks Trade at Respectable PEs
ExxonMobil (XOM) trades at an 8.1x EV-to-EBITDA multiple and a 20.2x price-to-earnings ratio, both above its peers’ averages.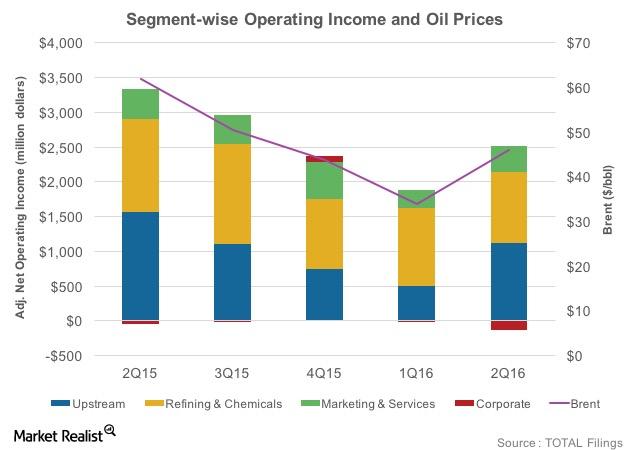
Total’s Segments: Upstream Earnings Plunge but Stay Positive
Changing oil prices have changed the dynamics for Total’s segments. Although upstream earnings have declined in 2Q16 YoY, they stayed positive in the quarter.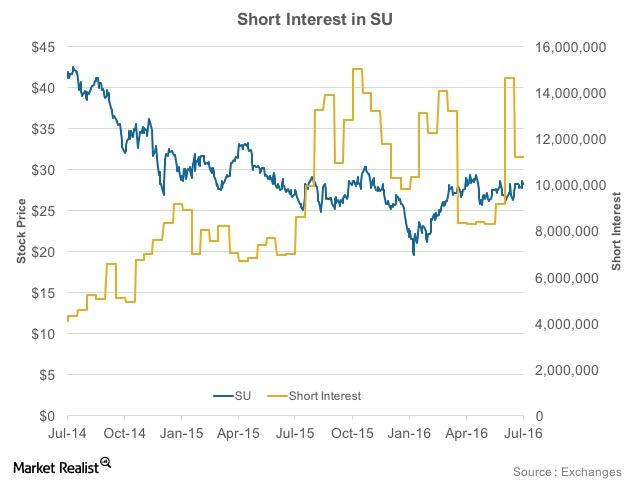
What Does Suncor’s Short Interest Analysis Reveal?
Suncor Energy (SU) has witnessed a 34% rise in its short interest since April 2016.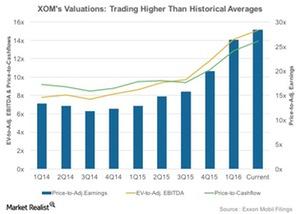
Why ExxonMobil’s Valuations Are Higher Than Historical Averages
ExxonMobil’s price-to-earnings (or PE) ratio has generally shown an uptrend in the past two years. In 1Q16, the stock traded at a PE of 26.4x.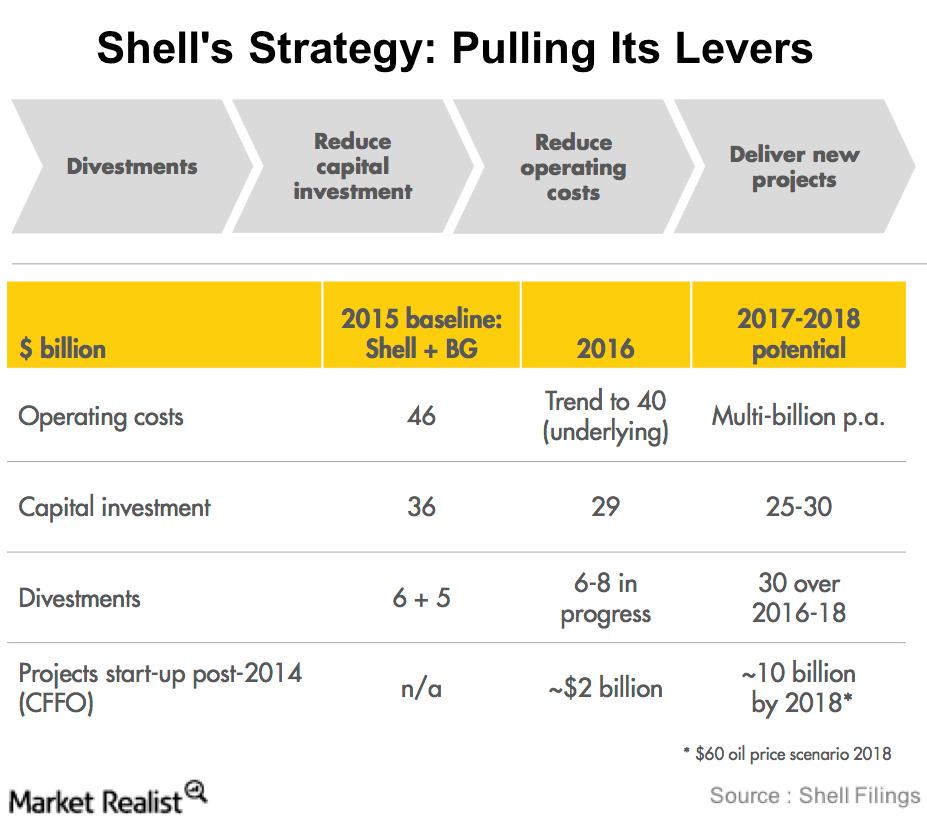
Shell’s Strategy: Pulling Its Levers
Shell plans to restructure itself to become more resilient to lower oil prices and more focused in terms of assets. To do this, it plans to use four levers.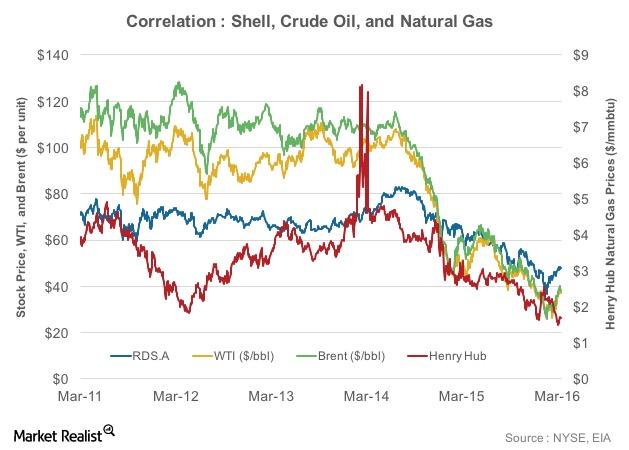
Correlation Analysis: Shell and Oil Price
Shell’s stock price has largely moved in-line with crude oil prices. This is reflected in the results of a correlation test.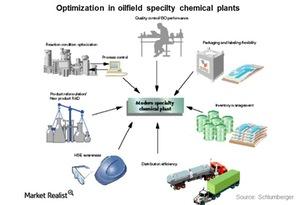
The Importance of Specialty Chemicals in the Oil Industry
Specialty oilfield chemicals are used in the oil and gas industry to improve well performance by making exploration and production more efficient.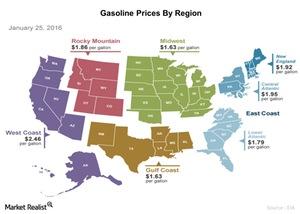
Why Are Gasoline Prices So High in the West Coast Region?
Gasoline prices in the West Coast region were at $2.45 per gallon on January 25, 2016—around $0.60 per gallon higher than the average US gasoline prices.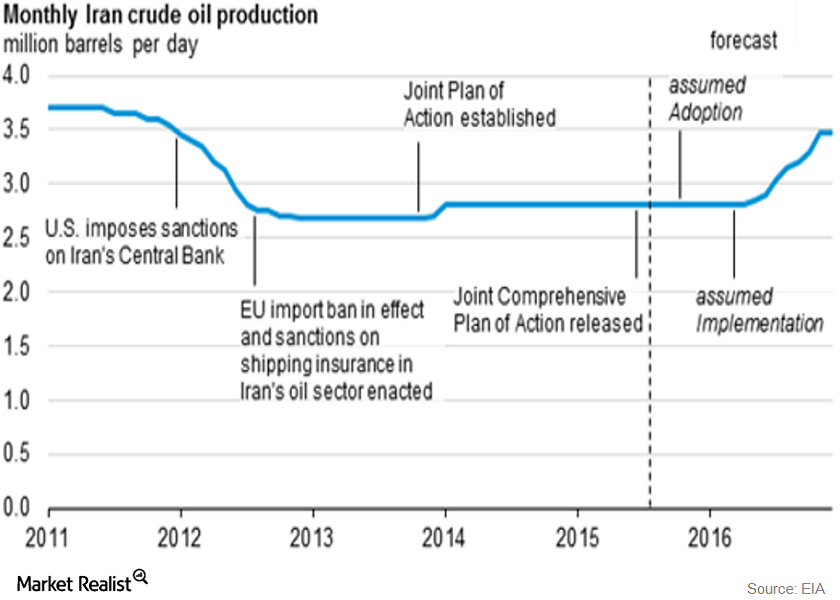
Iran’s Oil Sanctions Lifted: Brent Oil Prices Feel the Heat
Thus, Iran’s Western oil sanctions were lifted on Saturday, January 16, 2016. On Sunday, January 17, Iran stated that it would increase its crude oil production by 500,000 bpd (barrels per day) as soon as possible.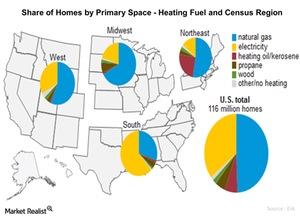
US Households Prefer Electricity and Natural Gas for Home Heating
Natural gas is used as heating fuel in 48% of the homes across the country, electricity is used for heat in 38% of homes, and the rest of the fuels are used for heat in the remaining 14% of homes.
Overview of BP’s Refining Segment and Margins
BP’s refining segment has 2.0 million barrels per day of refining capacity worldwide. In the United States, it has around 0.74 MMbpd of refining capacity.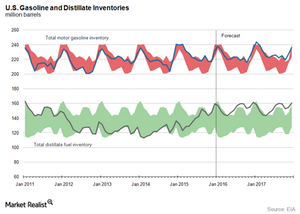
Gasoline and Distillate Inventories Overshadow Crude Oil Market
The EIA (U.S. Energy Information Administration) reported that the US gasoline inventory rose by 8.4 MMbbls to 240.4 MMbbls for the week ending January 8, 2016.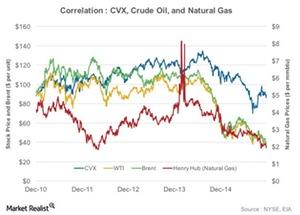
The Correlation of Chevron’s Stock to Oil and Natural Gas Prices
The integrated energy model provides Chevron’s insulation from oil and natural gas price volatility. This is reflected in the results of the correlation test.
Bearish Crude Oil Market Has Put $5 Trillion at Risk
The depressed energy market has erased just over $1 trillion of market capitalization from oil and gas companies around the globe.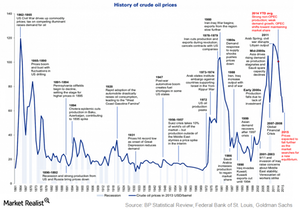
Why Roller Coaster Crude Oil Prices Are Nothing New
Crude oil prices like any other commodity are subject to changes based on the supply and demand dynamics.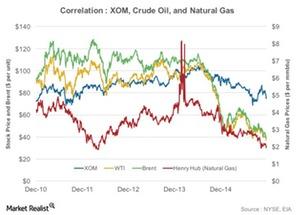
Correlation Analysis: ExxonMobil’s Crude Oil, Natural Gas prices
The correlation coefficients of ExxonMobil to Brent, West Texas Intermediate, and Henry Hub natural gas prices stand at 0.22, 0.35, and 0.36, respectively.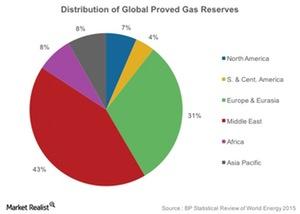
A Vital Resource: Which Region Has the Most Natural Gas Reserves?
Total global natural gas reserves stand at 6,606 trillion cubic feet, of which 43% are in the Middle East.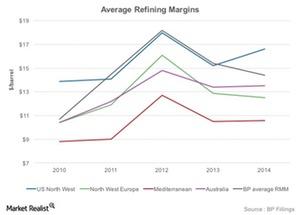
What Are the Key Indicators of Refining Profits?
Investors should track the GRM and crack spread of a region where a company’s refinery is located.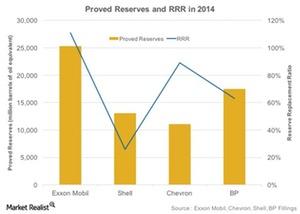
Why Is Reserve Replacement Ratio Important to the Upstream Sector?
RRR reflects how many barrels of oil equivalent the company adds to its reserves in replacement of ones that are produced.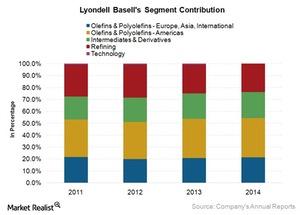
LyondellBasell: A Leading Manufacturer of Olefins and Polyolefins
LyondellBasell is one of the world’s leading producers of olefins and polyolefins. After Dow Chemical, LYB is the second largest company by revenue and EBITDA in the US.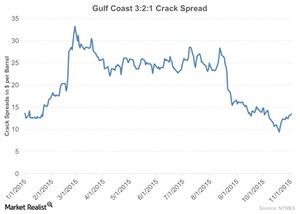
Wider Crack Spread: Its Impact on Refiners
The recent rise in the crack spread is driven by factors like low crude oil prices, a rise in demand for gasoline, and a sharp rise in demand for propane.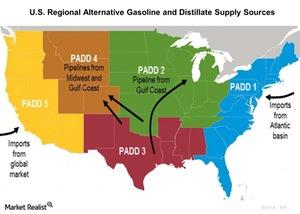
Can Outages Be Overcome by Alternate Sources of Gasoline Supply?
According to the EIA, since the Torrance outage, imported supplies of gasoline have been arriving in Southern California from all over the world.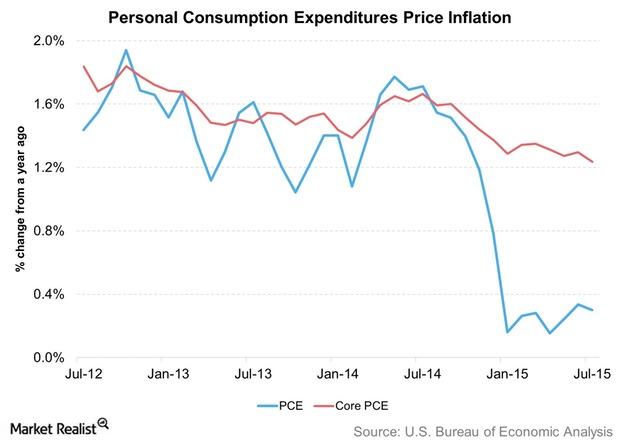
Import Prices and Crude Oil Keep US PCE Inflation Down
When the Fed refers to “inflation,” it’s talking about the rate of change in PCE (personal consumption expenditure) inflation. This is the price index for PCE.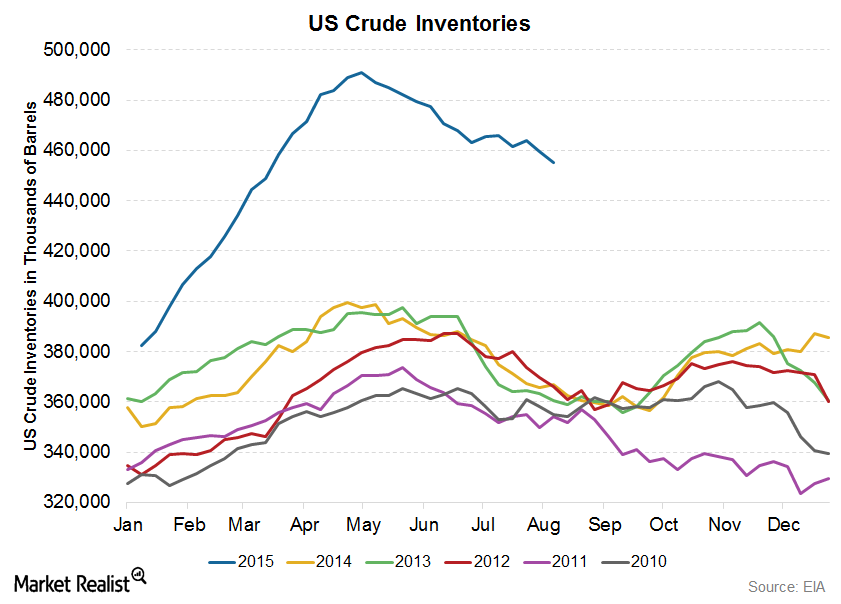
Crude Oil Inventories Fell, but Why Did WTI Crude Prices Slump?
The U.S. Energy Information Administration reported a decrease of 4.4 million barrels in crude oil inventories for the week ended July 31.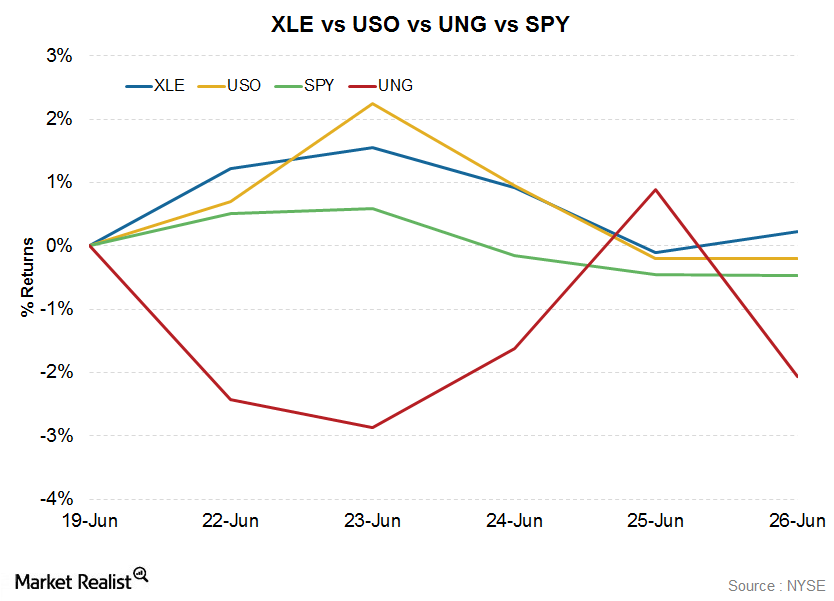
XLE Is Up Even as Commodity ETFs Track Energy Prices Lower
The Energy Select Sector SPDR ETF (XLE) rose 0.22% in the week to June 26. The ETF tracks a diverse group of ~45 of the largest US energy stocks.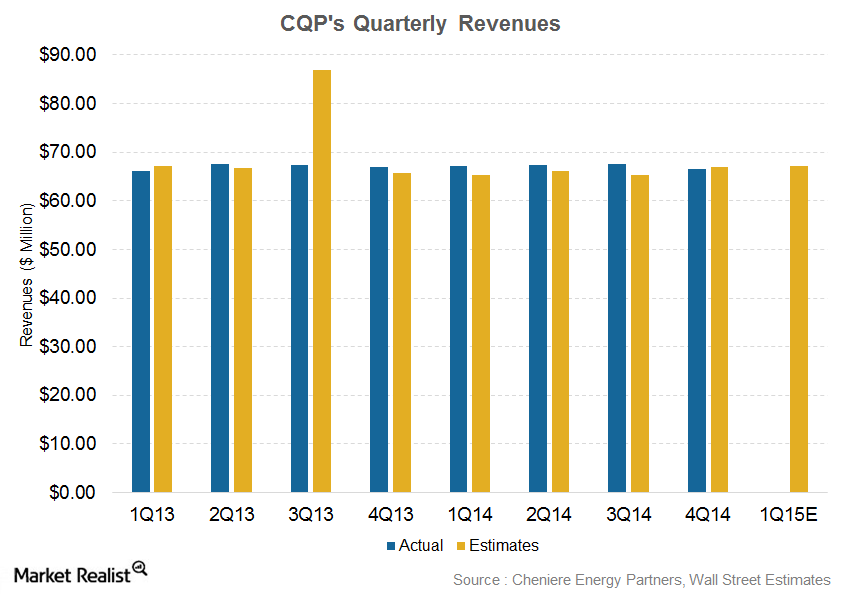
Analyzing Cheniere Energy Partners’ Historical Performance
For 1Q15, analysts are expecting Cheniere Energy Partners’ revenue to come in at $67.1 million. The loss per share estimates have been pegged at -$0.113.