United States Oil ETF
Latest United States Oil ETF News and Updates
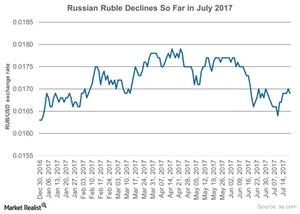
How Has the Ruble Performed in July 2017?
The Russian ruble (ERUS) tends to move in line with crude oil prices (USO) (UCO).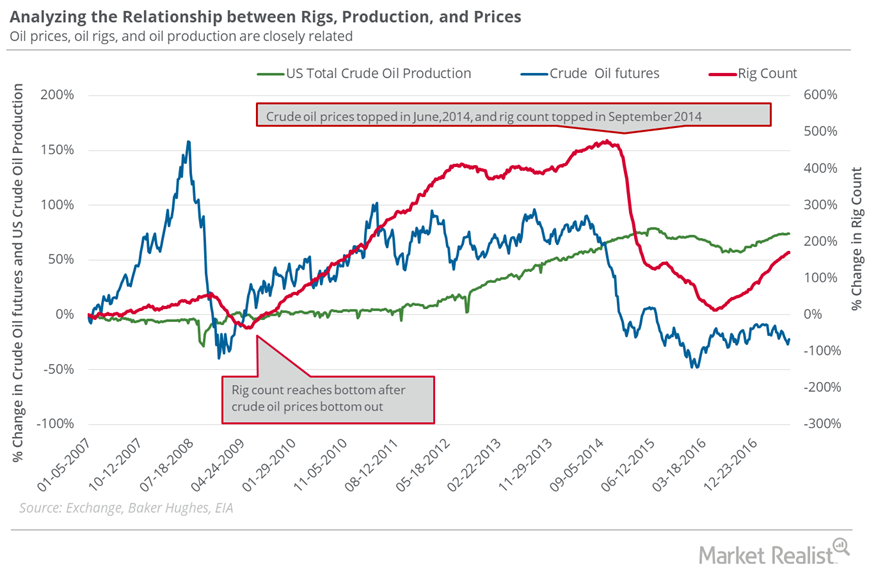
Oil Rigs: Oil Prices Could Make a U-Turn
The US oil rig count extended to 765 in the week ending July 14, 2017—a gain of two rigs compared to the previous week.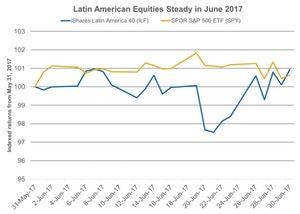
Performance of Latin American Equities Steady in June 2017
Latin American (ILF) equities in June 2017 remained steady amid the political turmoil among its member nations.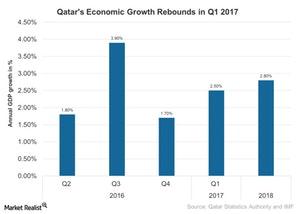
Understanding Qatar’s Resilience amid Sanctions
Qatar’s (QAT) economy continued to grow in 1Q17 amid improved oil prices since 2Q16. But more recently, oil prices have hit a downtrend.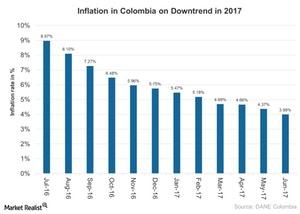
How Colombia’s Inflation Is Trending
Annual consumer inflation in Colombia (GXG) has dropped for 12 consecutive months as of June 2017.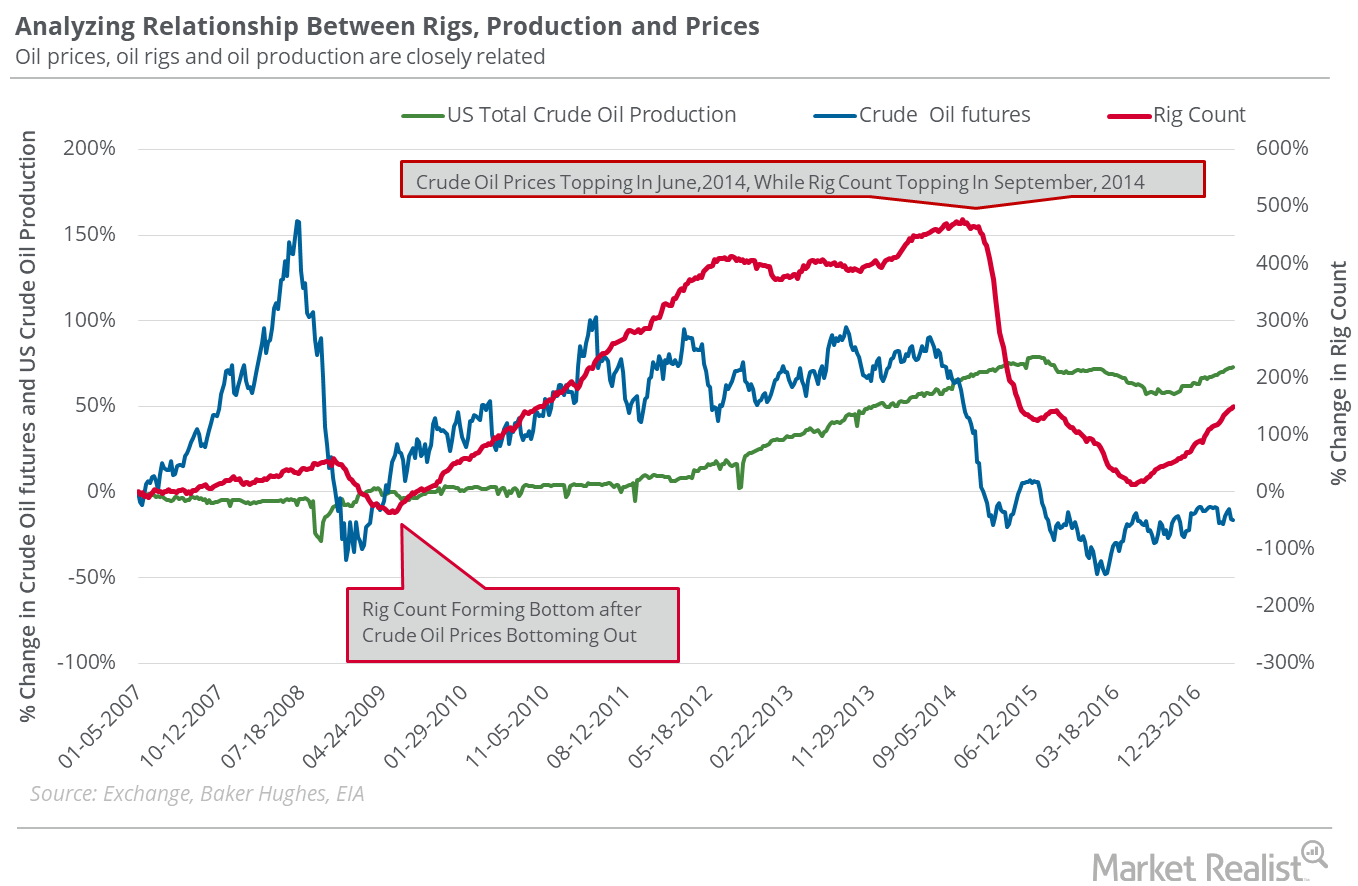
Oil Rigs: Will Oil Prices Rise More?
On June 23–June 30, the US oil rig count fell by two to 756. The fall was marginal, but it was the first fall after rising for 23 consecutive weeks.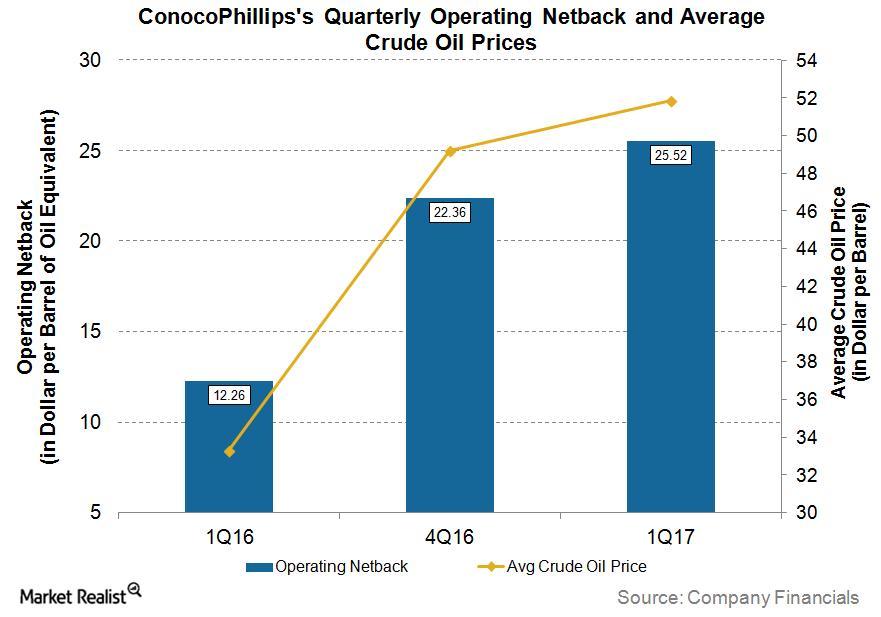
Chart in Focus: ConocoPhillips’s Operating Netback
What is the operating netback? The operating netback (also referred as production netback) is oil and gas revenue realized per boe (barrel of oil equivalent) after all costs to bring one boe to the market are subtracted from the realized price. The operating netback is derived by subtracting production expenses (or field operating expenses), production taxes, […]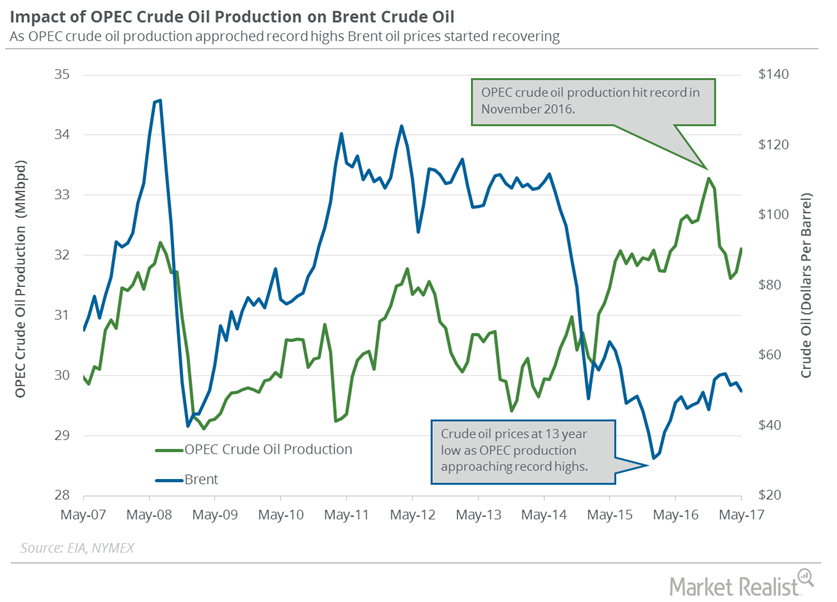
OPEC’s Crude Oil Production Hit a 2017 High
OPEC’s production cut compliance was at 92% in June 2017. Lower compliance from OPEC members and Russia could pressure crude oil prices.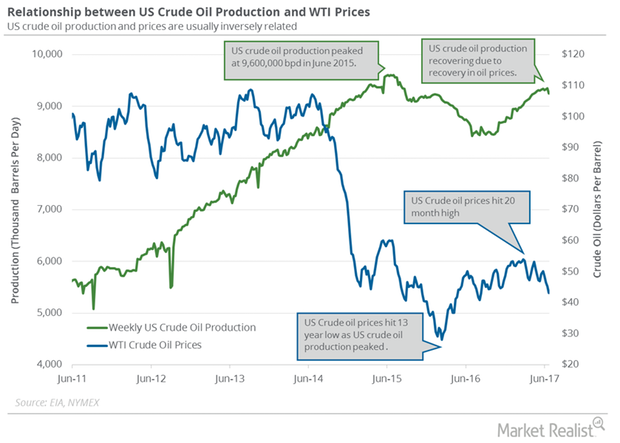
Will Libya and Iran Swing Crude Oil Prices?
Market surveys project that Libya’s crude oil production is near 1 MMbpd—the highest level in three years. High production could pressure crude oil prices.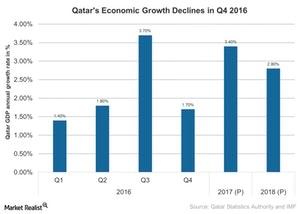
Will Qatar’s Economic Growth Continue to Fall amid the Crisis?
Qatar was expected to grow at a faster pace in 2017. However, economic sanctions by its neighbors are expected to impact its economic activity in 2017.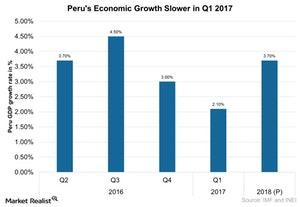
Why Global Mining Leader Peru Is Seeing Slower Growth in 2017
According to Peru’s Ministry of Economy and Finance, the El Niño–related infrastructure damages were close to $4 billion.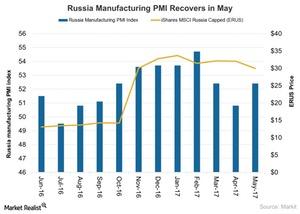
Is Russia’s Manufacturing Activity Back on Track in May 2017?
The Markit Russia manufacturing PMI increased to 52.4 in May 2017 compared to 50.8 in April 2017.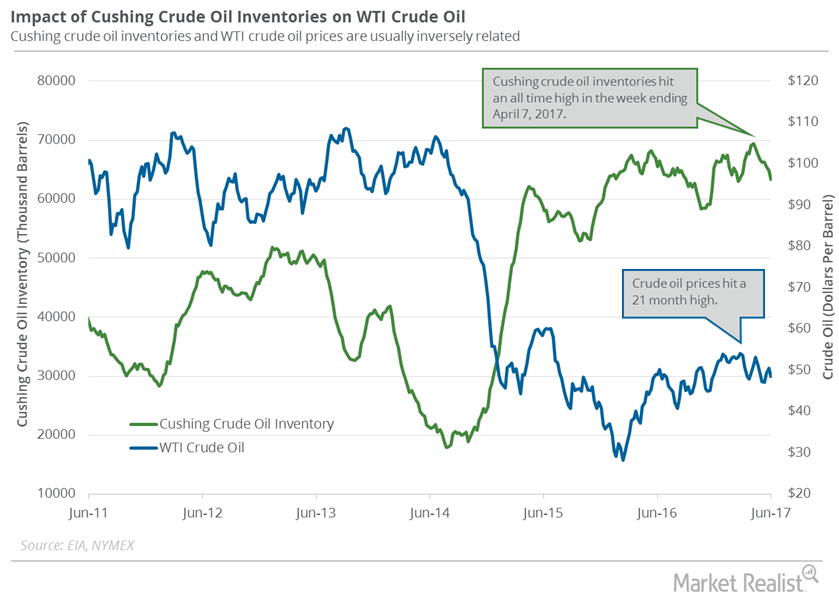
Cushing Crude Oil Inventories Fell Again
A recent survey estimated that inventories at Cushing could have fallen on June 2–9, 2017. Inventories at Cushing fell for the seventh time in ten weeks.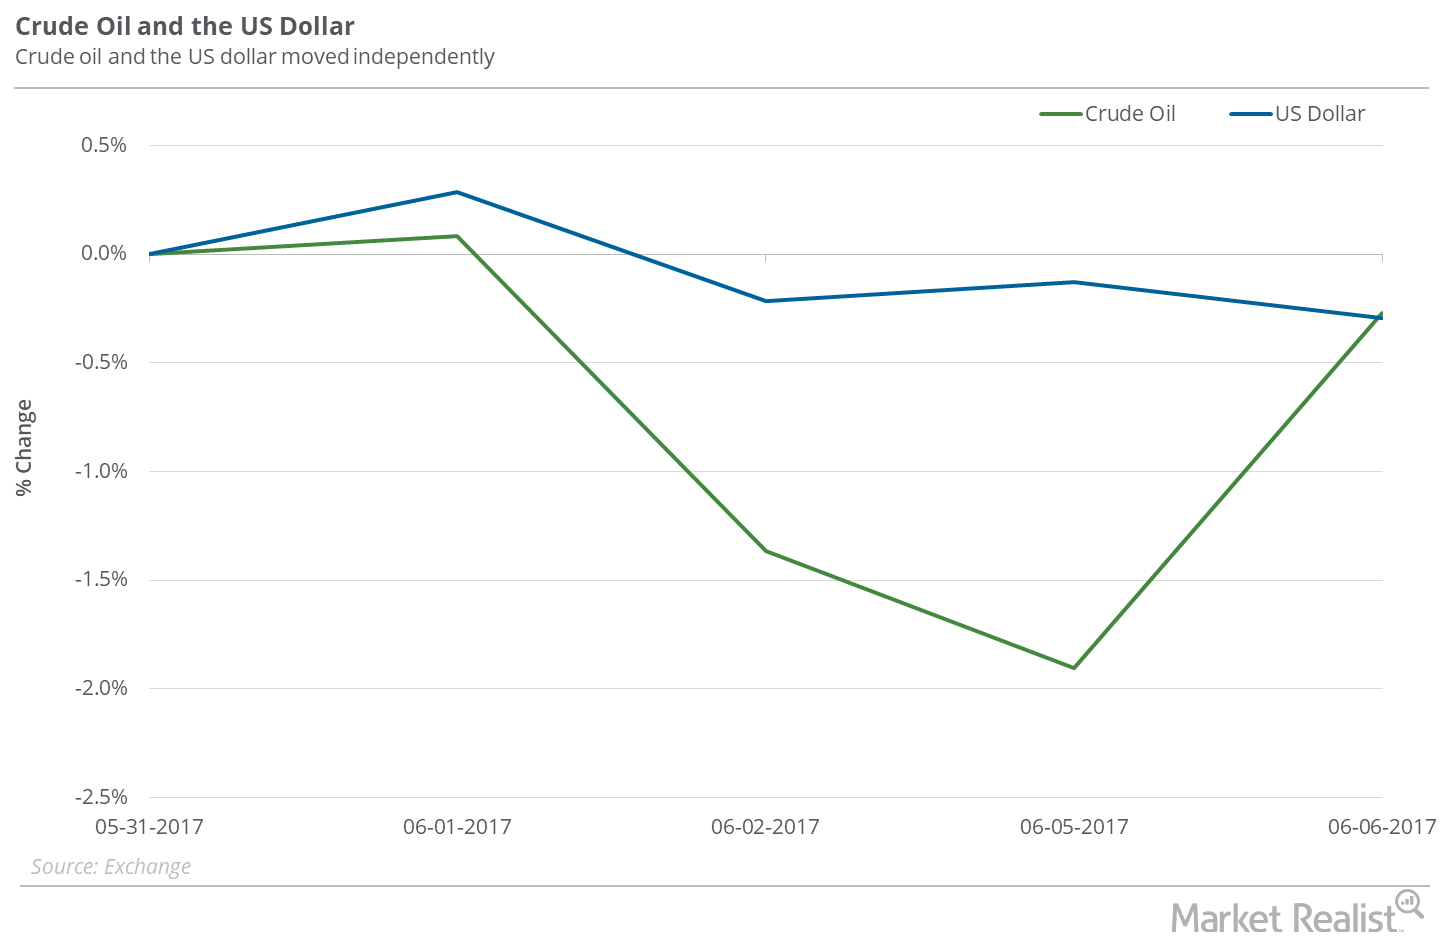
Is Crude Oil Ignoring the Falling Dollar?
Between May 30 and June 6, 2017, the US dollar (UUP) (USDU) (UDN) fell 0.7%, and crude oil (USO) (OIIL) July futures fell 3%.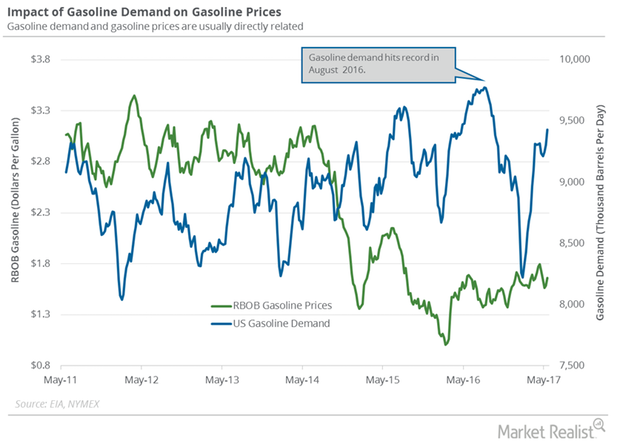
US Gasoline Consumption Rose in May
The EIA estimates that US gasoline consumption averaged 9,600,000 bpd (barrels per day) in May 2017—0.16 MMbpd higher than the same period in 2016.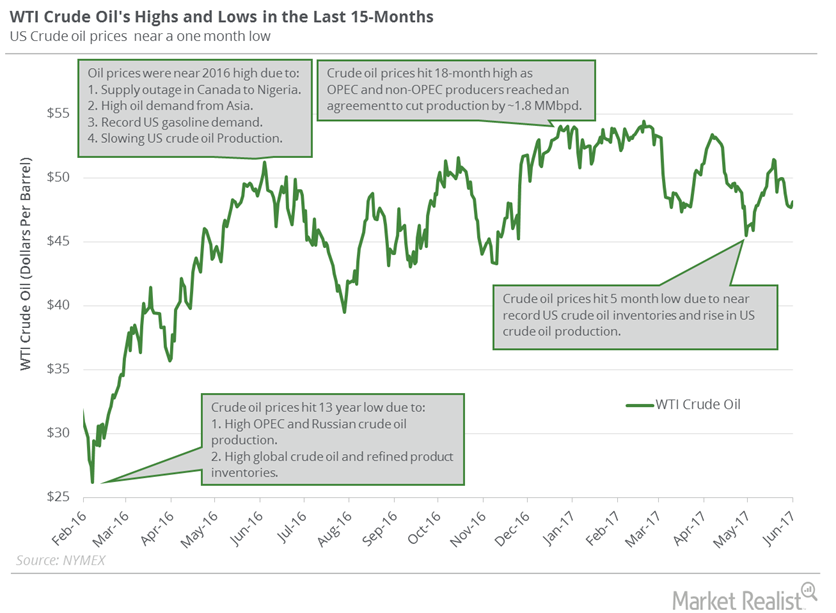
What to Expect from Crude Oil Futures This Week
US crude oil (USO) (IXC) (IYE) (PXI) prices are near their one-month low. Lower crude oil prices have a negative impact on oil producers’ earnings.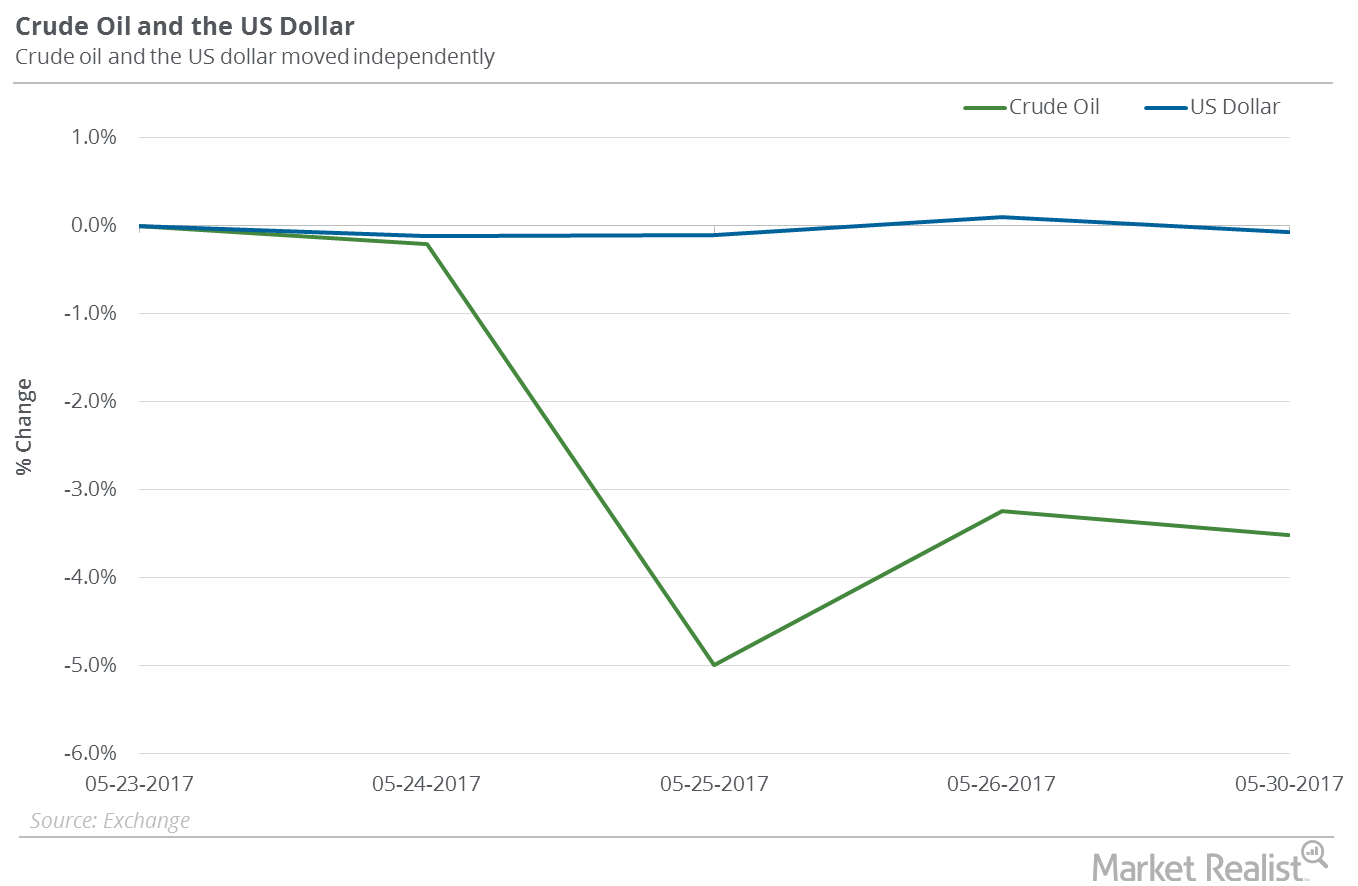
Is the US Dollar Impacting Oil’s Downturn?
In the trailing week, the US dollar fell 0.1%. Despite a fall in the US dollar, crude oil July futures fell 3.5% between May 23 and May 30, 2017.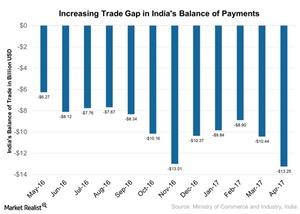
A Look at India’s Trade Gap and Its Economic Impact
India’s trade gap increased 173.5% on a year-over-year basis to ~$13.3 billion in April 2017, beating the market’s expectations of an ~$12.8 billion gap.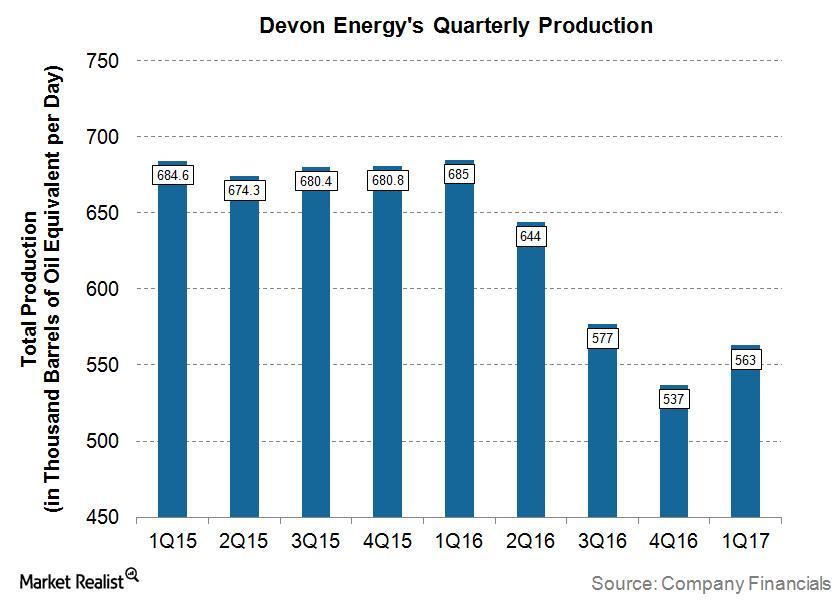
Understanding Devon Energy’s Production Volumes
For 1Q17, Devon Energy (DVN) reported total production of 563 MBoepd, which is ~18% lower when compared with 1Q16.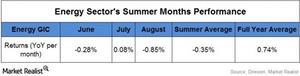
Will the Energy Sector Lag in Summer Months?
2016 proved fruitful for the energy sector (XLE) with an improvement in oil prices (USO) (USL).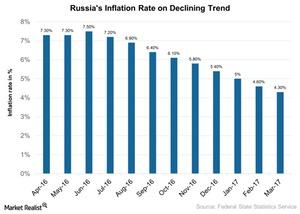
Russian Economy Gains Traction as Inflation Nears Target
Russia’s central bank recently lowered its key interest rate by half a percentage point to 9.25% in April 2017.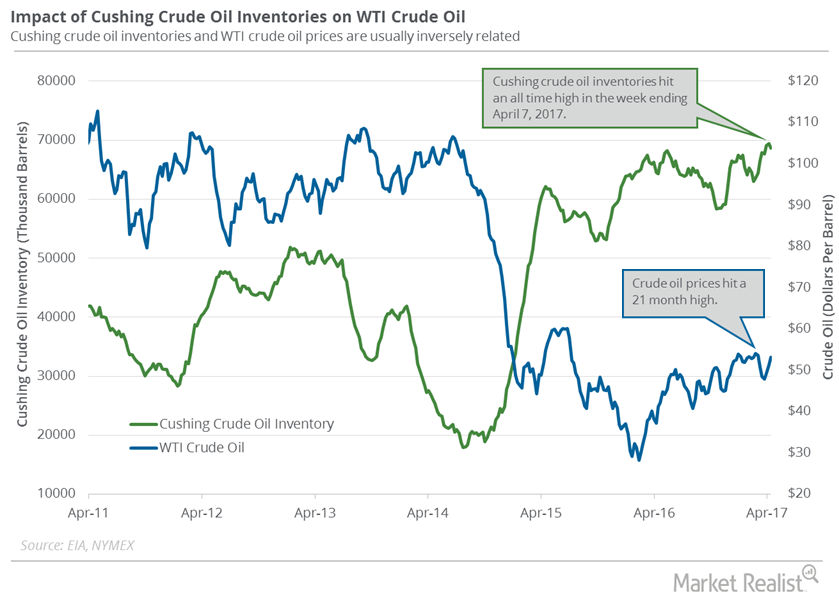
Cushing Crude Oil Inventories Fell from an All-Time High
For the week ending April 14, 2017, the EIA reported that Cushing crude oil inventories fell by 0.8 MMbbls (million barrels) to 68.6 MMbbls.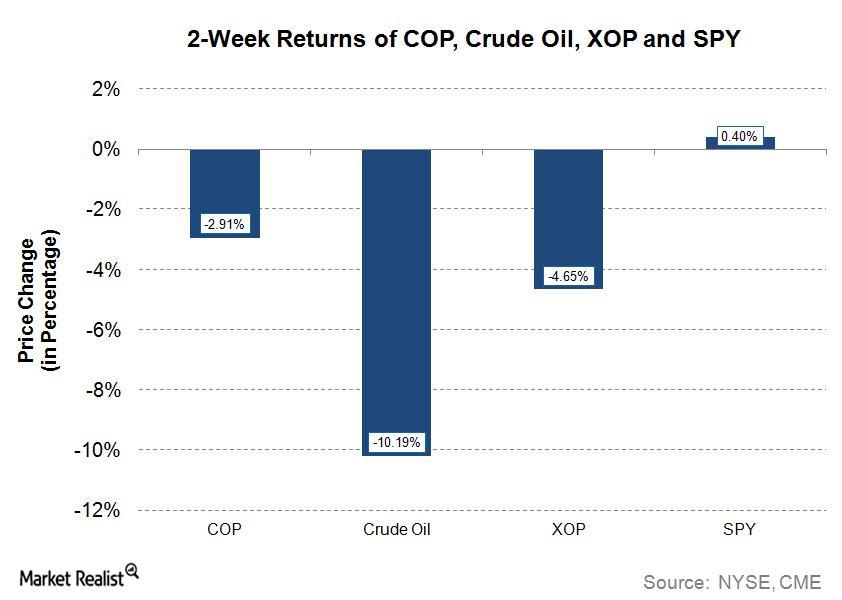
Why ConocoPhillips Stock Is Outperforming Crude Oil and Peers
In the last two weeks, the stock of ConocoPhillips (COP), a crude oil (USO) and natural gas (UNG) producer, has outperformed crude oil prices.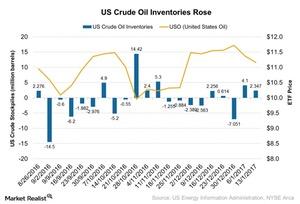
How Will Rise in Crude Oil Inventories Affect Crude Oil Movement?
According to the EIA’s (US Energy Information Administration) report on January 18, 2017, US crude oil inventories rose ~2.35 MMbbls (million barrels) for the week ended January 13, 2017.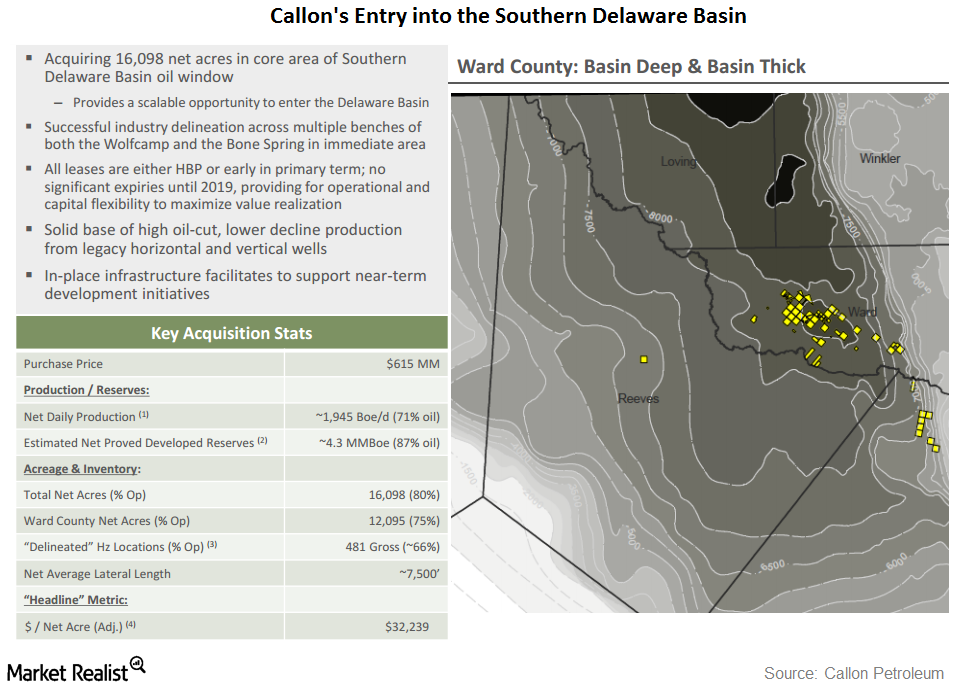
Callon Petroleum Makes Its First Delaware Basin Acquisition
On December 13, Callon Petroleum announced that it had agreed to acquire certain acreage positions and oil- and gas-producing properties from Ameredev.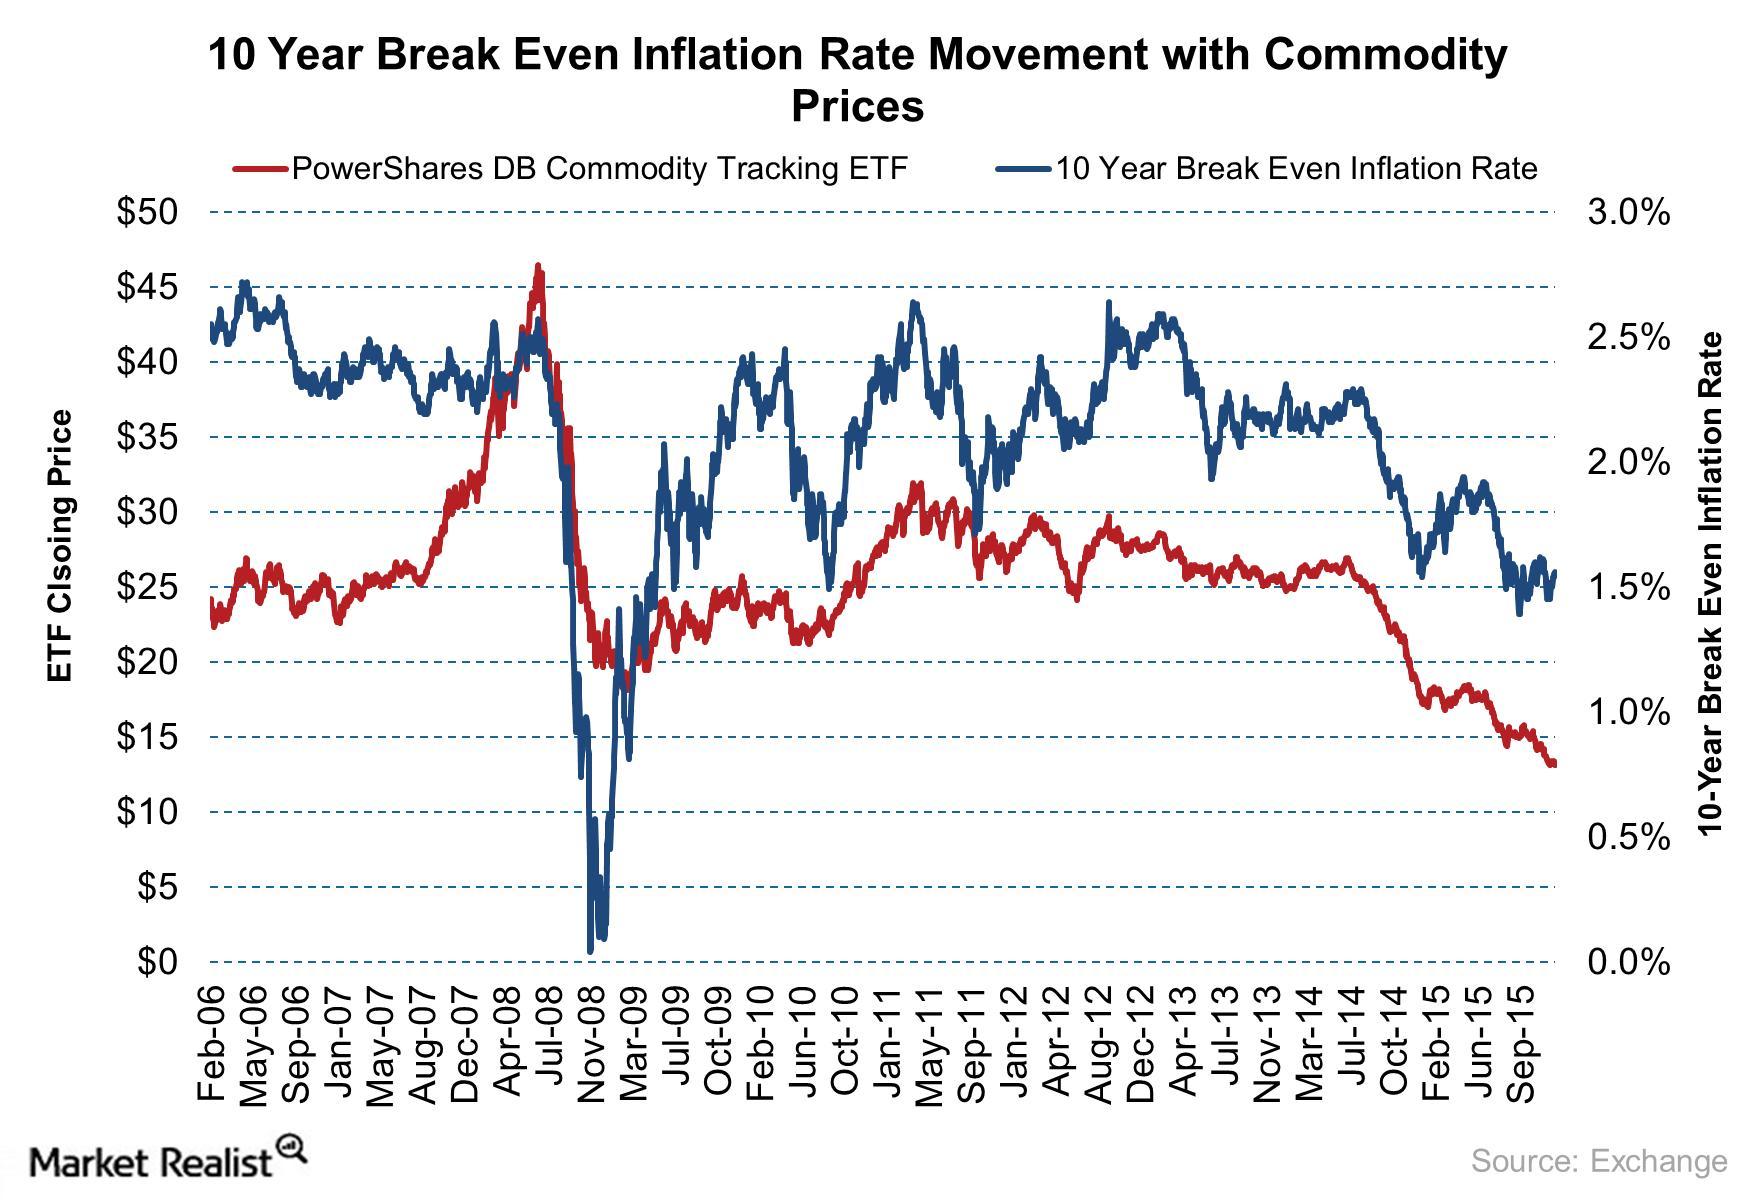
Goldman Sachs Is Long on the 10-Year US Breakeven Inflation Rate
After the announcement of the US election results, the 10-Year US Breakeven Inflation Rate showed an uptick. Goldman Sachs has advised investors to go long on the rate.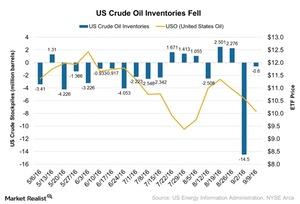
How OPEC’s Decision Will Impact Crude Oil’s Movement
According to the EIA’s (U.S. Energy Information Administration) report on September 14, 2016, US crude oil inventories fell 0.6 MMbbls (million barrels) for the week ending September 9.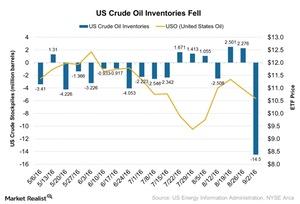
Crude Oil Prices Jumped as Inventories Fell
According to the EIA’s report on September 8, 2016, US crude oil inventories fell by 14.5 MMbbls for the week ended on September 2, 2016.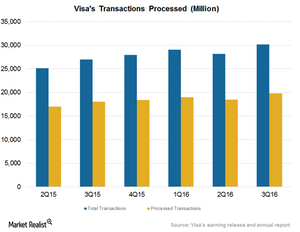
International Use to Boost Visa’s Fiscal 4Q16 Processed Transactions
Visa (V) reported total transactions of $30.2 billion in fiscal 3Q16, compared to $27 billion in fiscal 3Q15—a growth of 11.8% year-over-year.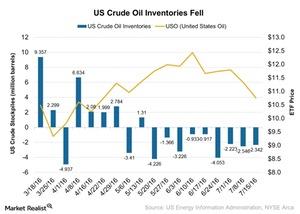
Why US Crude Oil Inventories Fell for 9th Consecutive Week
According to the July 20, 2016, U.S. Energy Information Administration report, US crude oil inventories declined by 2.3 MMbbls for the week ended July 15, 2016.
The Relationship between TIPS and the Break-Even Rate
Between Jan 2014 and September 2015, the break-even rate was higher than the CPI inflation rate, as markets were surprised by the sudden dip in oil (USO) prices.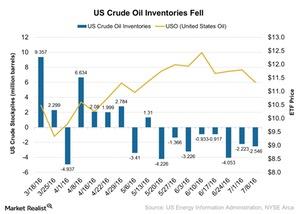
US Crude Oil Inventories Fell for the 8th Week: What It Means
According to the EIA’s report on July 13, 2016, US crude oil inventories fell by 2.5 MMbbls (million barrels) in the week ended July 8, 2016.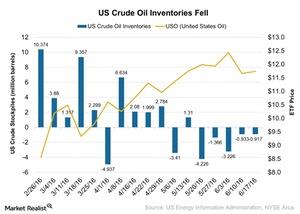
What Caused US Crude Oil Inventories to Fall Marginally?
According to the EIA’s report on June 22, 2016, US crude oil inventories fell by 0.92 MMbbls (million barrels) for the week ending June 17, 2016.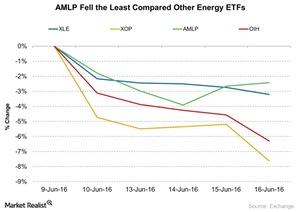
AMLP Fell: Did It Outperform Other Energy ETFs?
The Alerian MLP ETF (AMLP) outperformed other energy ETFs from June 9–16, 2016. Falling crude oil has less of an impact on midstream companies.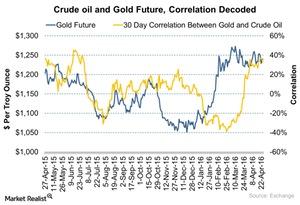
Gold and Crude Oil: How Does the Correlation Work?
Gold (GLD) can be considered an indicator of economic fear and inflation expectations. Driven by these fears, gold gains during equity market turmoil.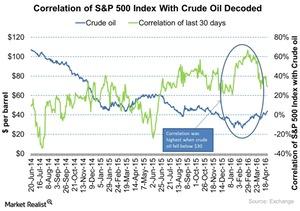
How Are Crude Oil Prices and the S&P 500 Correlated?
Historically, crude oil prices and the S&P 500 index have influenced each other.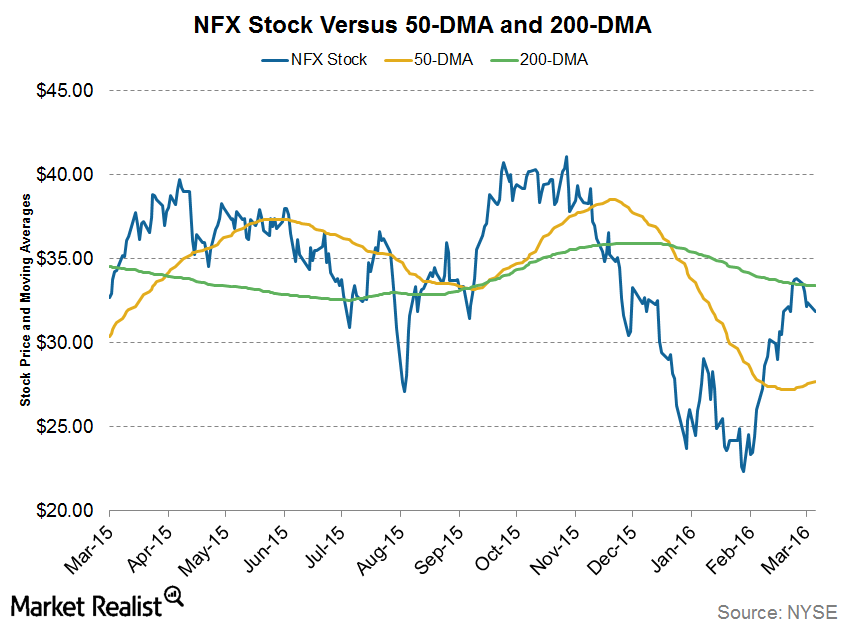
Newfield Exploration Stock Is Up, but for How Long?
With the recent rally in crude oil prices, Newfield Exploration (NFX) stock has been on an uptrend. On March 1, 2016, it crossed its 50-day moving average for the first time in 2016.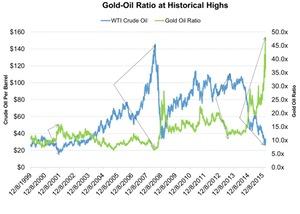
Gold-Oil Ratio Is at a Historic High: Why Isn’t the Bottom Near?
A rise in the ratio can be correlated the corresponding rise in gold prices. An increase in the ratio indicates that gold is more expensive than crude oil.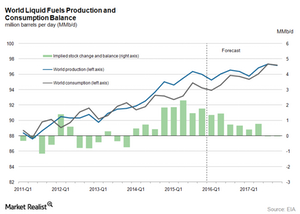
Why Is There a Crude Oil Supply and Demand Gap in 2016 and 2017?
The EIA estimates the global crude oil supply and demand gap to average 1 MMbpd in 2016 and 0.2 MMbpd in 2017. It reported that global consumption should grow 1.2 MMbpd in 2016 and 1.5 MMbpd in 2017.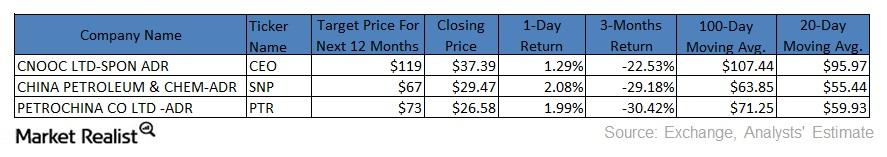
Moving Average Analysis of Chinese Energy Companies
Chinese energy companies CNOOC, China Petroleum & Chemical, and PetroChina Company have fallen below their 100-day and 20-day moving averages.
How OPEC’s Crude Oil Reserves Affect the Crude Oil Market
OPEC countries control 40% of global crude oil production and have around 81% of global crude oil reserves, as of 2014.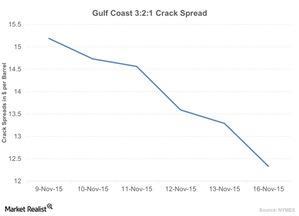
Crack Spread Narrowed: Is There Less Demand for Crude Oil?
The benchmark US Gulf Coast 3:2:1 crack spread fell ~12.50% last week. It hit ~$13.28 per barrel on Friday, November 13, 2015.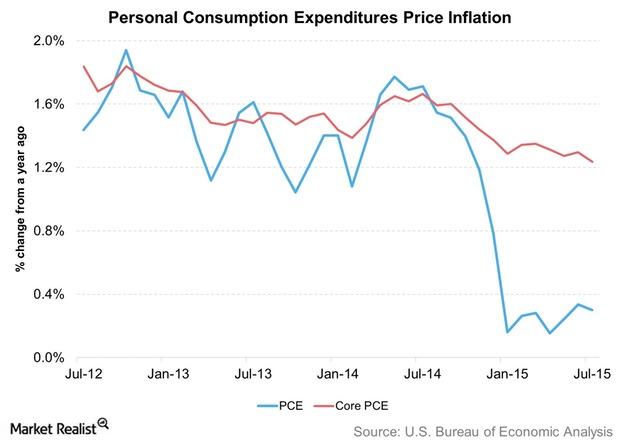
Import Prices and Crude Oil Keep US PCE Inflation Down
When the Fed refers to “inflation,” it’s talking about the rate of change in PCE (personal consumption expenditure) inflation. This is the price index for PCE.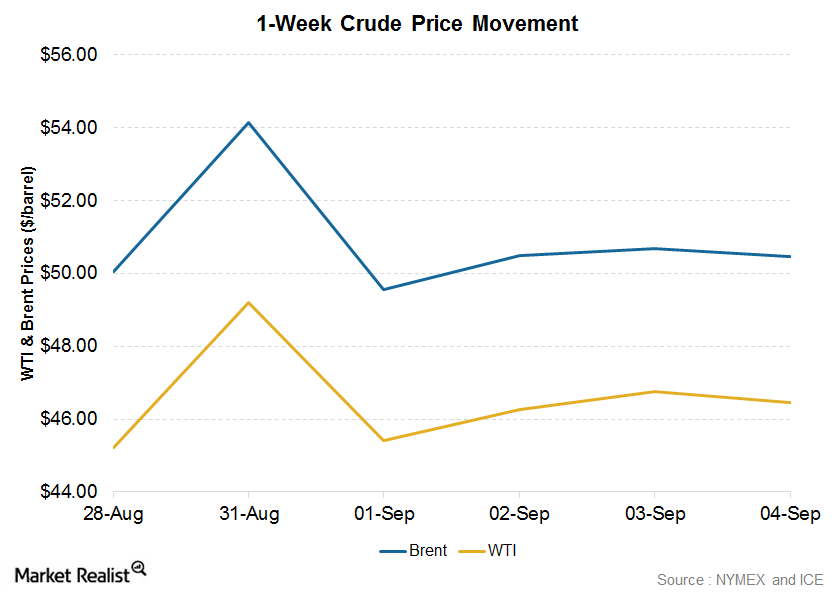
A Volatile Week for Crude Oil Prices: Analyzing the Key Reasons
WTI crude oil prices closed 1.83% higher on a weekly basis at $46.05 per barrel in the week ended September 4. Brent crude fell by 0.87% on a weekly basis, closing at $49.61 on September 4.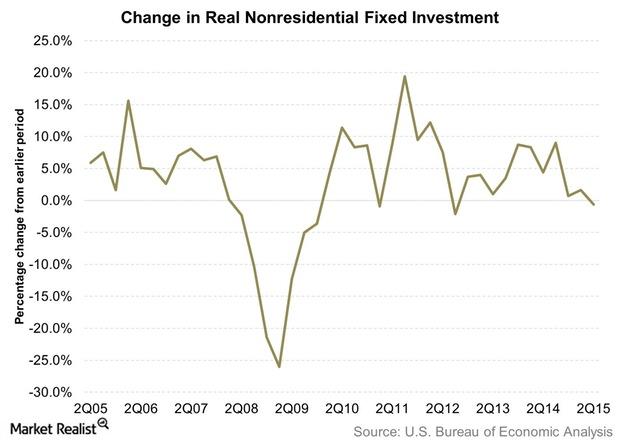
Why Is US Business Fixed Investment Subdued?
Business fixed investment represents business spending on plants, equipment, and machines. It forms an important component in the calculation of economic output.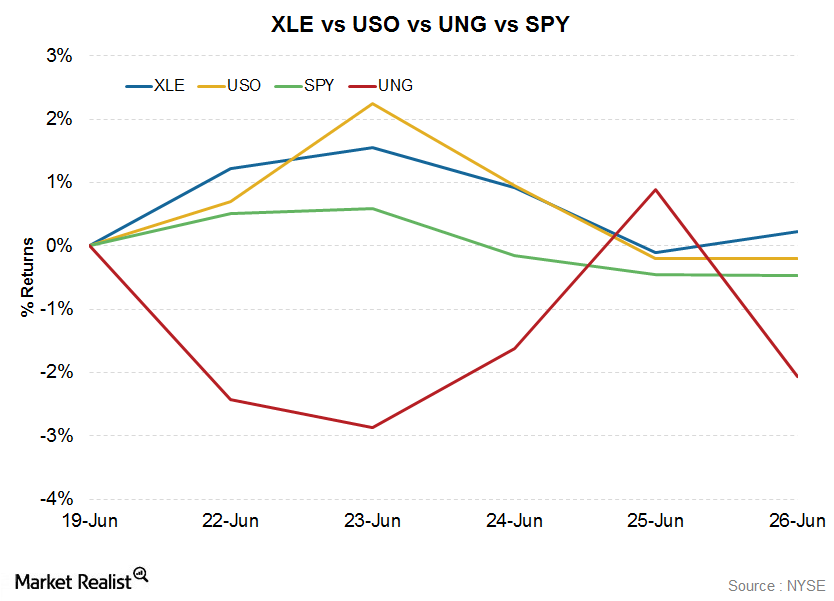
XLE Is Up Even as Commodity ETFs Track Energy Prices Lower
The Energy Select Sector SPDR ETF (XLE) rose 0.22% in the week to June 26. The ETF tracks a diverse group of ~45 of the largest US energy stocks.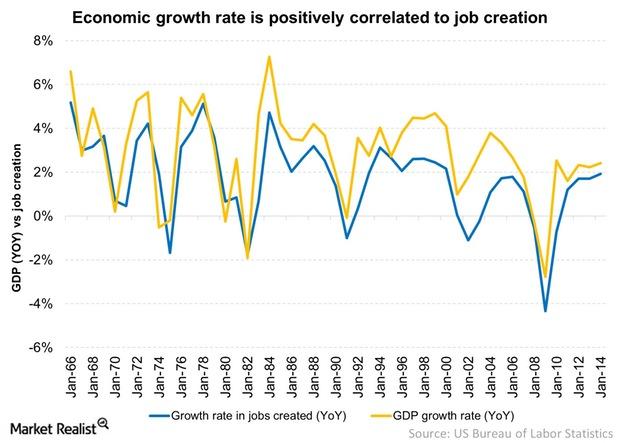
Why Job Creation And GDP Growth Go Hand-In-Hand
Job creation and GDP growth go hand-in-hand. The job markets and the economy tend to move in a similar pattern.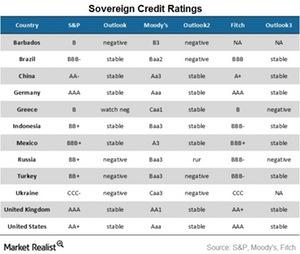
Russia’s sovereign credit rating downgraded to junk
Russia’s sovereign credit rating now stands on par with countries such as Turkey and Indonesia. The oil price crisis isn’t helping matters.