The Relationship between TIPS and the Break-Even Rate
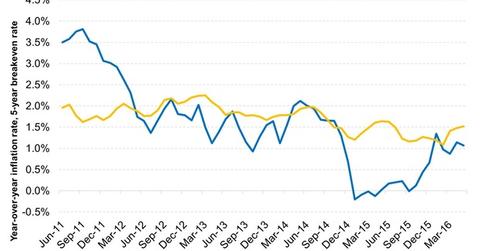
Between Jan 2014 and September 2015, the break-even rate was higher than the CPI inflation rate, as markets were surprised by the sudden dip in oil (USO) prices.
July 26 2016, Updated 9:06 a.m. ET

Example
A TIPS with a coupon of 0.125% and a maturity of 4/15/19, offered at a price of 101.453125, has a real yield of -.197%, with the last index ratio measuring 1.016462. Compare this to a standard U.S. Treasury bond with a comparable maturity: a Treasury bond with a coupon of 1.625% and a maturity of 4/30/19 has a yield of 1.332% at a price of 101.28125.
The market estimates where inflation will be and prices TIPS accordingly. The above TIPS bond has a real yield of -.197%, a negative yield because currently U.S. Treasuries are yielding 1.332%, which is lower than the expected inflation rate or breakeven rate of 1.529%. Breakeven rate or expected inflation rate equals comparable U.S. Treasury yield minus TIPS real yield.
= 1.332% – -.197%
1.529% = 1.332% – -.197%
Real yield on TIPS equals comparable U.S. Treasury yield minus breakeven or expected inflation rate.
= 1.332% – 1.529%
-.197%= 1.332% – 1.529%
In this example, the breakeven inflation rate equals 1.529% (1.332% – – .197%). If inflation stayed at 1.529% for next four years to the maturity of the TIPS, neither security would be more attractive than the other. But if an investor believed that inflation would average more than 1.529% over the next four years, then the investor would prefer the TIPS issue, as the TIPS issue would outperform the conventional Treasury issue. If the investor believed that inflation would be lower than 1.529%, then they would prefer to buy the U.S. Treasury issue, as the U.S. Treasury would earn a higher yield.
The relationship between TIPS and the break-even rate Market Realist’s View
The graph above compares the YoY (year-over-year) CPI (Consumer Price Index) inflation rate with the five-year break-even rate or inflation expectation. Between January 2014 and September 2015, the break-even rate was higher than the CPI inflation rate since the Markets were surprised by the sudden dip in oil (USO) prices.
In that period, Treasuries outperformed TIPS (Treasury Inflation-Protected Securities). TIPS (TIP) fell by -0.6%, while Treasuries (GOVT) returned 1.1%.
When the break-even rate was lower than the actual inflation rate between June 2011 and May 2012, TIPS outperformed with returns of 12.5% in that period.
