Nike Inc
Latest Nike Inc News and Updates
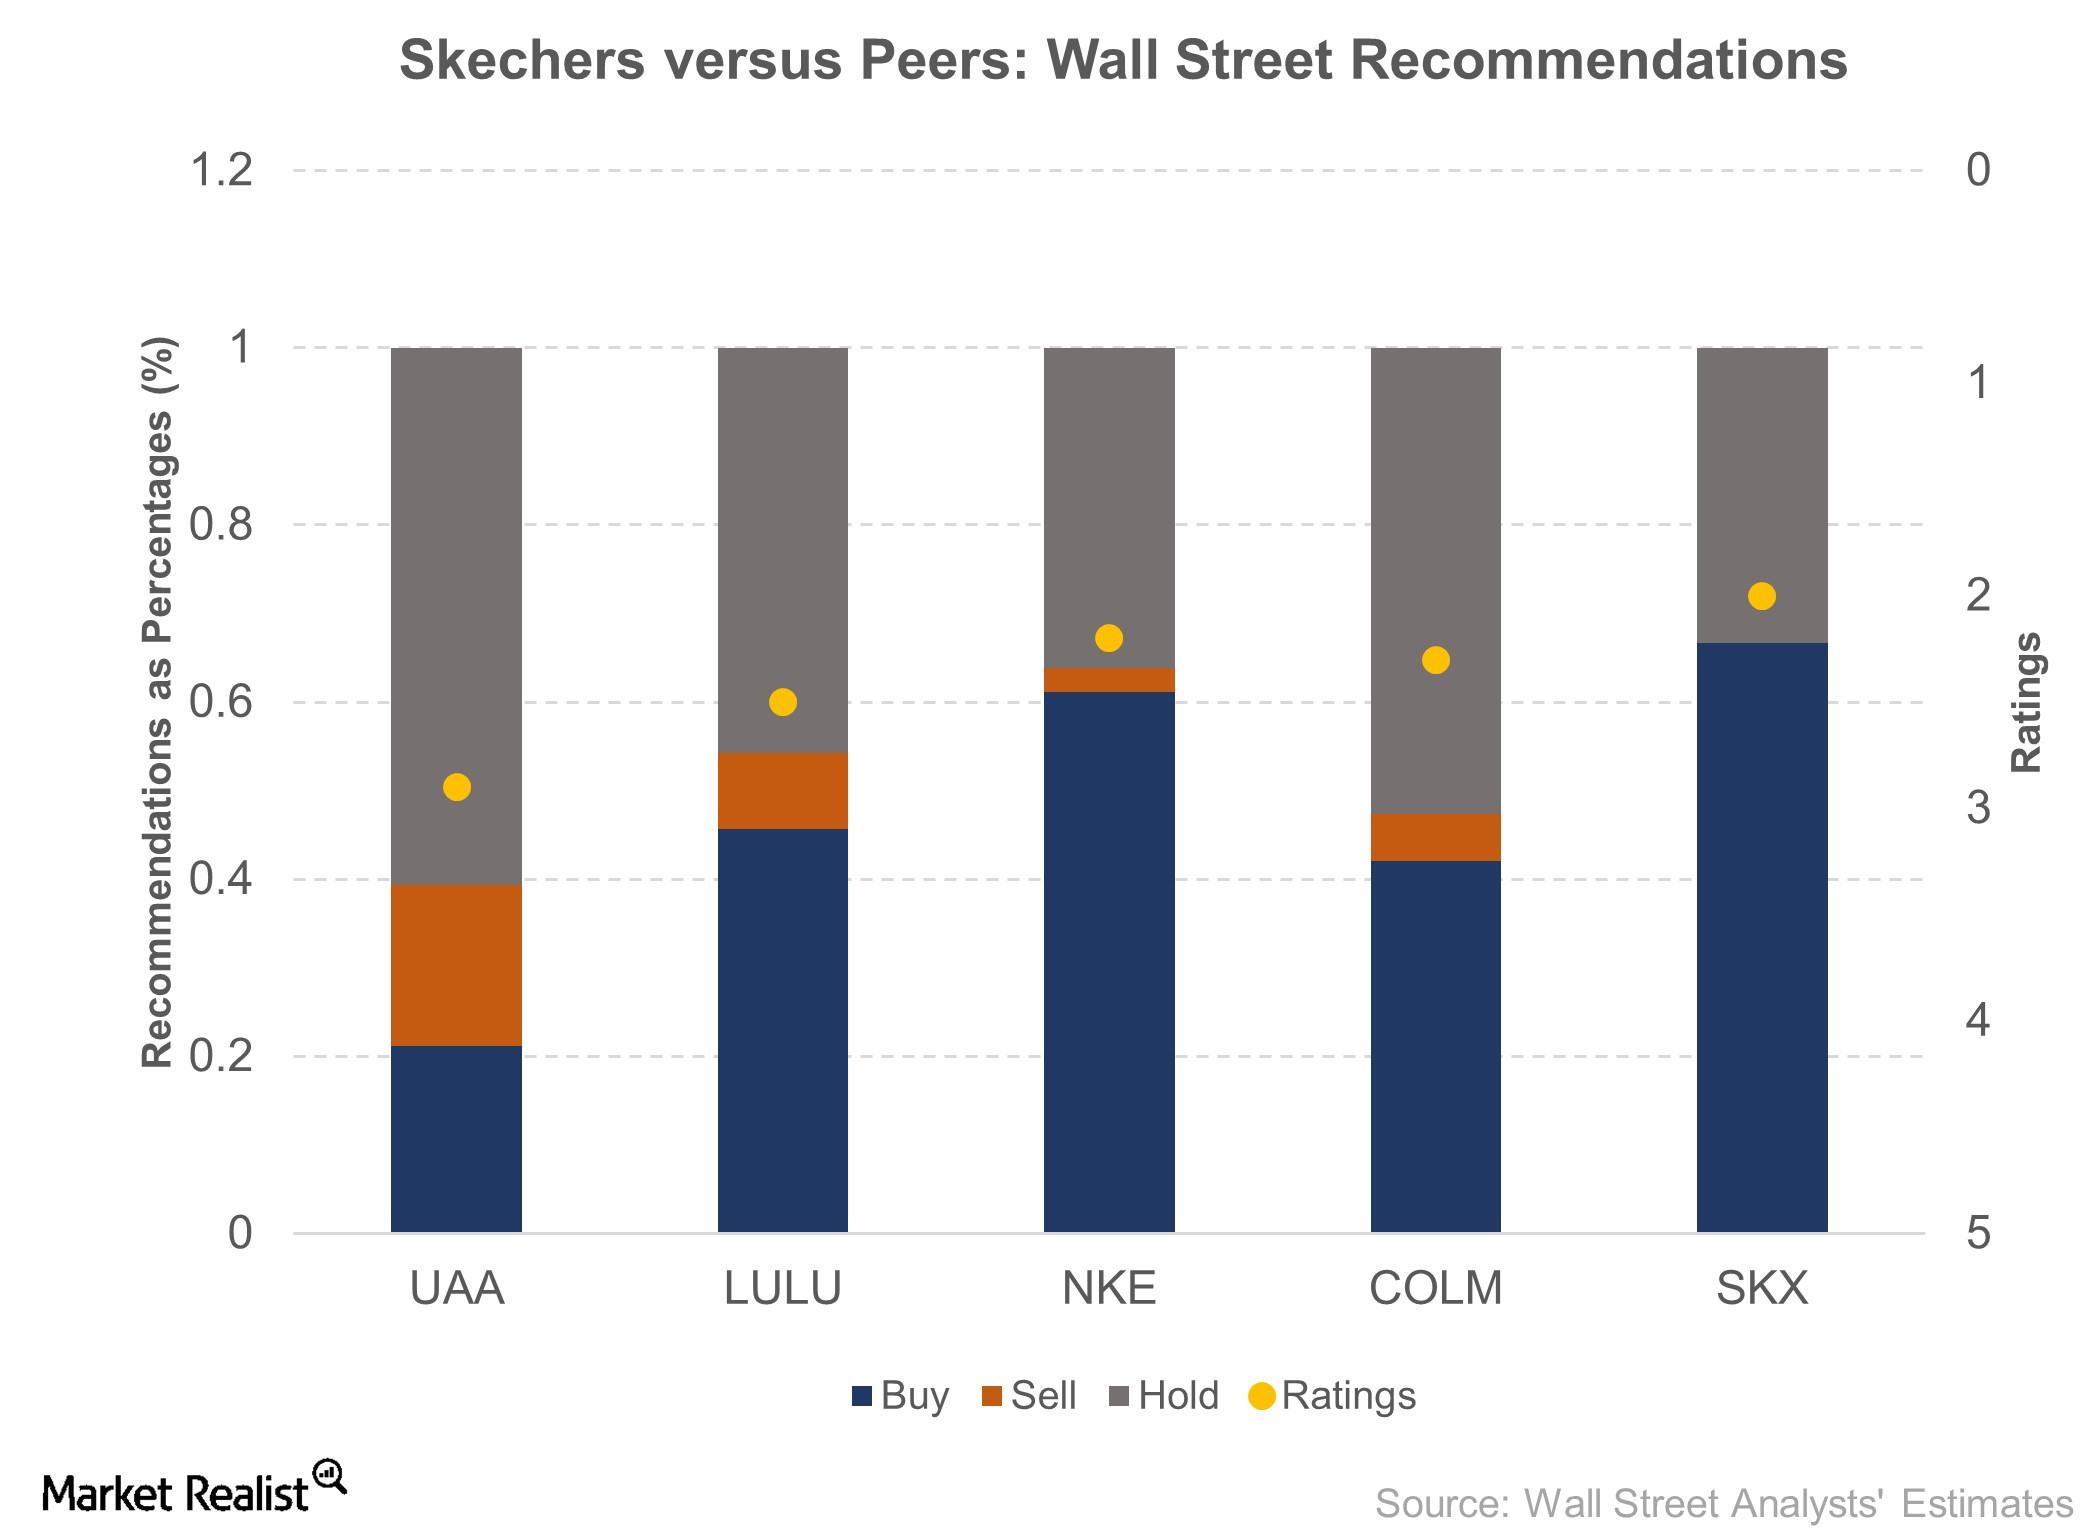
Discussing Wall Street’s View on Skechers
Skechers (SKX) is covered by 12 Wall Street analysts who jointly rate the company as a 2 on a scale of 1 (“strong buy”) to 5 (“sell”).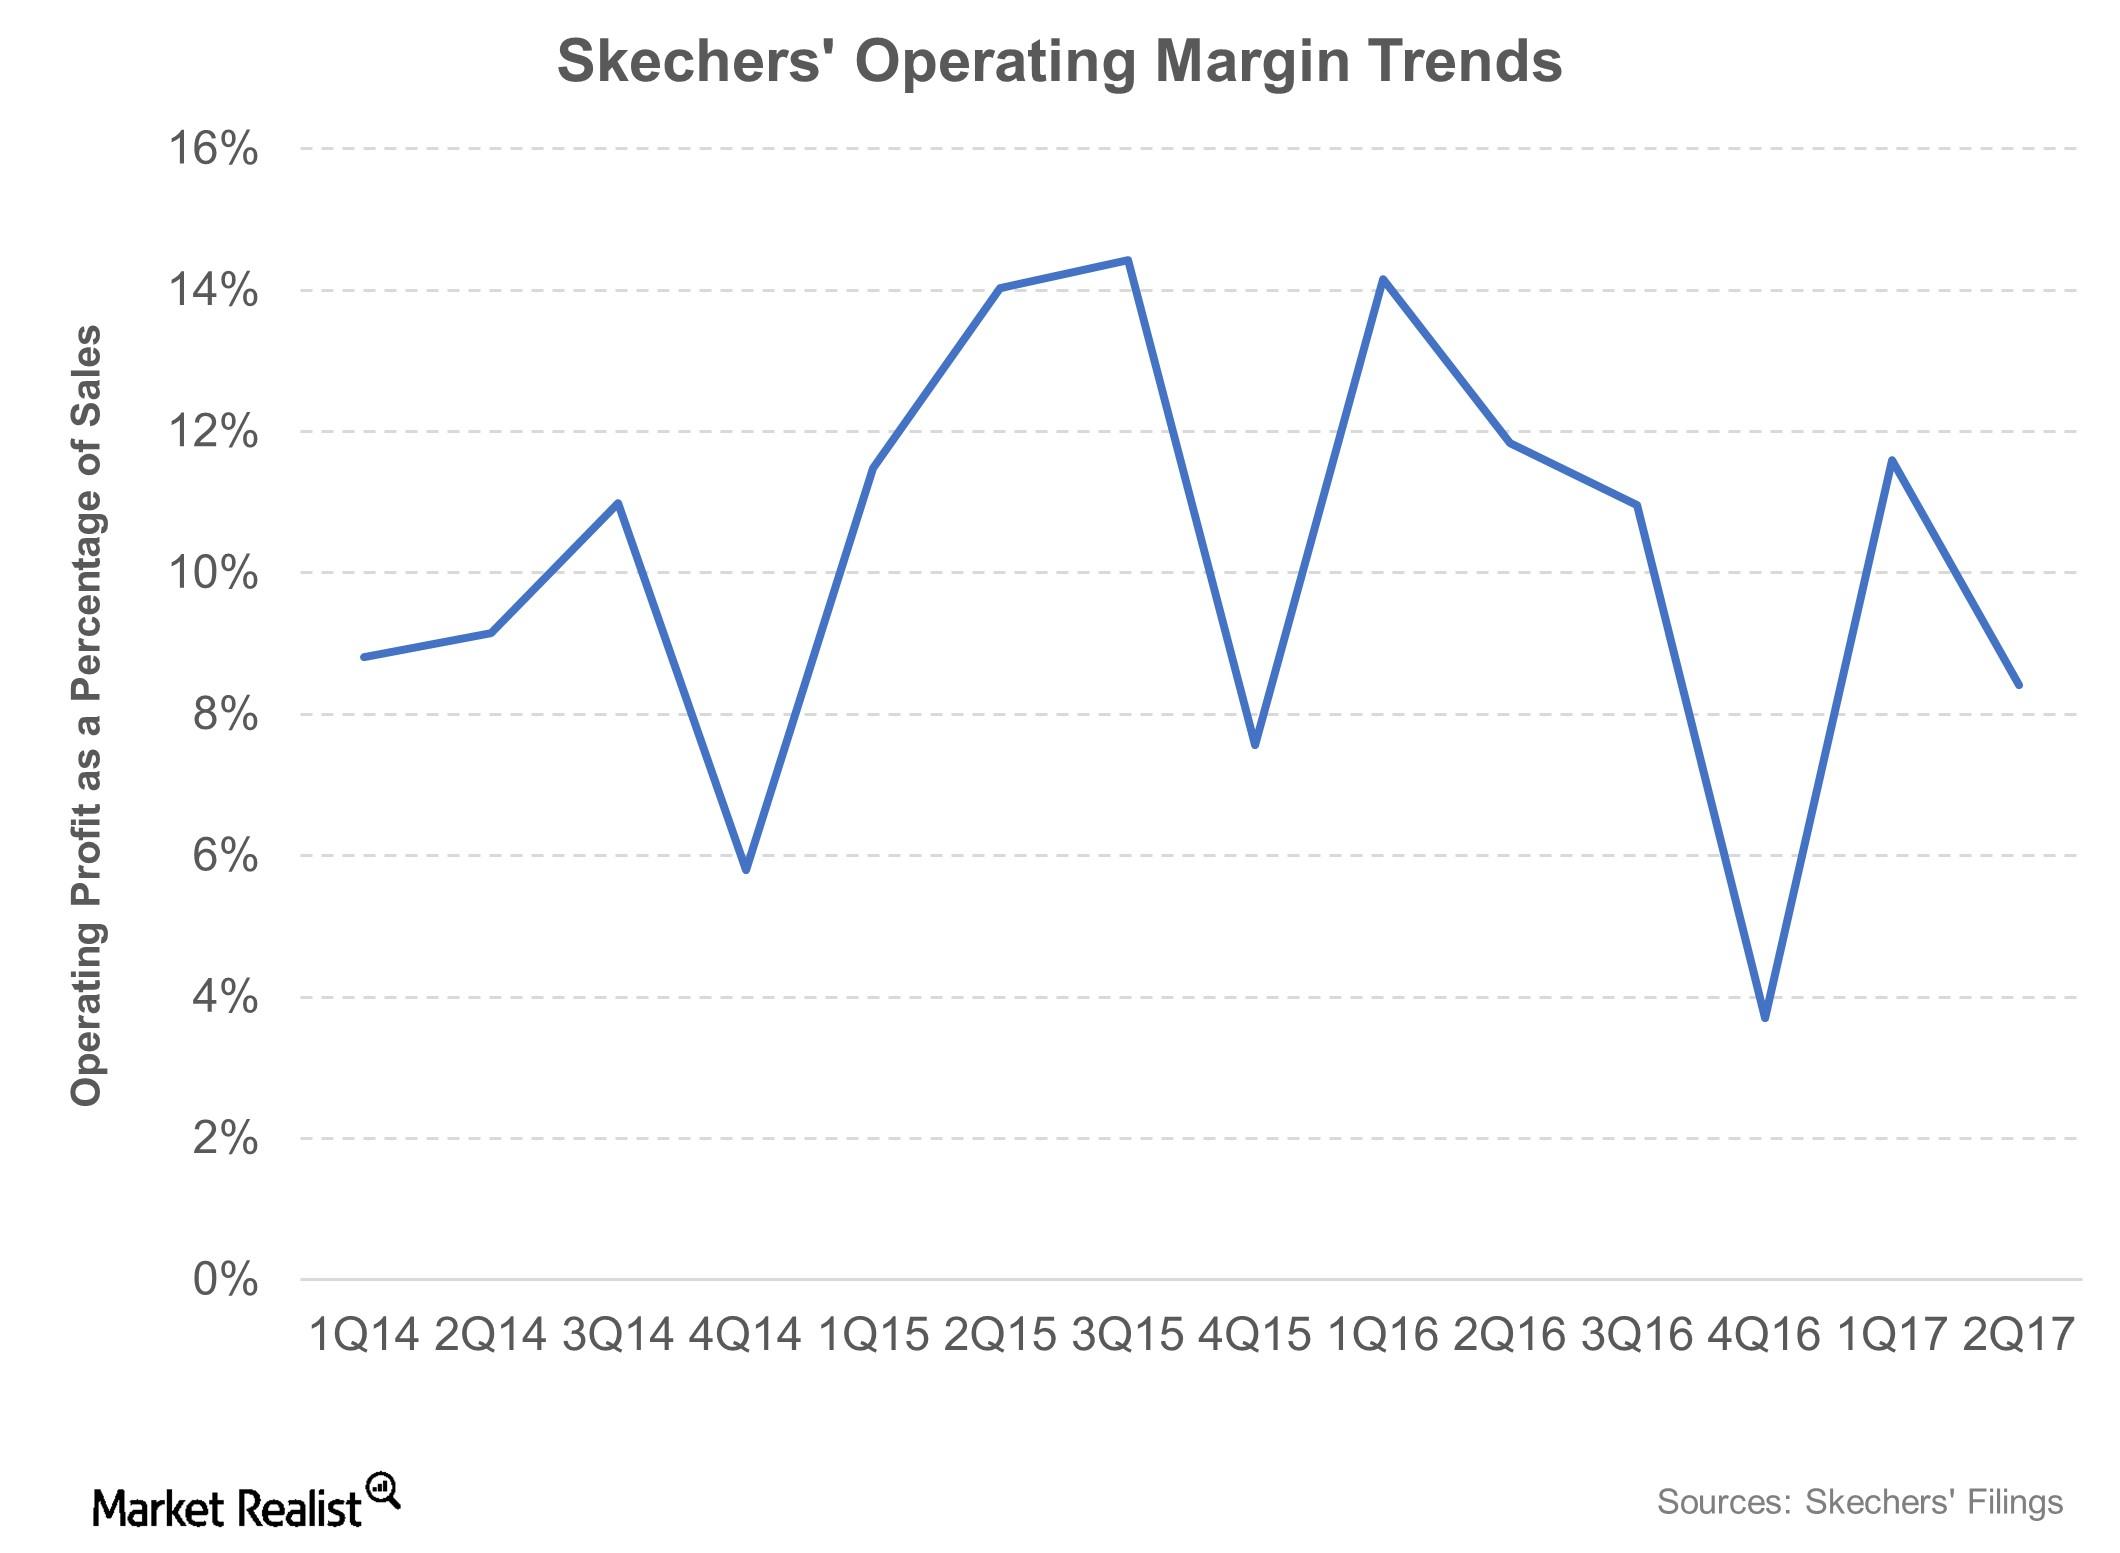
Skechers Reports Its Fifth Straight Fall in Earnings in 2Q17
Skechers, which released its 2Q17 results on July 20, 2017, reported earnings per share of $0.38. The company missed analysts’ consensus expectation by a margin of $0.06.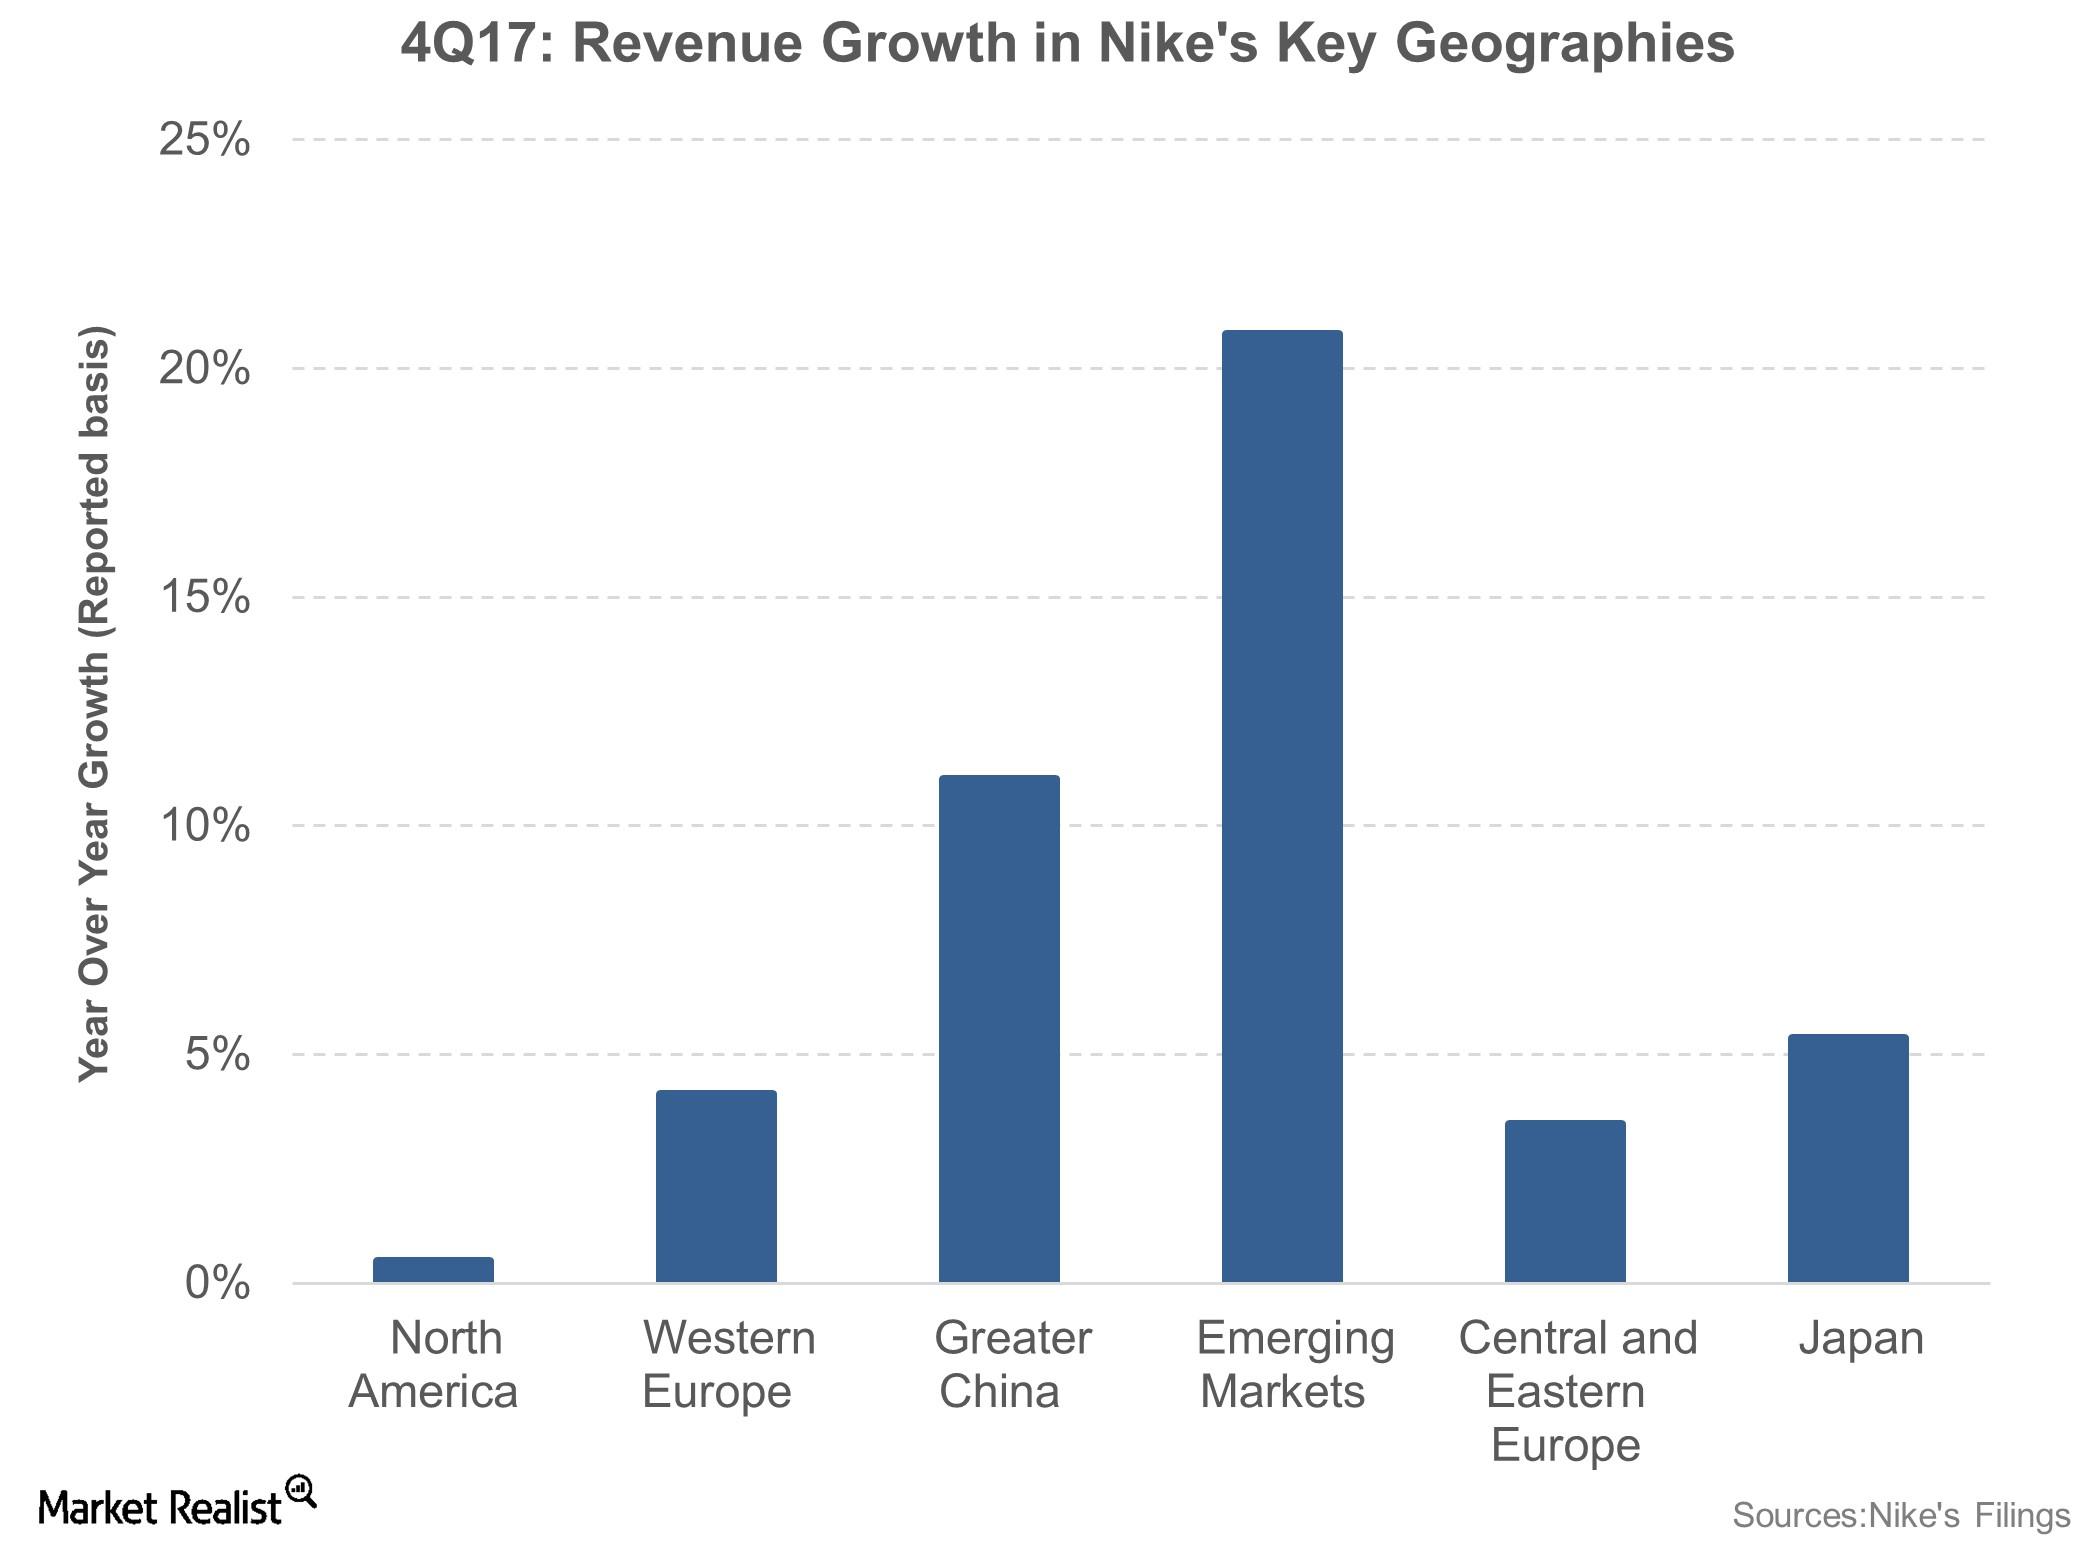
Inside Nike’s Double-Digit International Market Growth in Fiscal 2017
Nike’s key brand, Nike, which accounts for ~95% of the company’s business, saw a 7% YoY rise in its fiscal 4Q17 sales on a currency-neutral basis.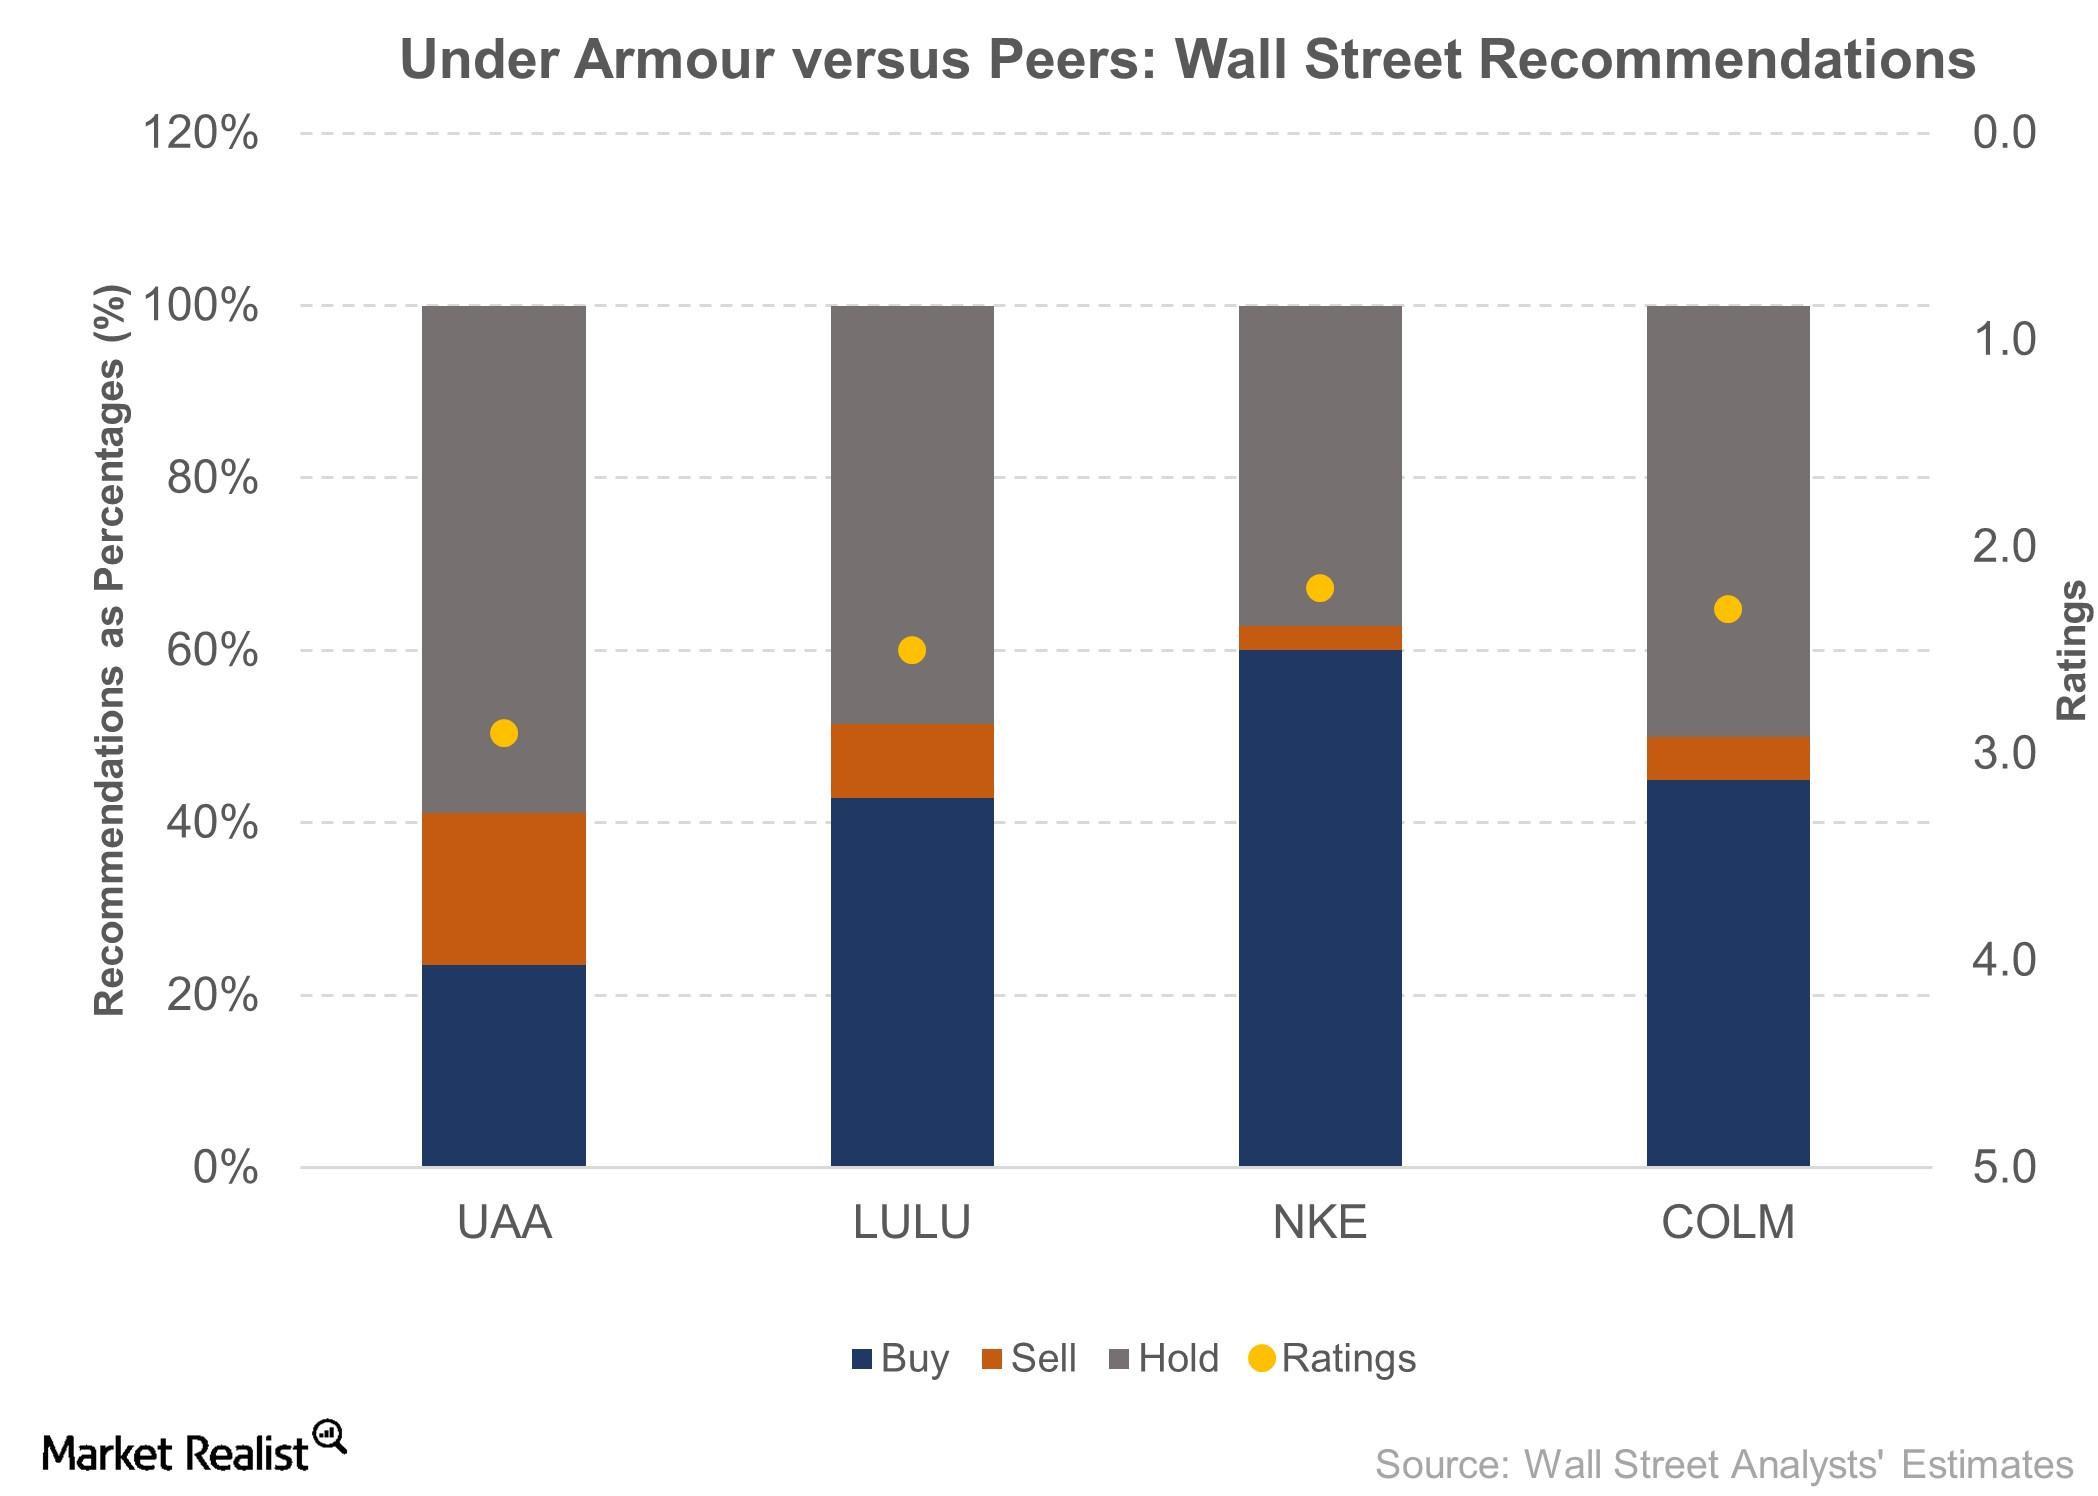
Susquehanna: Under Armour Changes Are ‘Temporary Pause’ to Growth
UAA is covered by 34 Wall Street analysts who together rate the company a 2.9 on a scale of 1.0 for “strong buy” to 5.0 for “sell.”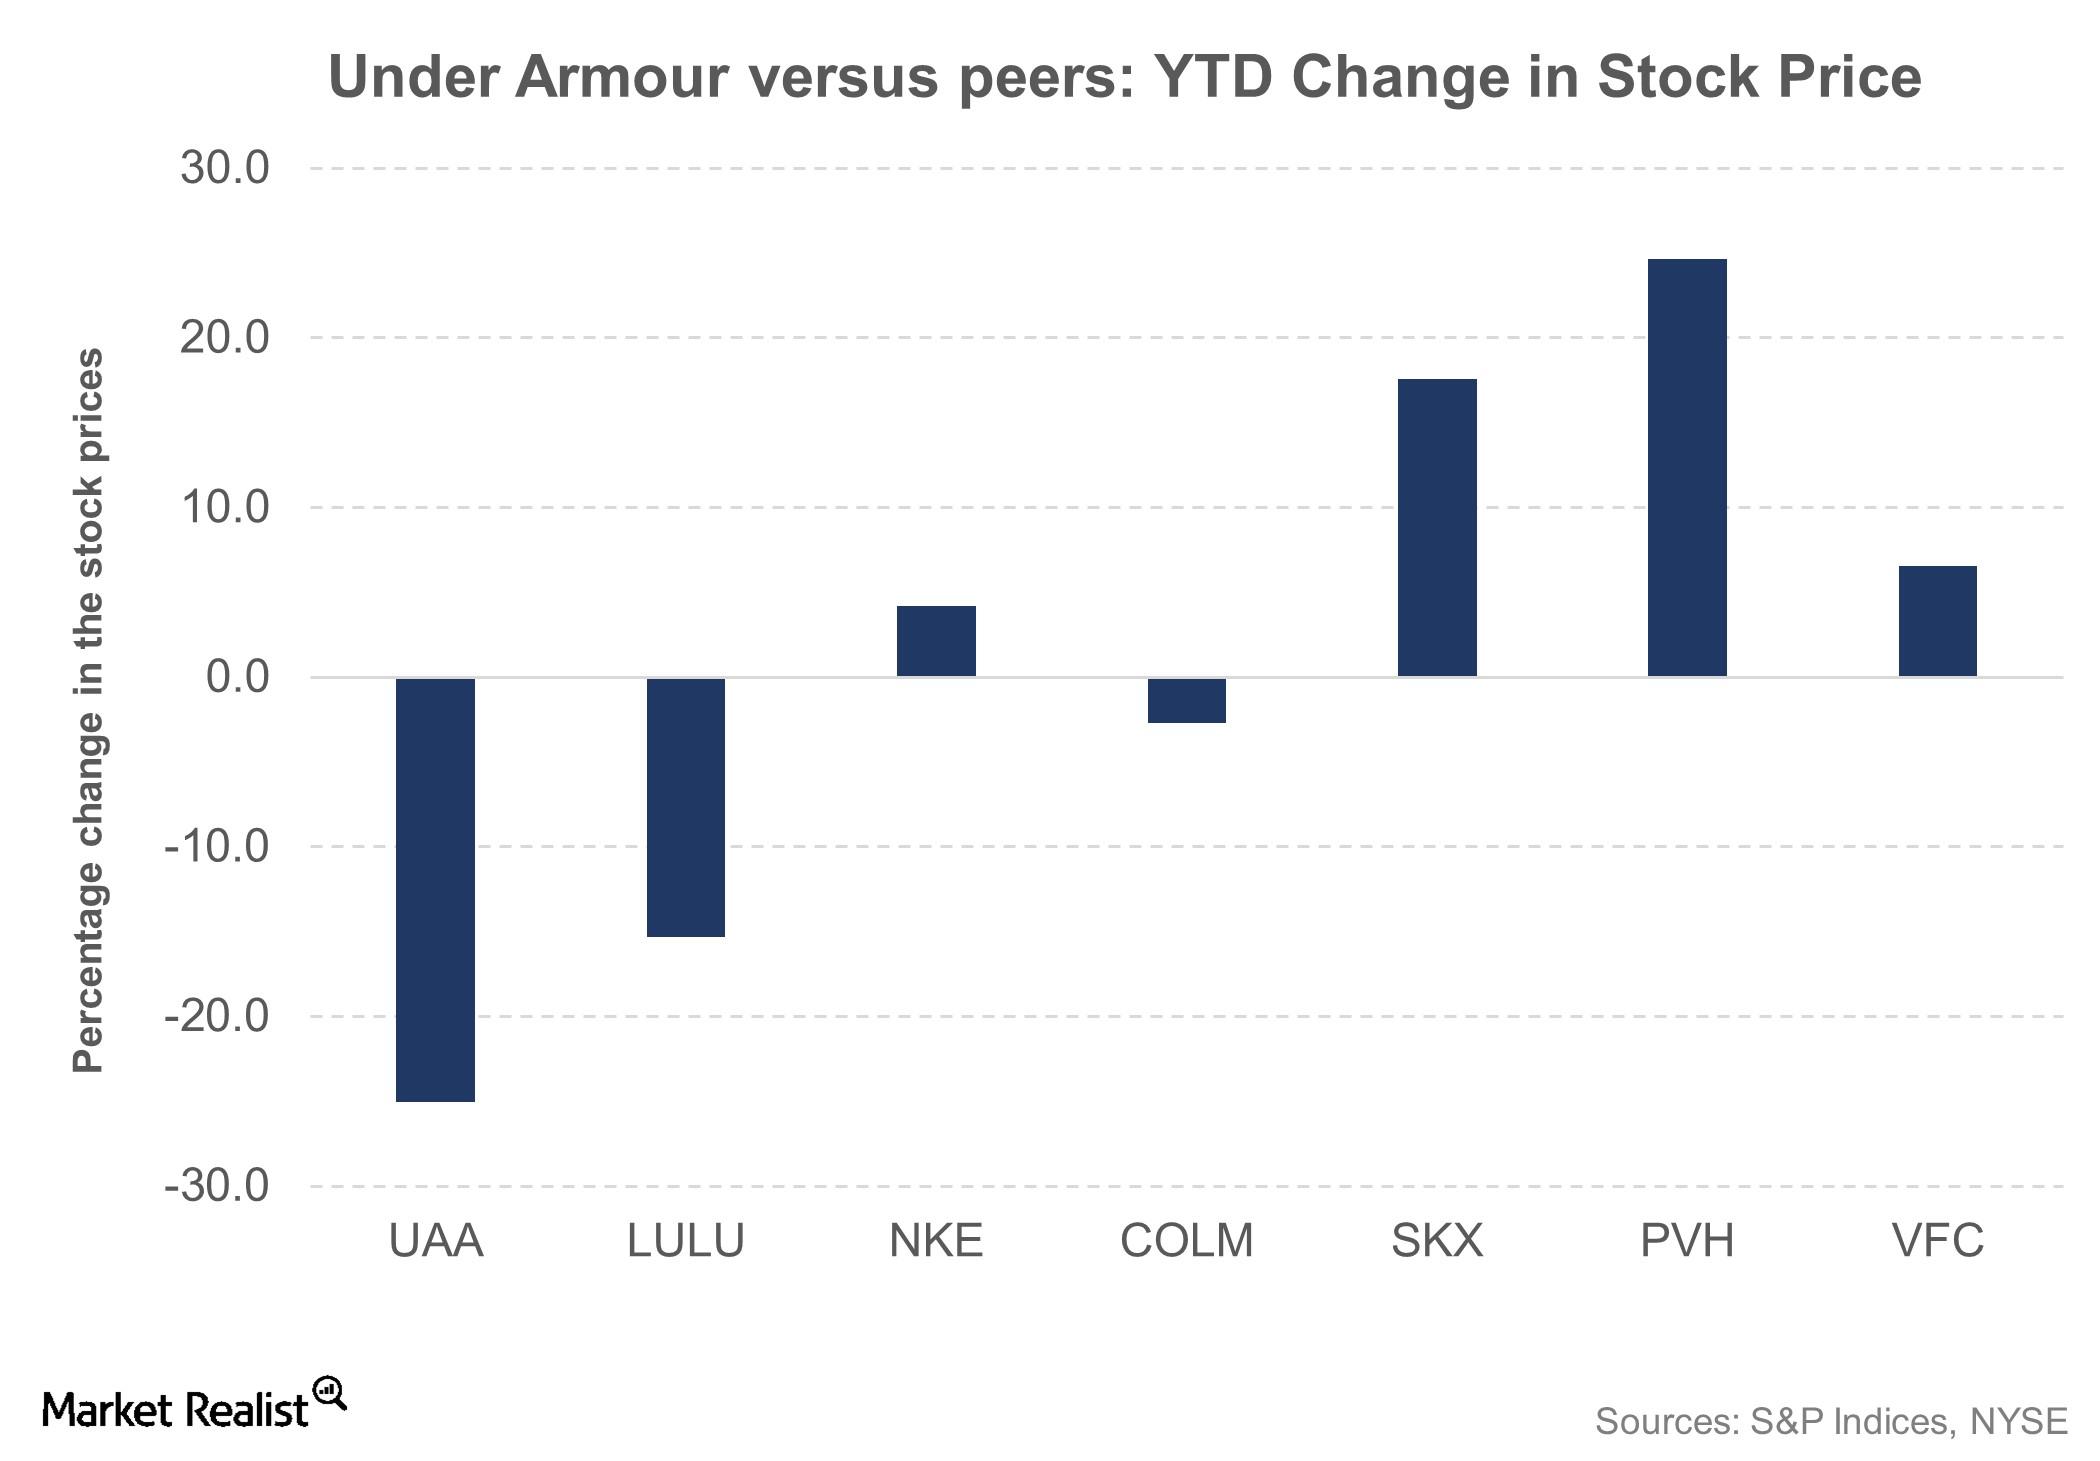
Under Armour Trading 40% Lower Than a Year Ago
Under Armour (UAA) stock remained unfazed after the company announced its new senior level executives, rising ~1.0% and closing at $25.06.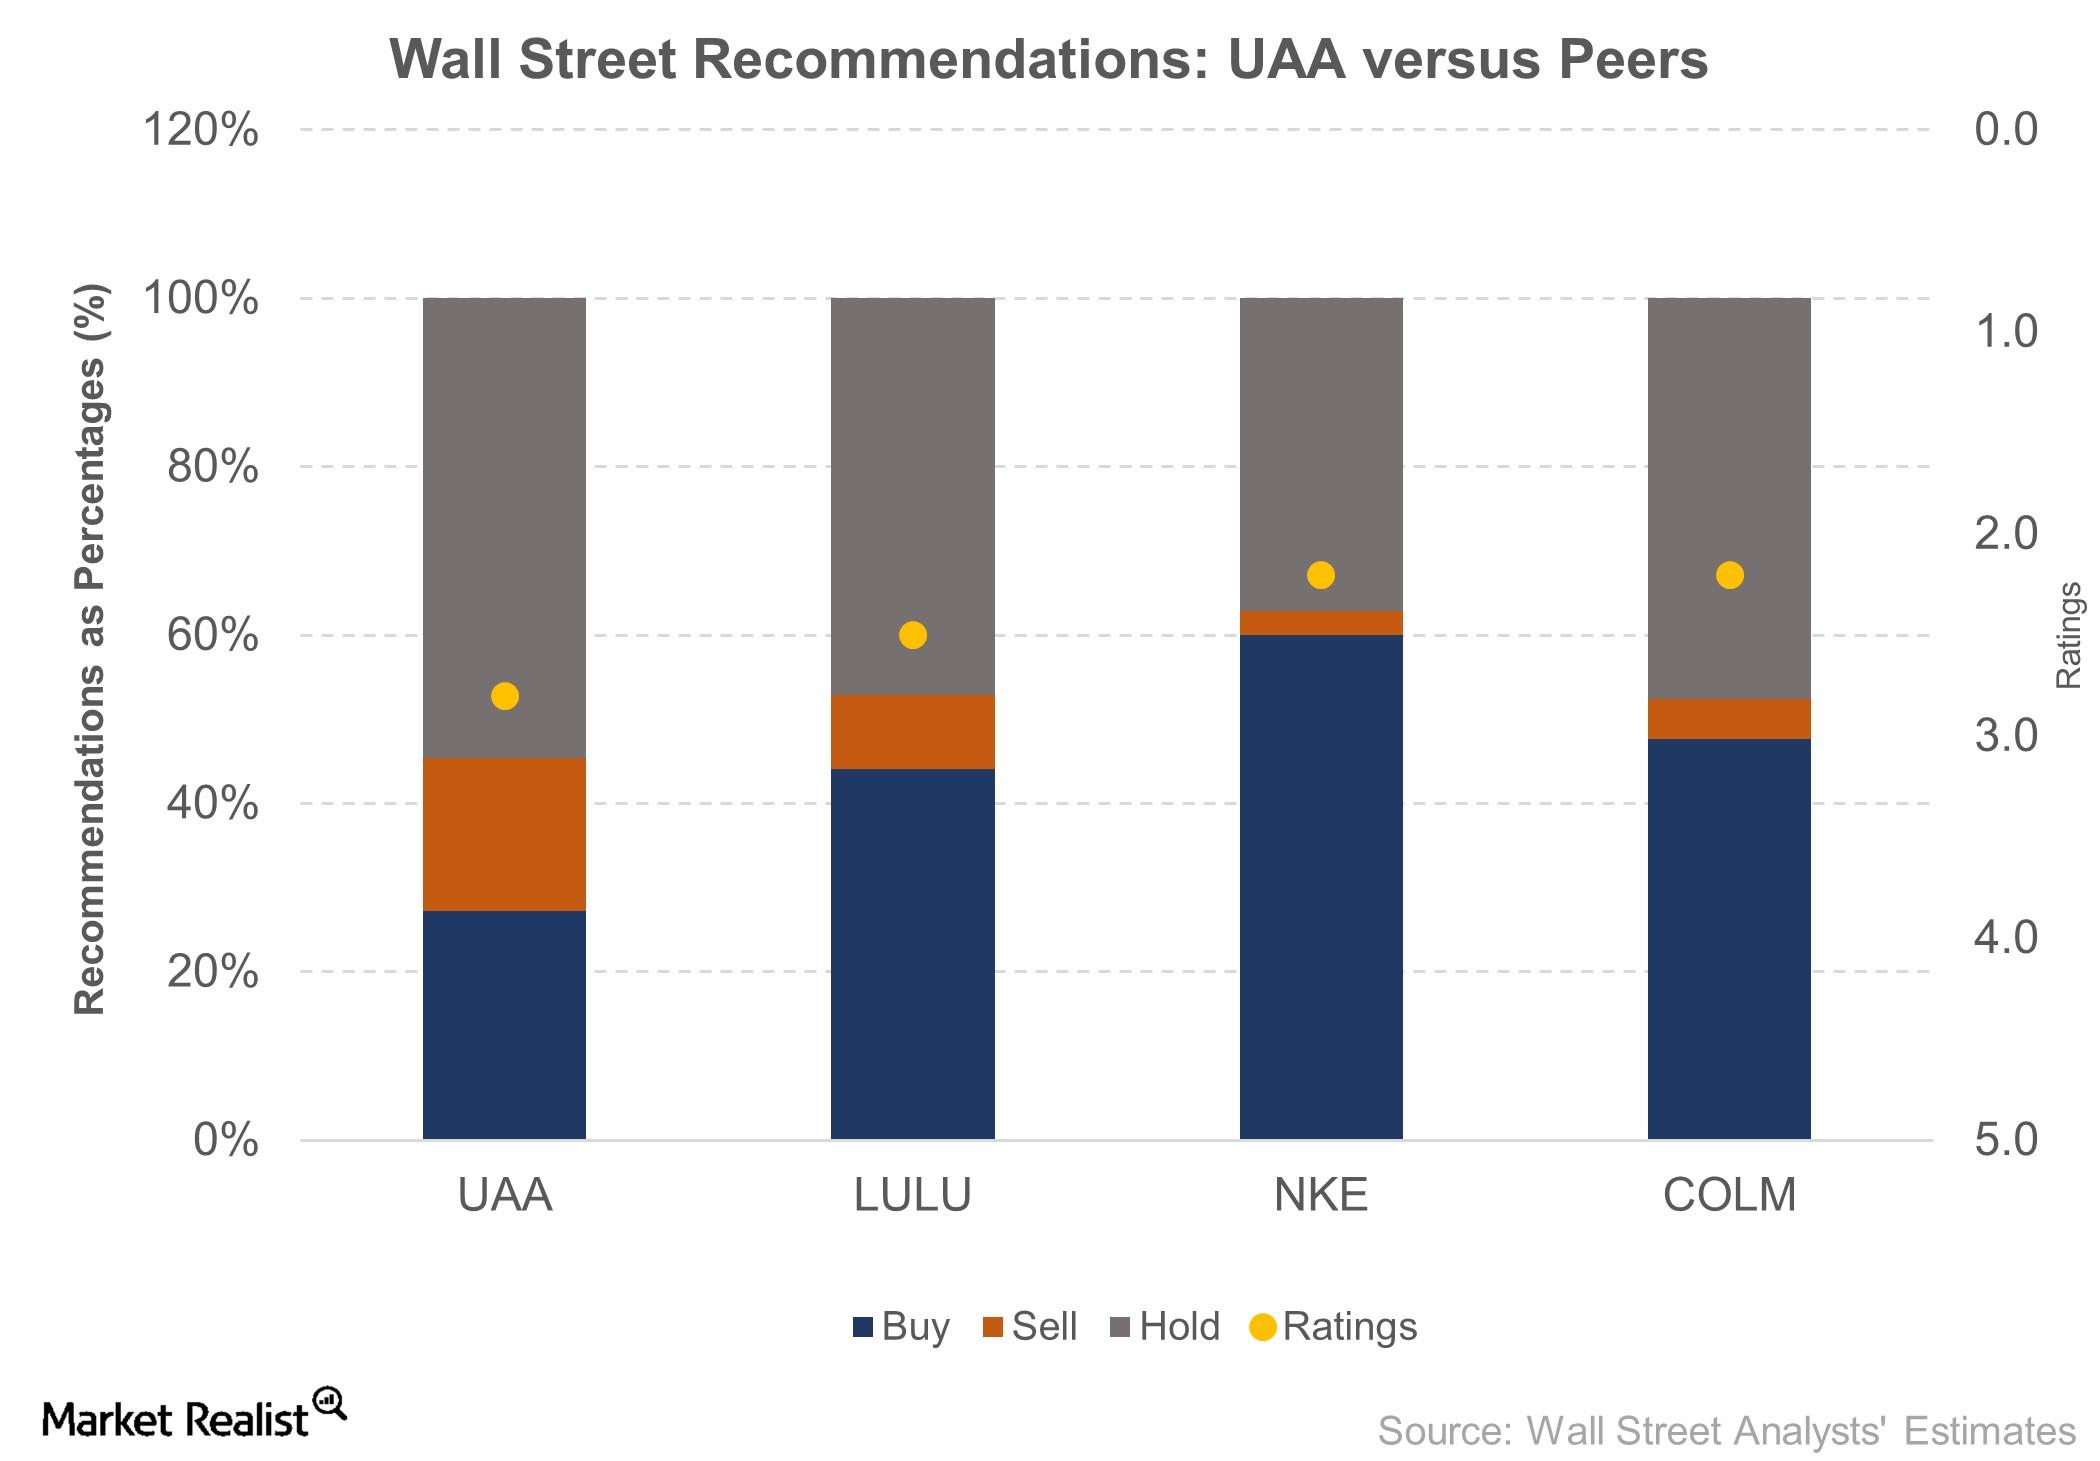
Under Armour’s Stock Surges after 1Q17 Earnings
Under Armour’s (UAA) stock rose 10% as the company reported better-than-expected 1Q17 top and bottom lines and maintained its fiscal 2017 guidance.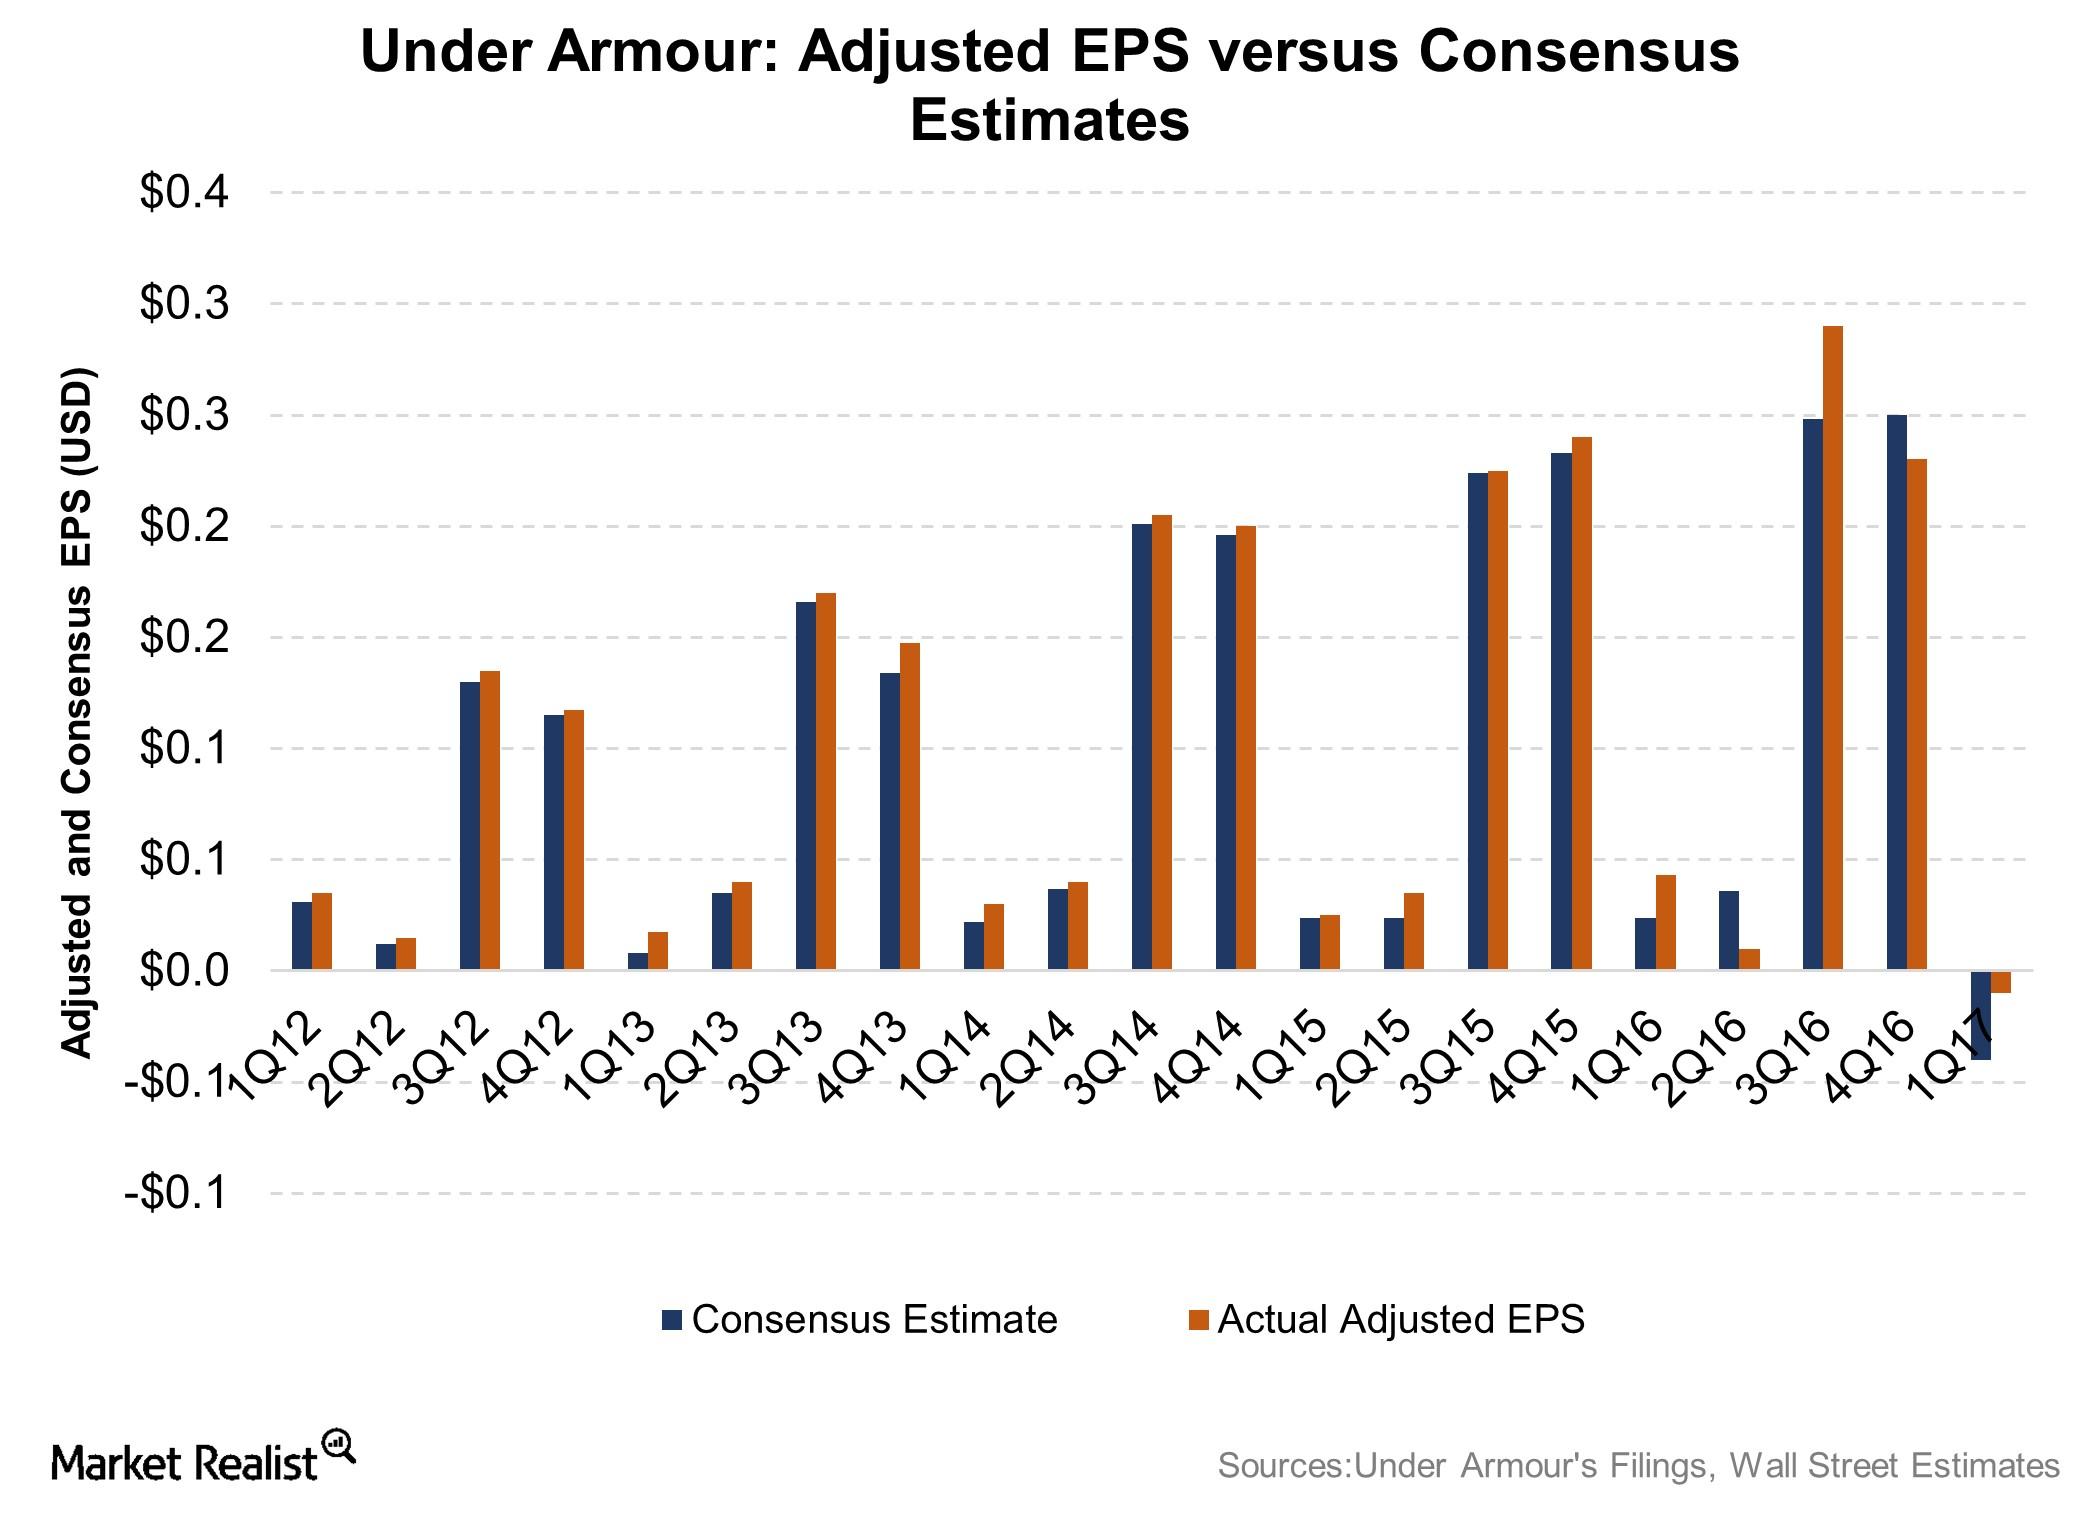
Under Armour Beats 1Q17 Earnings and Revenue
The Baltimore-based Under Armour (UAA) reported its results for 1Q17 on Thursday, April 27. Here’s what you need to know.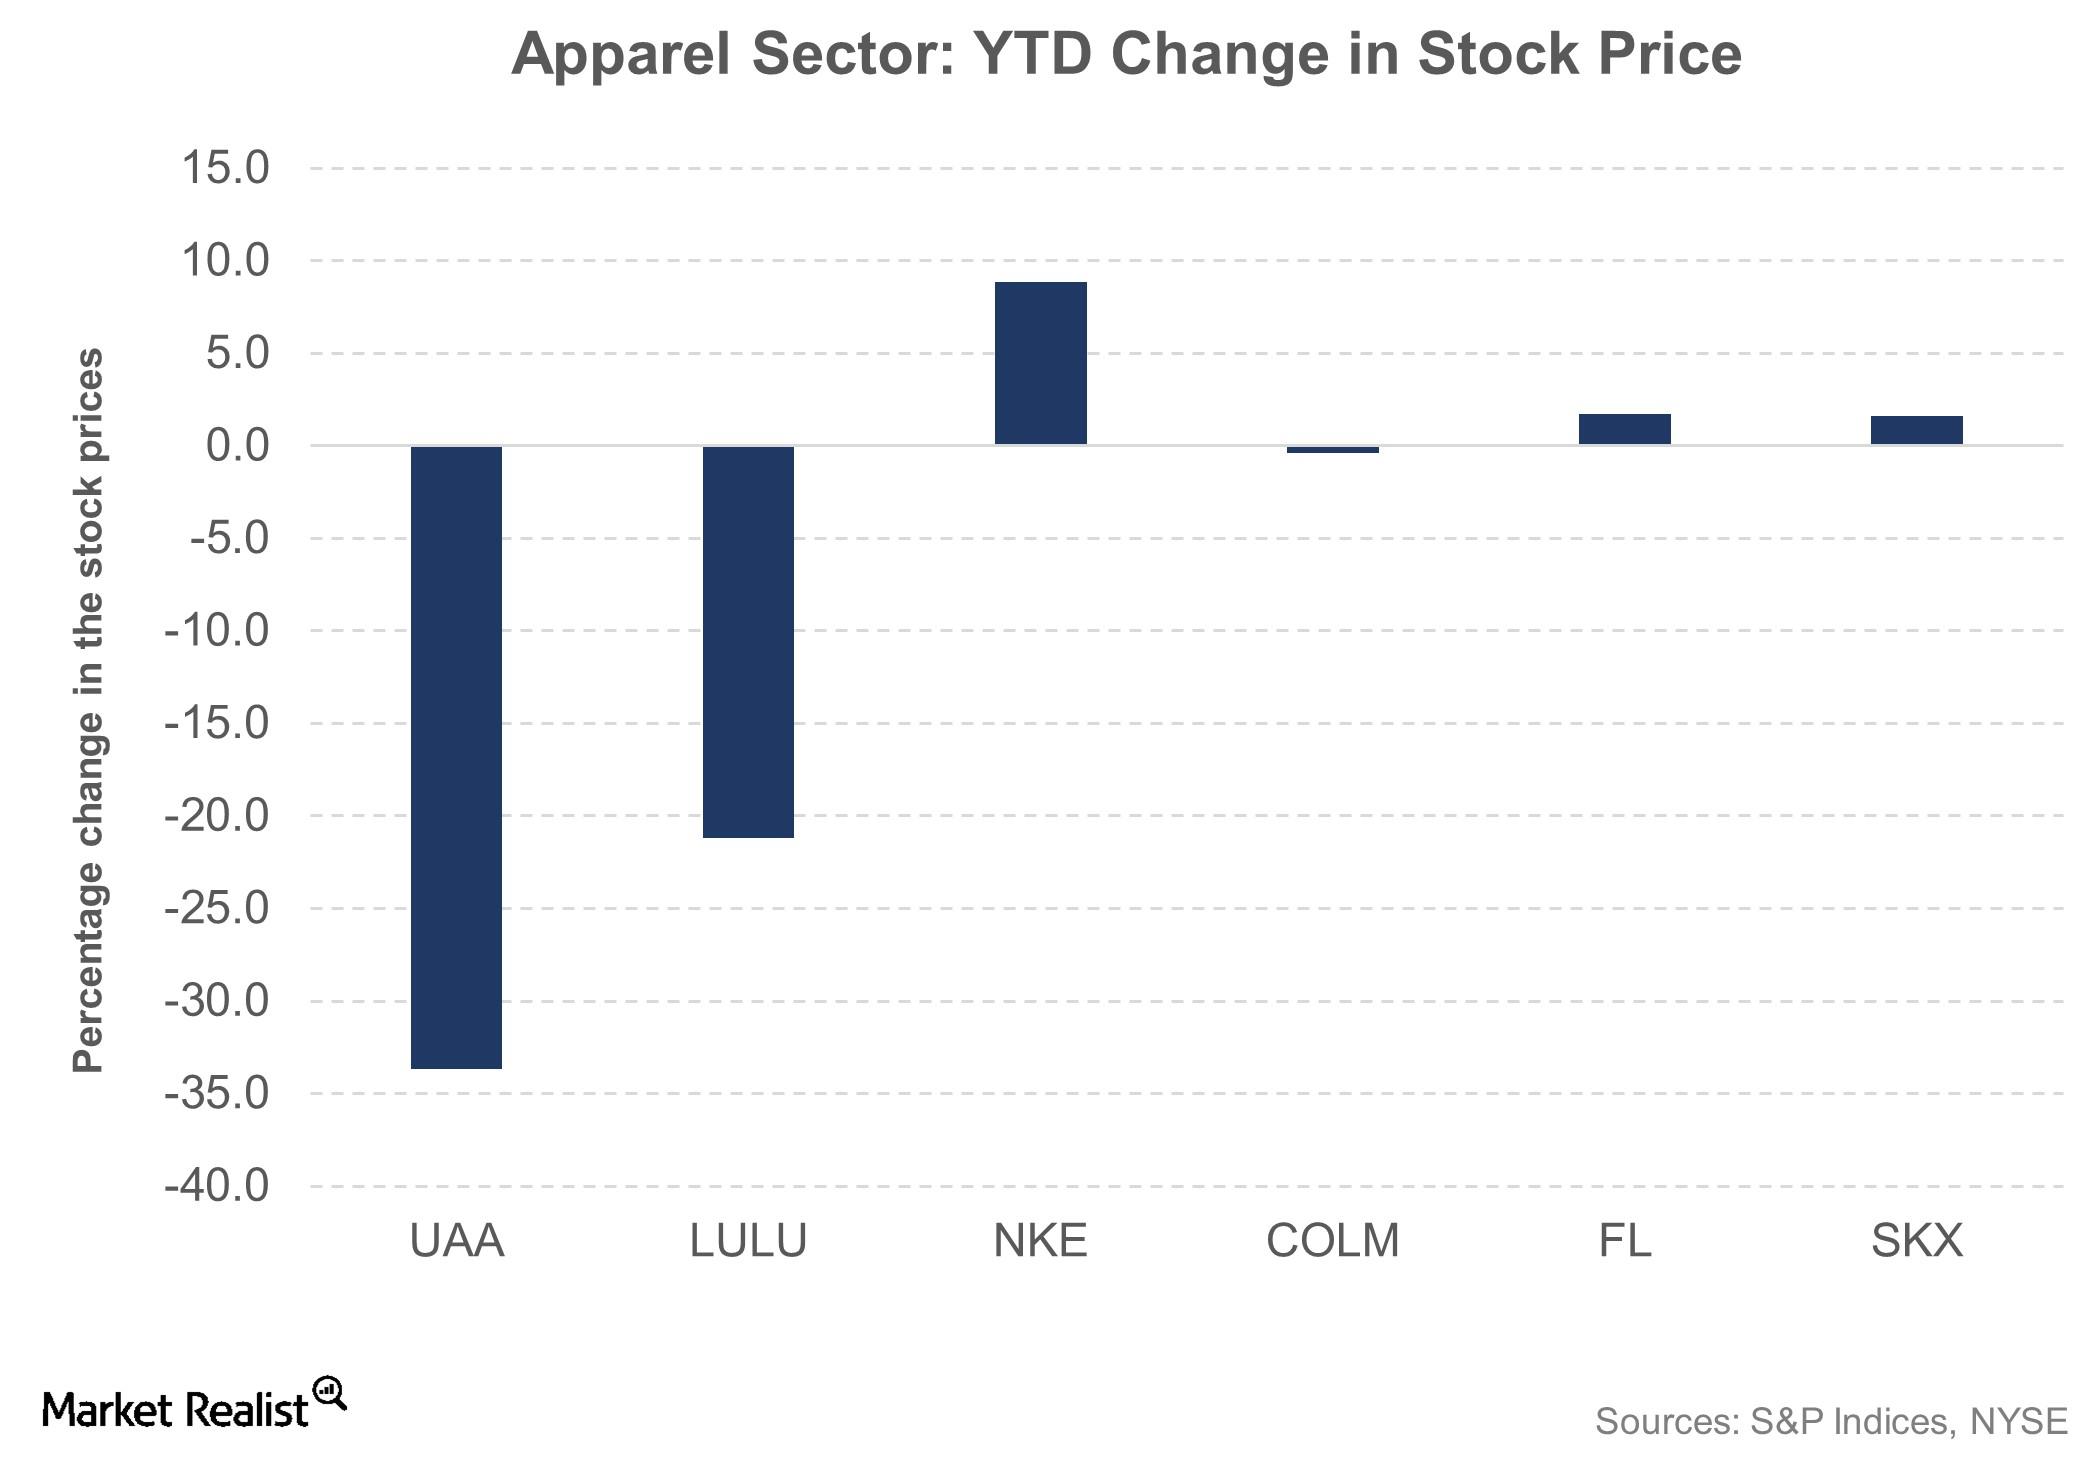
Behind Under Armour’s Poor Stock Performance
Under Armour (UAA) was among the worst performers on the S&P 500 Index (SPY) in 2016, losing 30% of its value during the year.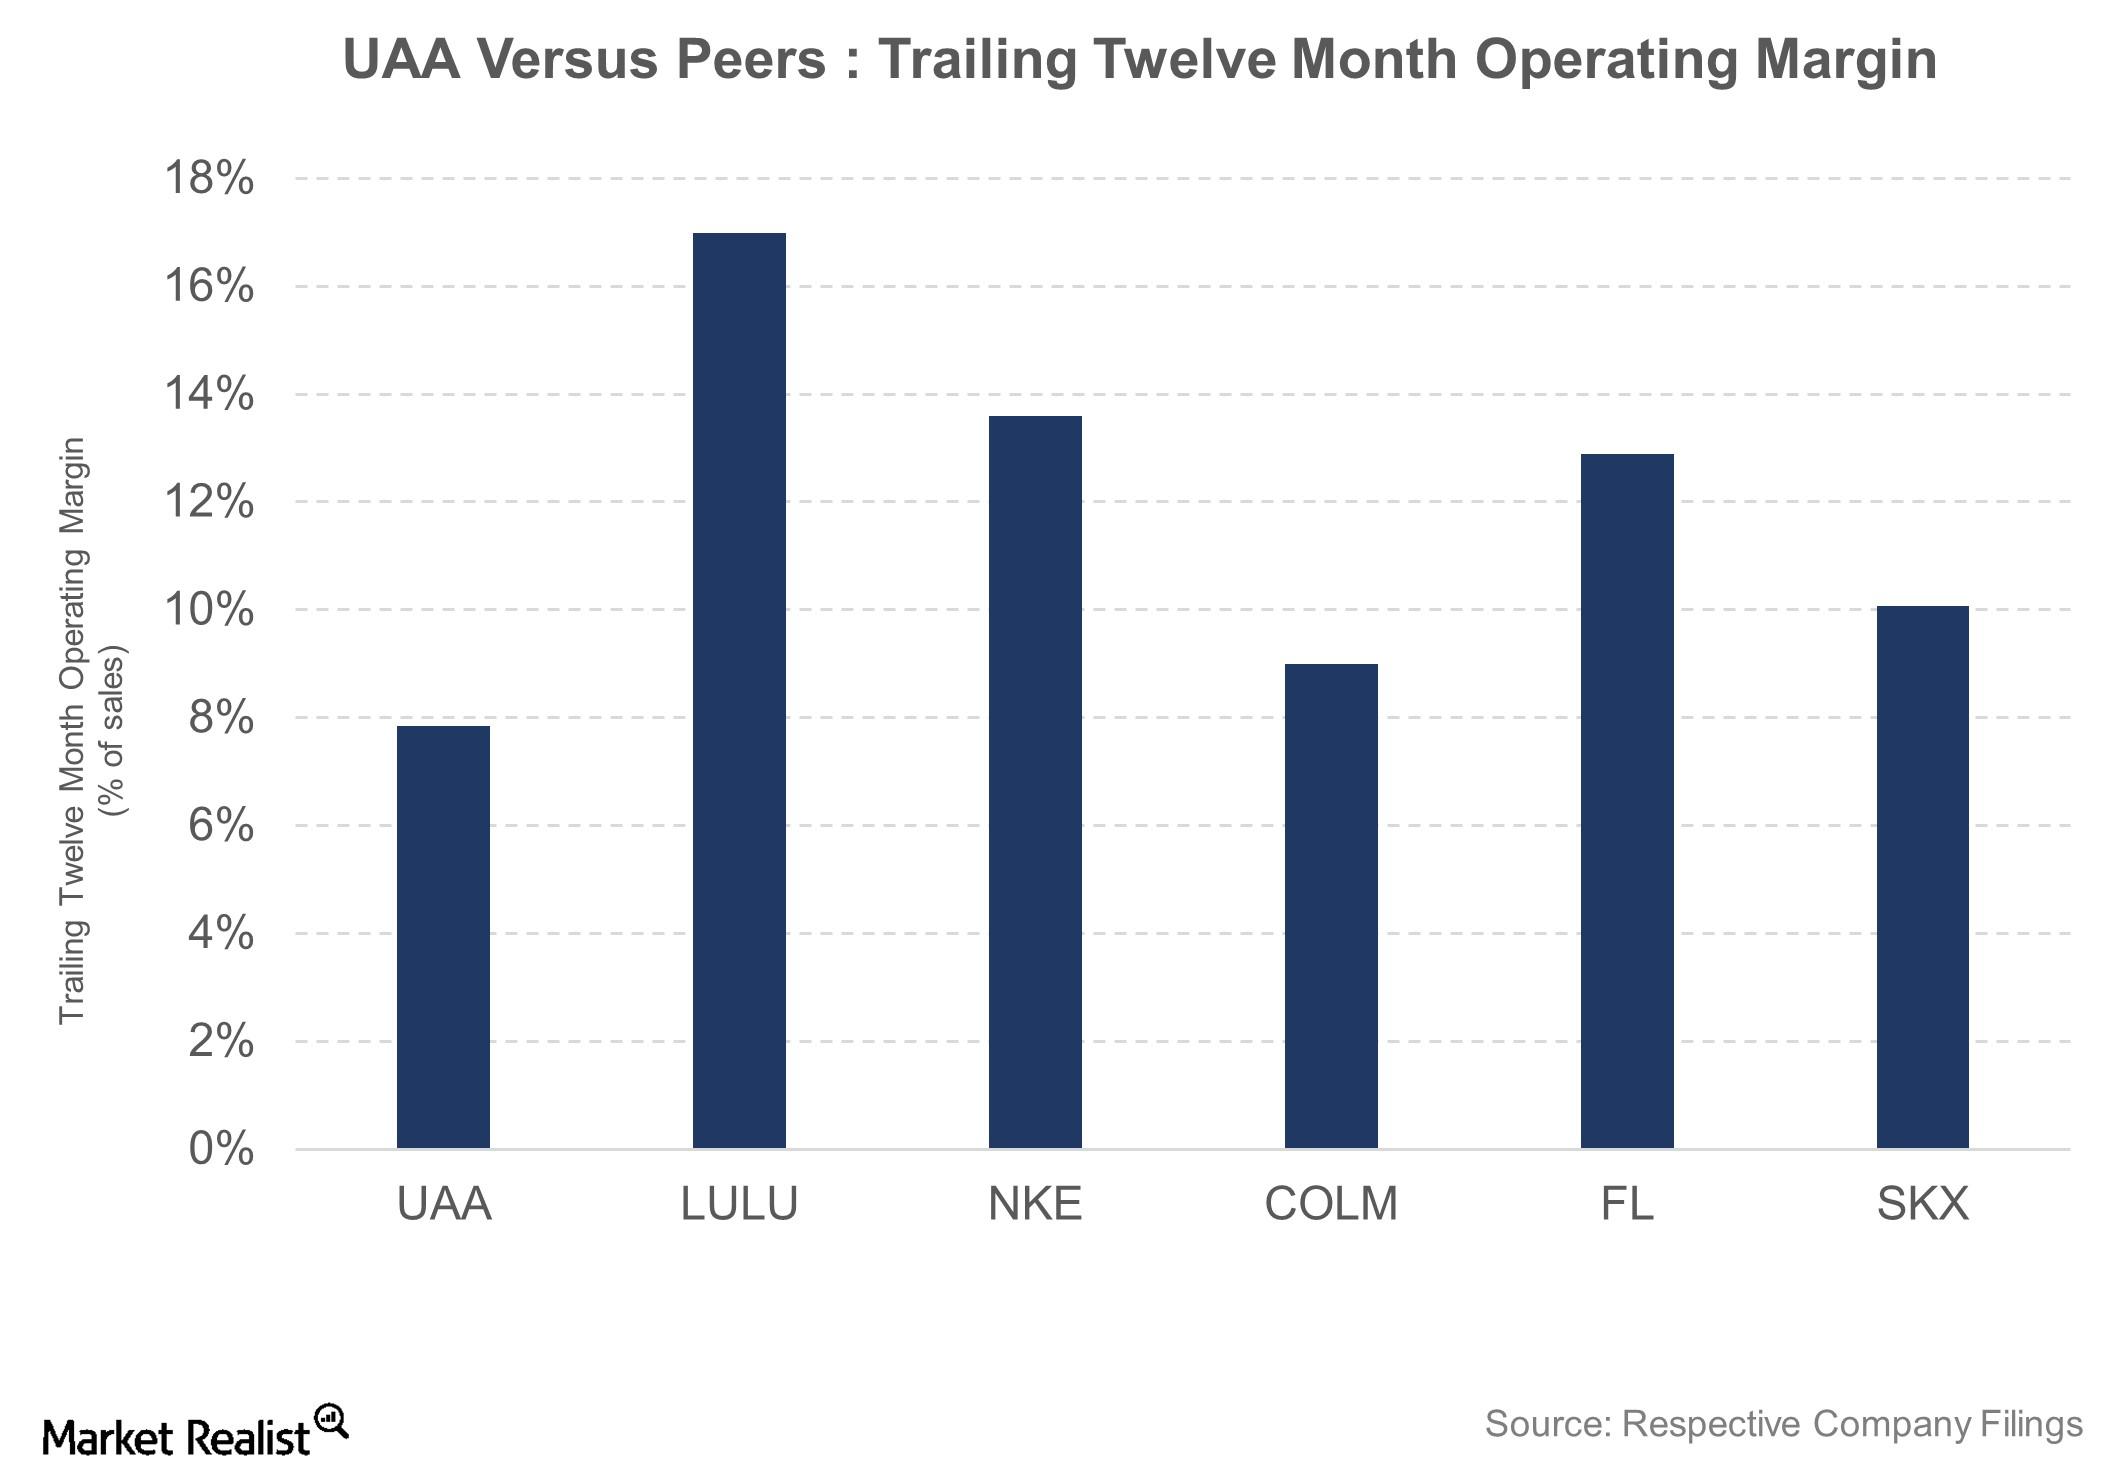
Underneath Under Armour’s Compressed Margins
Under Armour’s (UAA) gross margin fell 160 basis points to 46.5% in fiscal 2016, and its gross margin took the worst hit in the fourth quarter of 2016.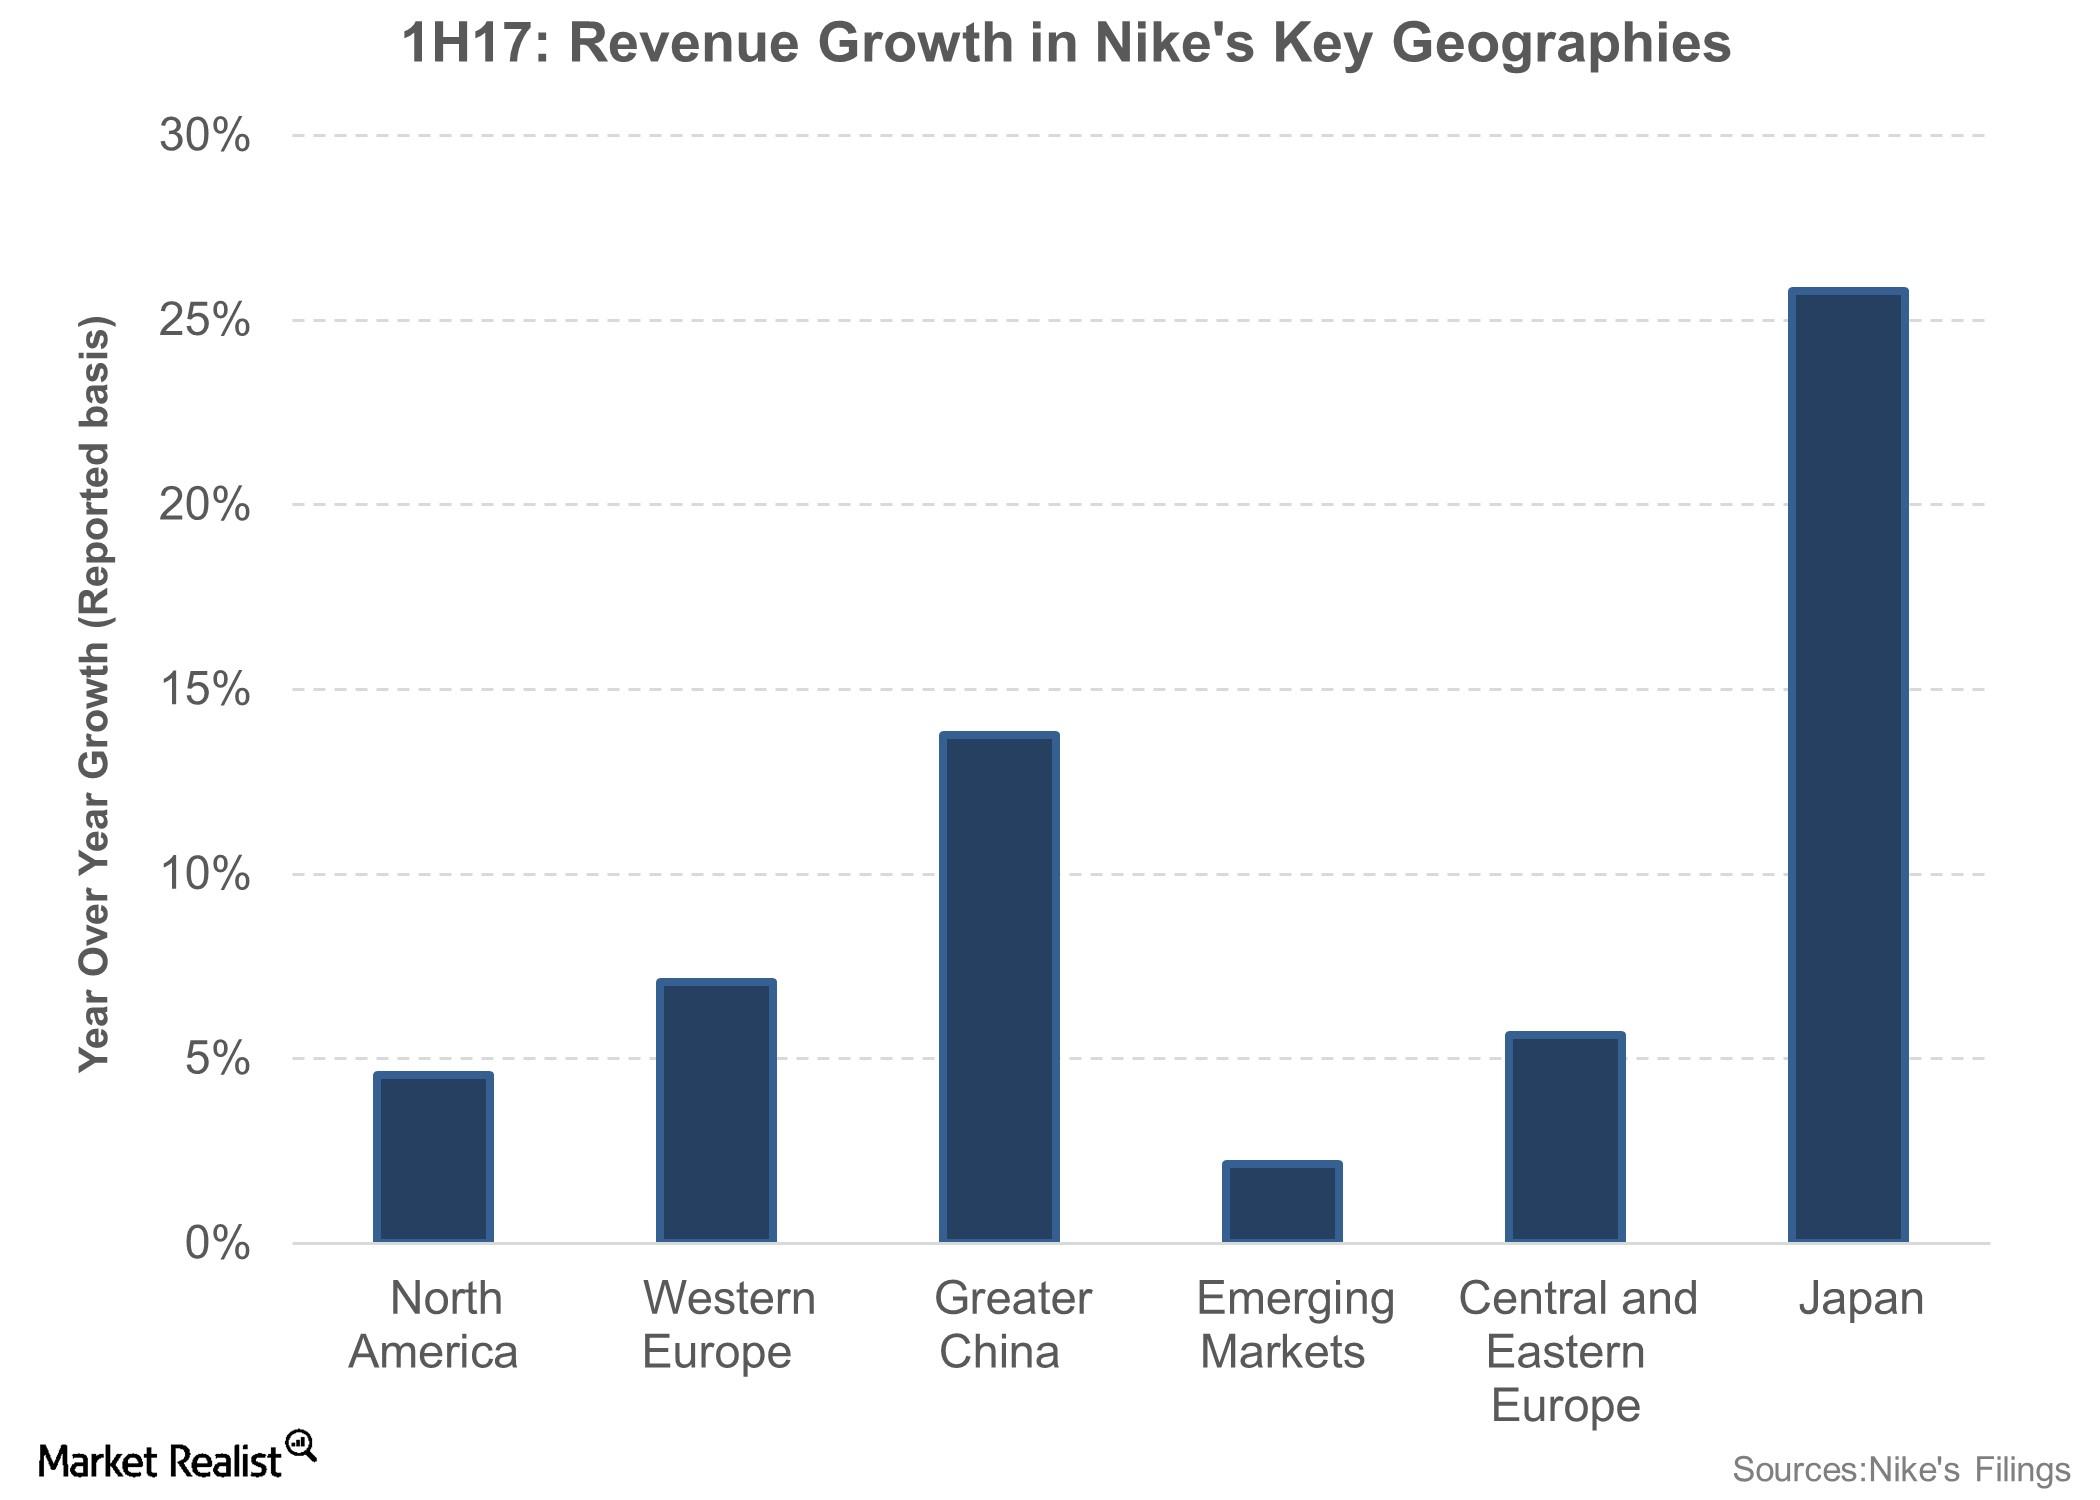
What Are Nike’s Key Markets?
Nike’s top-line growth in 1H17 was fueled by strong performances in its international markets.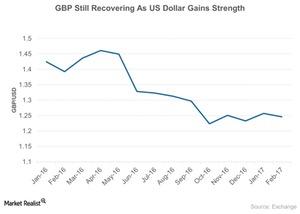
How Currencies Have Reacted since the Brexit Decision
The British pound (FXB) (GBB) is trading at 31-year low of 1.25 as of February 2017, its lowest level since 1985. The currency fell ~11% in 2016.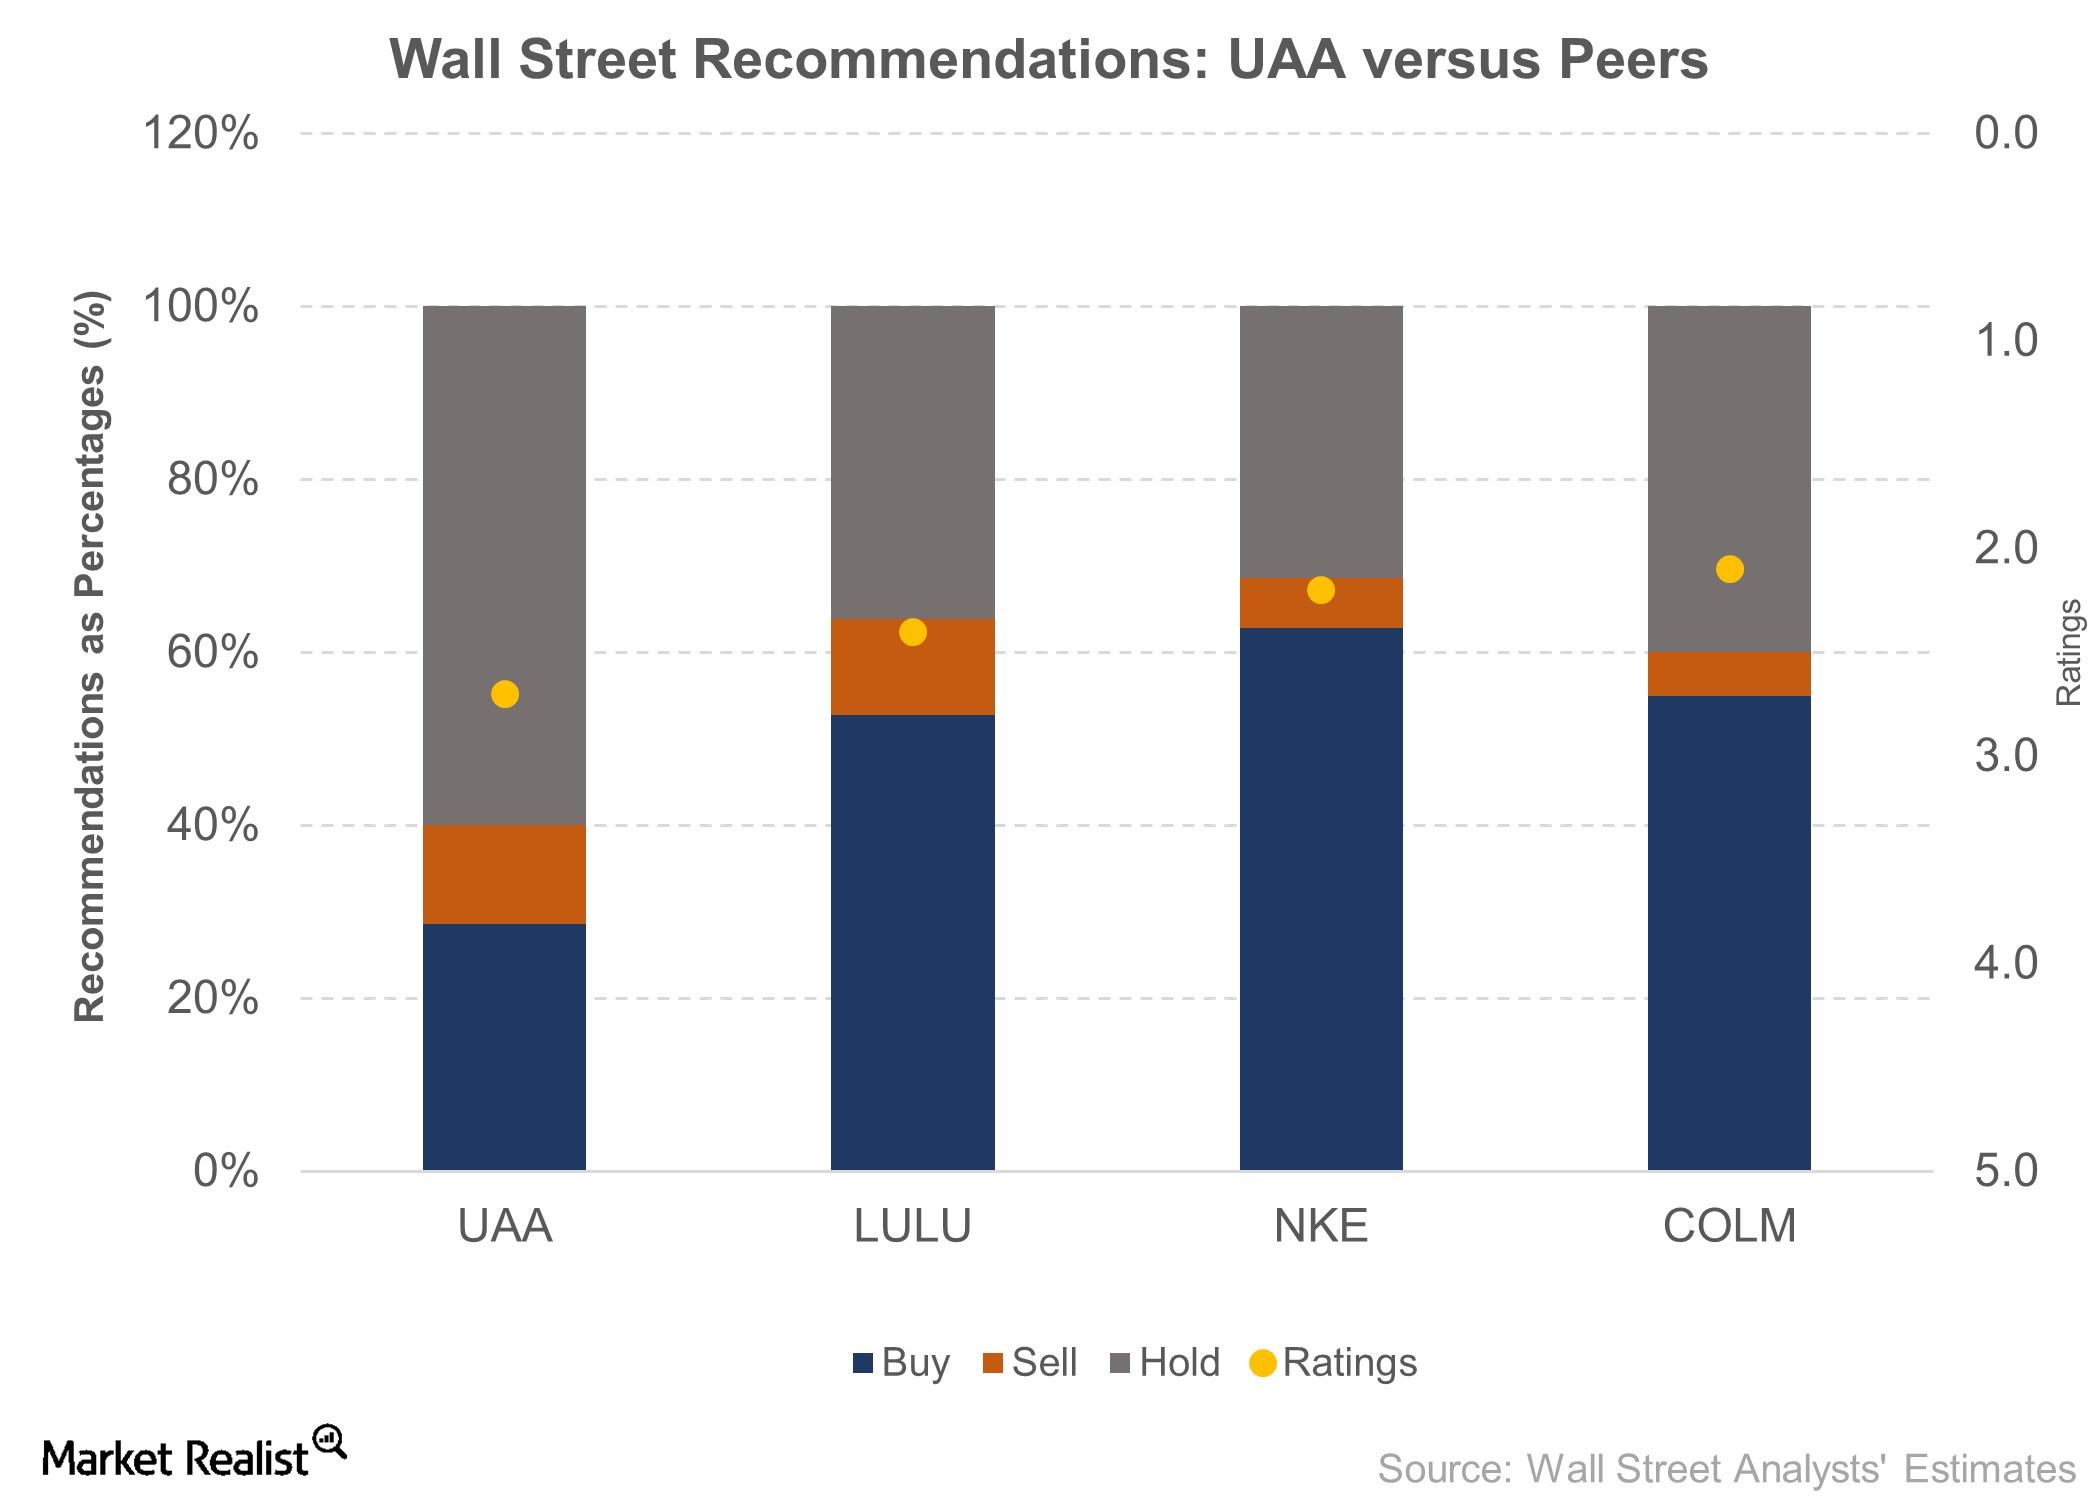
Under Armour Stock Lost 29% during the Week after Its 4Q16 Results
Under Armour (UAA), which is covered by 35 Wall Street analysts, has ten “buy” recommendations, four “sell” recommendations, and 21 “hold” recommendations.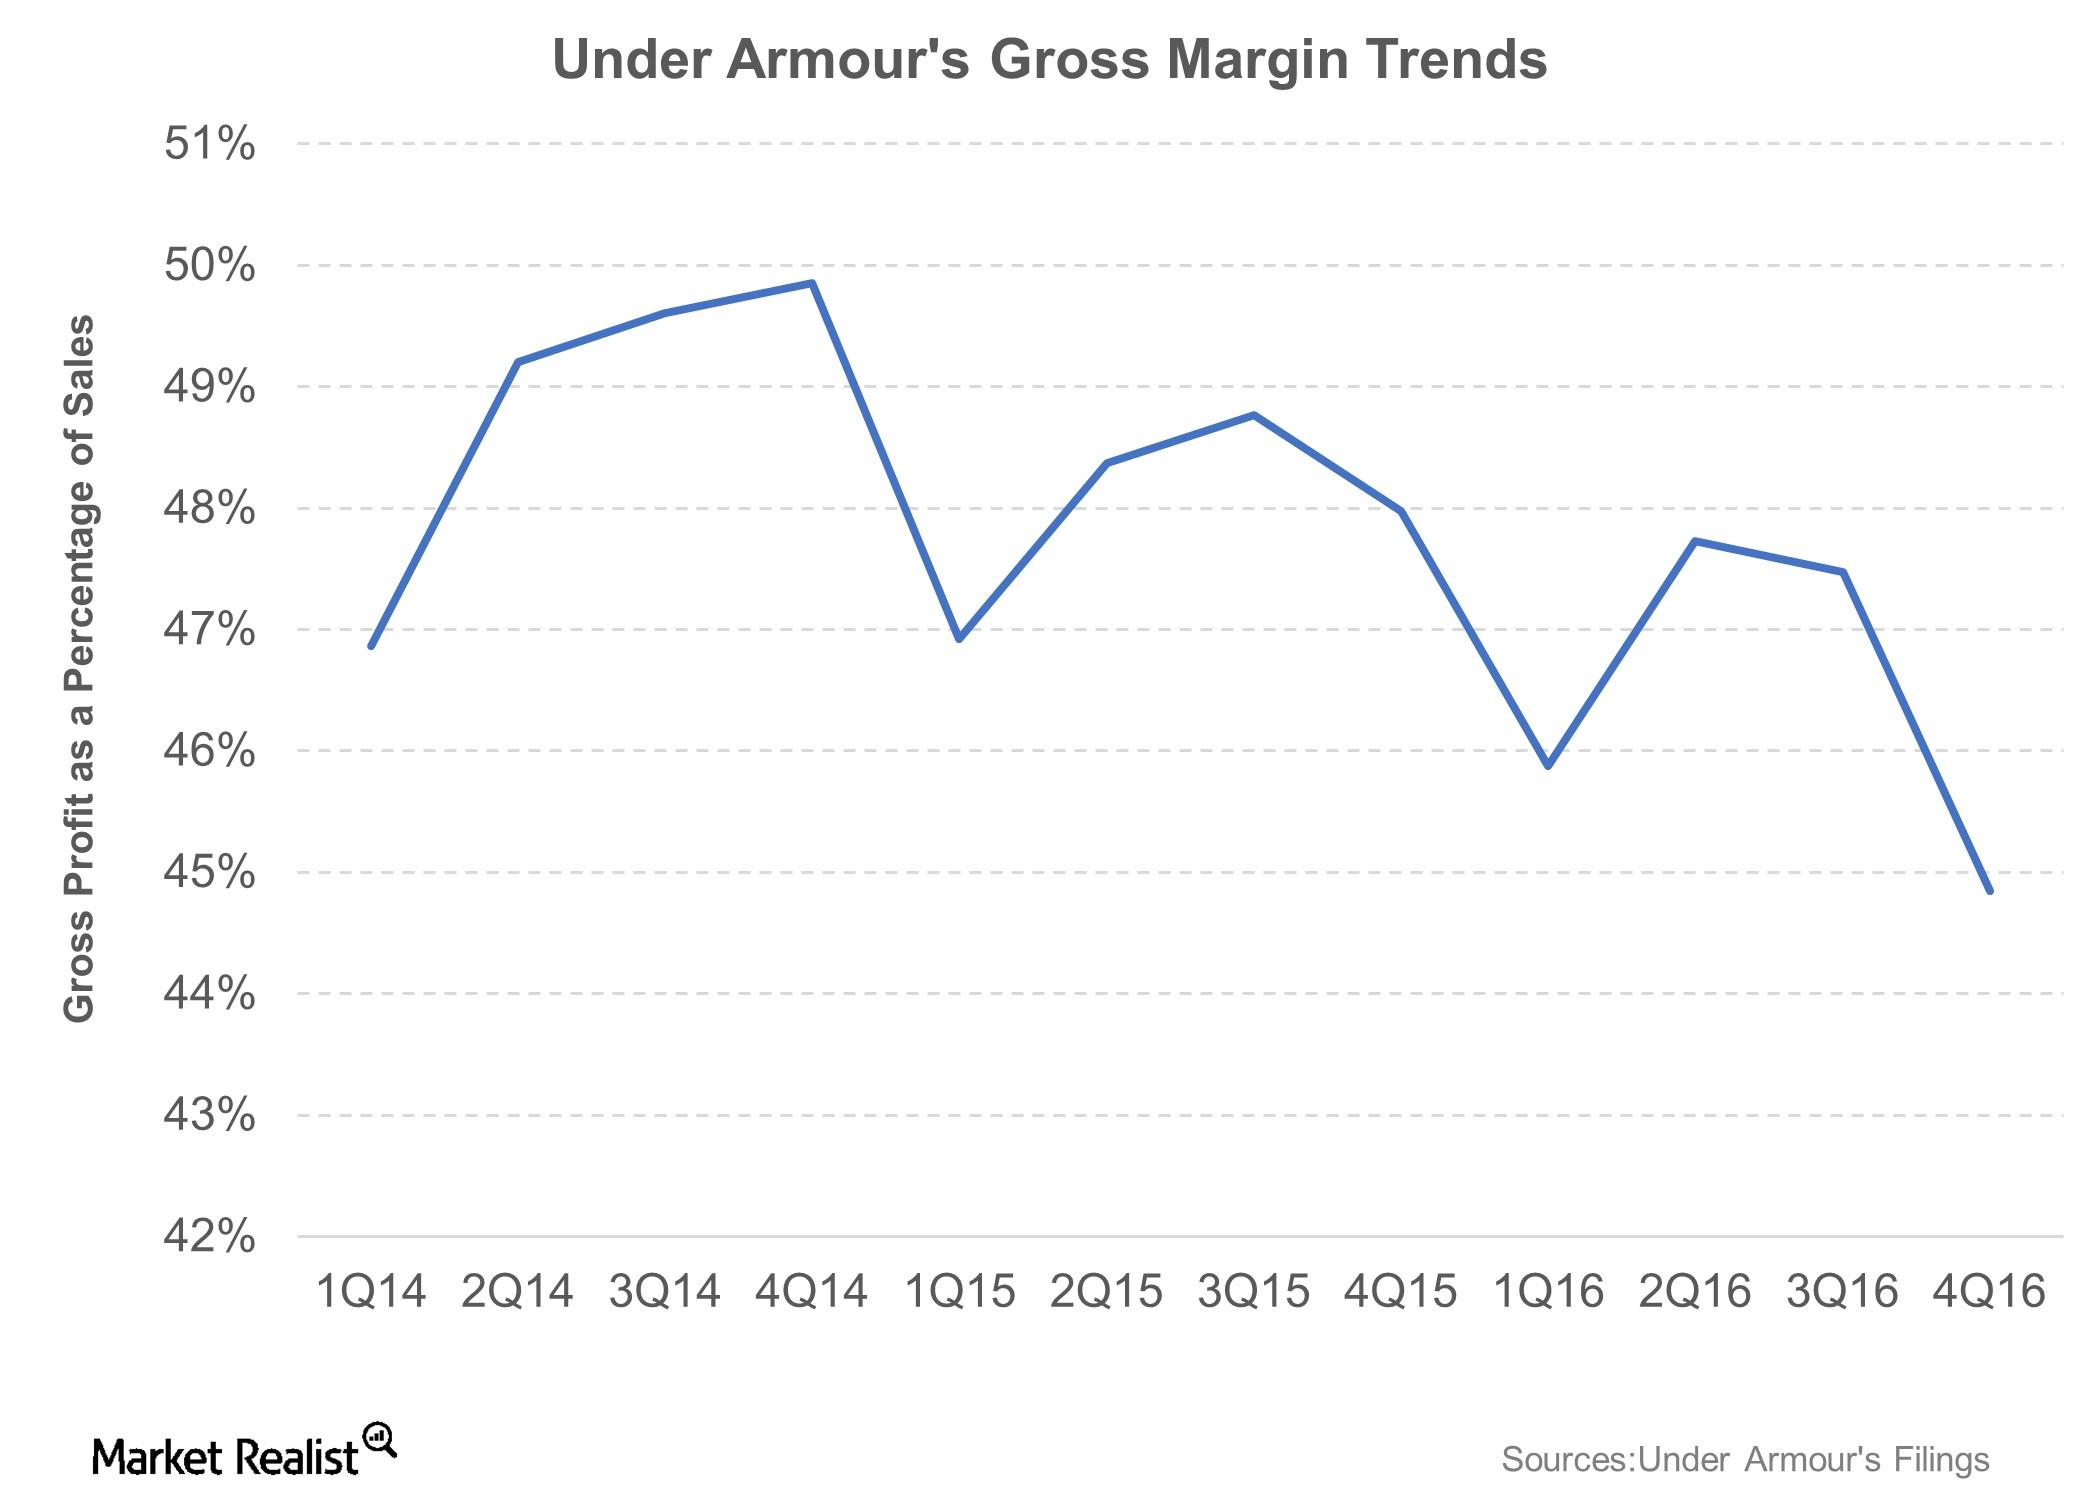
What Hampered Under Armour’s 4Q16 Profitability?
In 4Q16, Under Armour’s adjusted earnings per diluted share stood at $0.23, which was $0.02 lower than what analysts were expecting.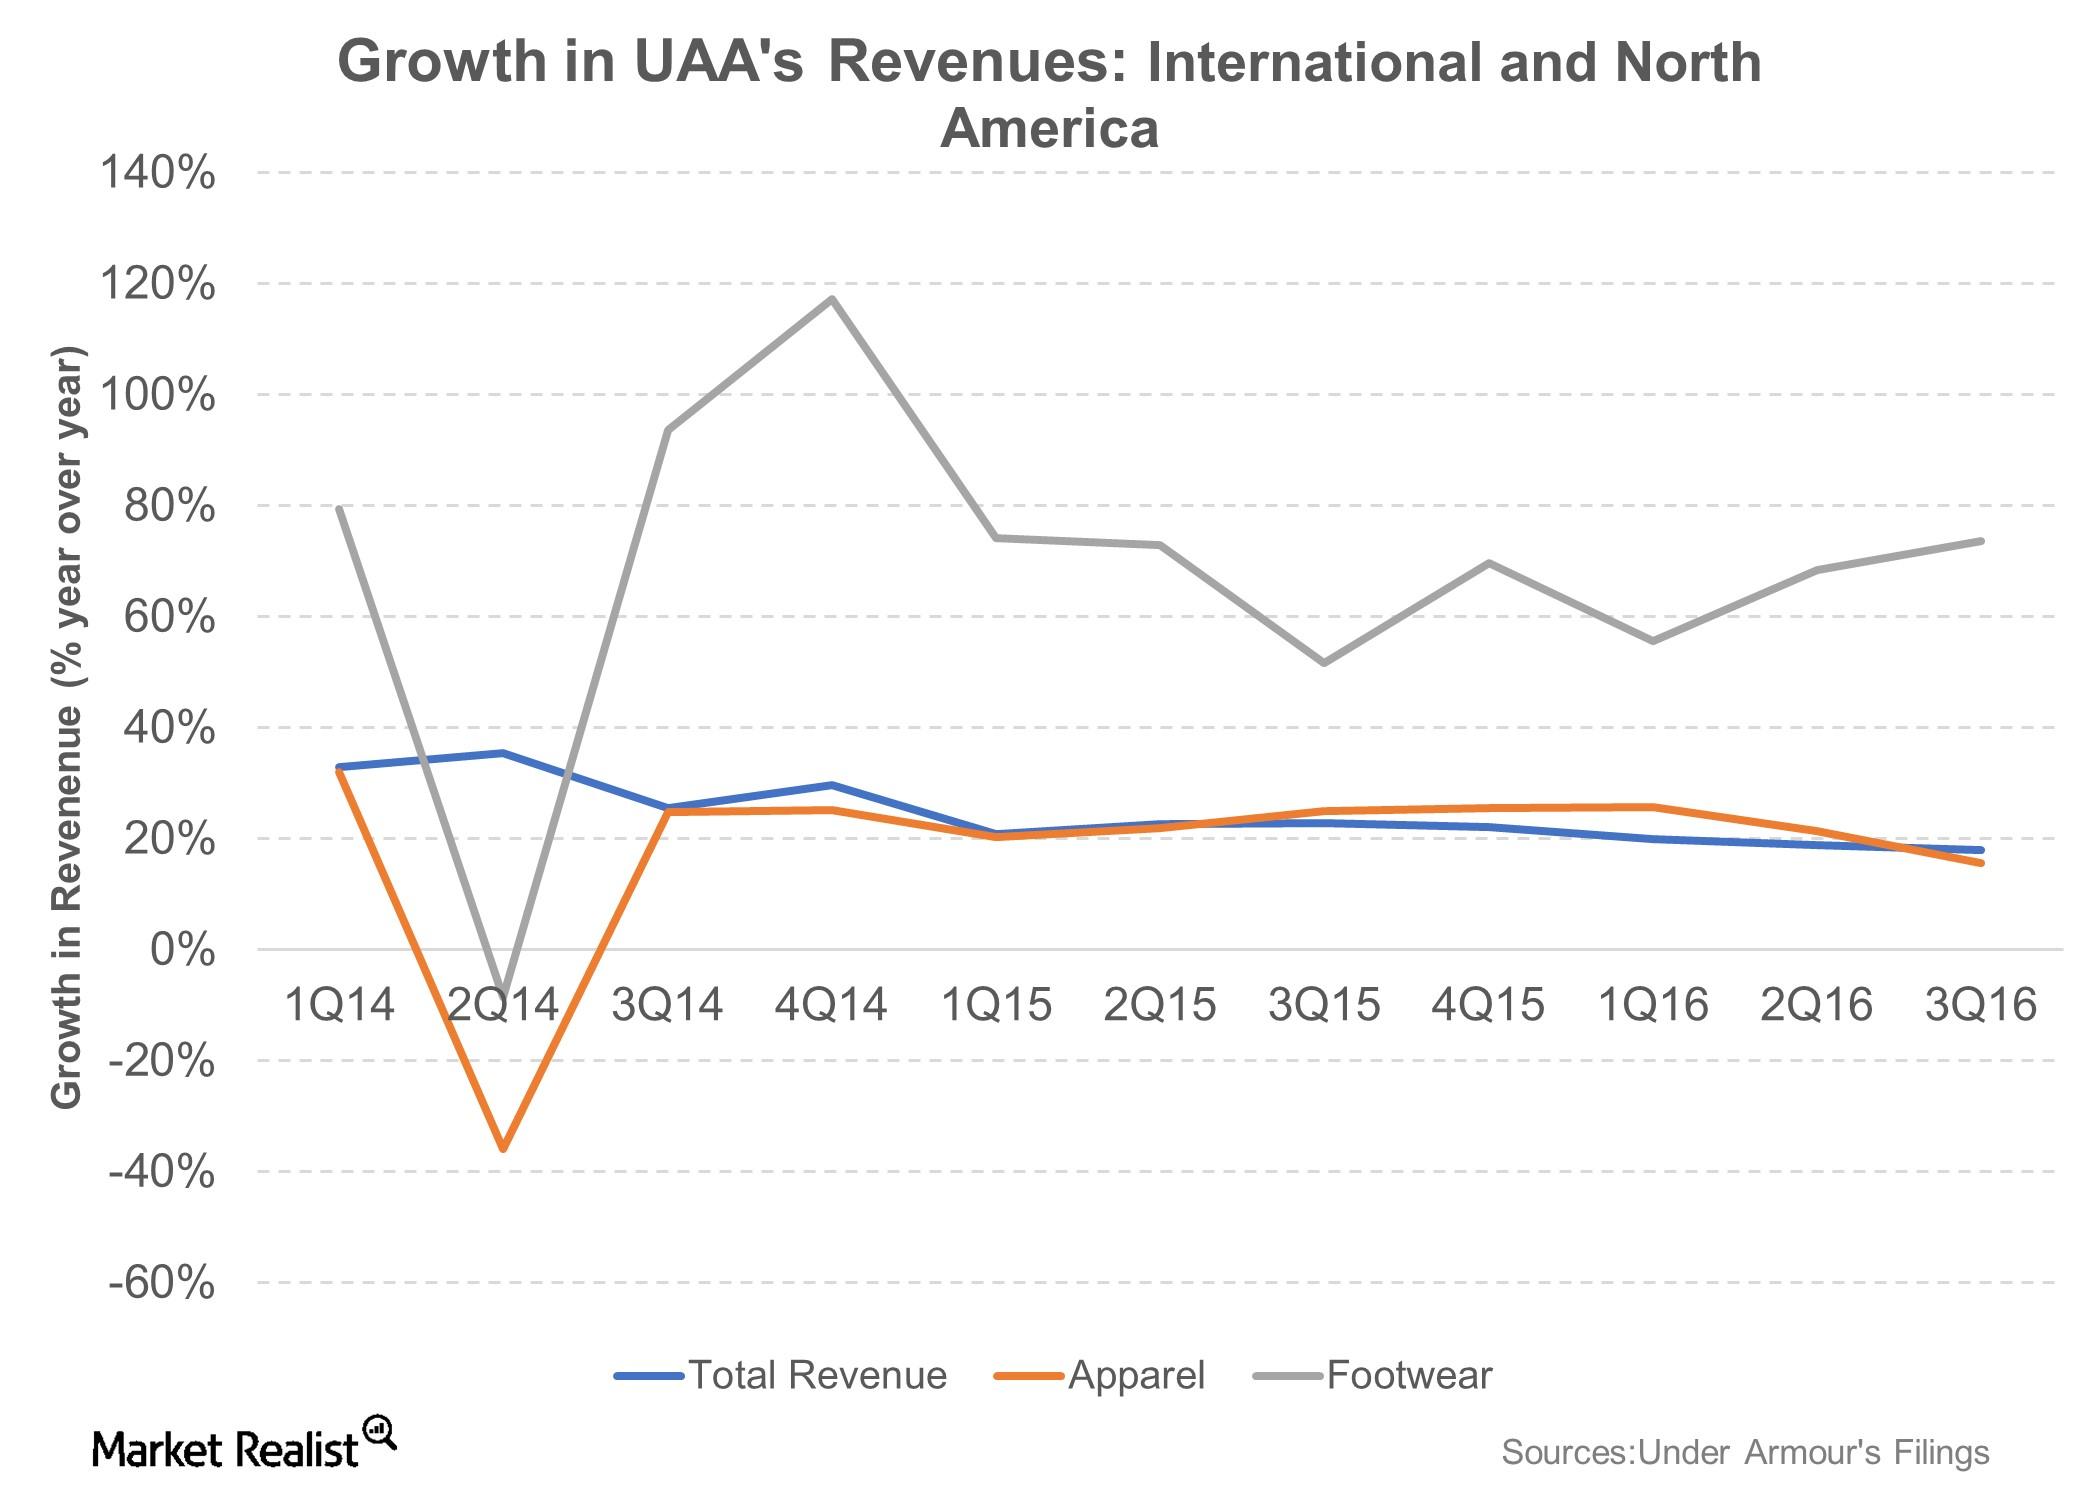
Under Armour Plans to Expand Its International Presence
International sales account for about 15.0% of UAA’s total sales compared to less than 6.0% in fiscal 2013. It has plans to further expand that business.
What’s Nike’s Dividend Policy?
Nike (NKE) is a consistent dividend payer and has increased dividends over the last 14 years.
Under Armour Announces a Change in Its Ticker Symbols
Under Armour (UA) fell 1.9% to close at $30.03 per share during the fifth week of November 2016.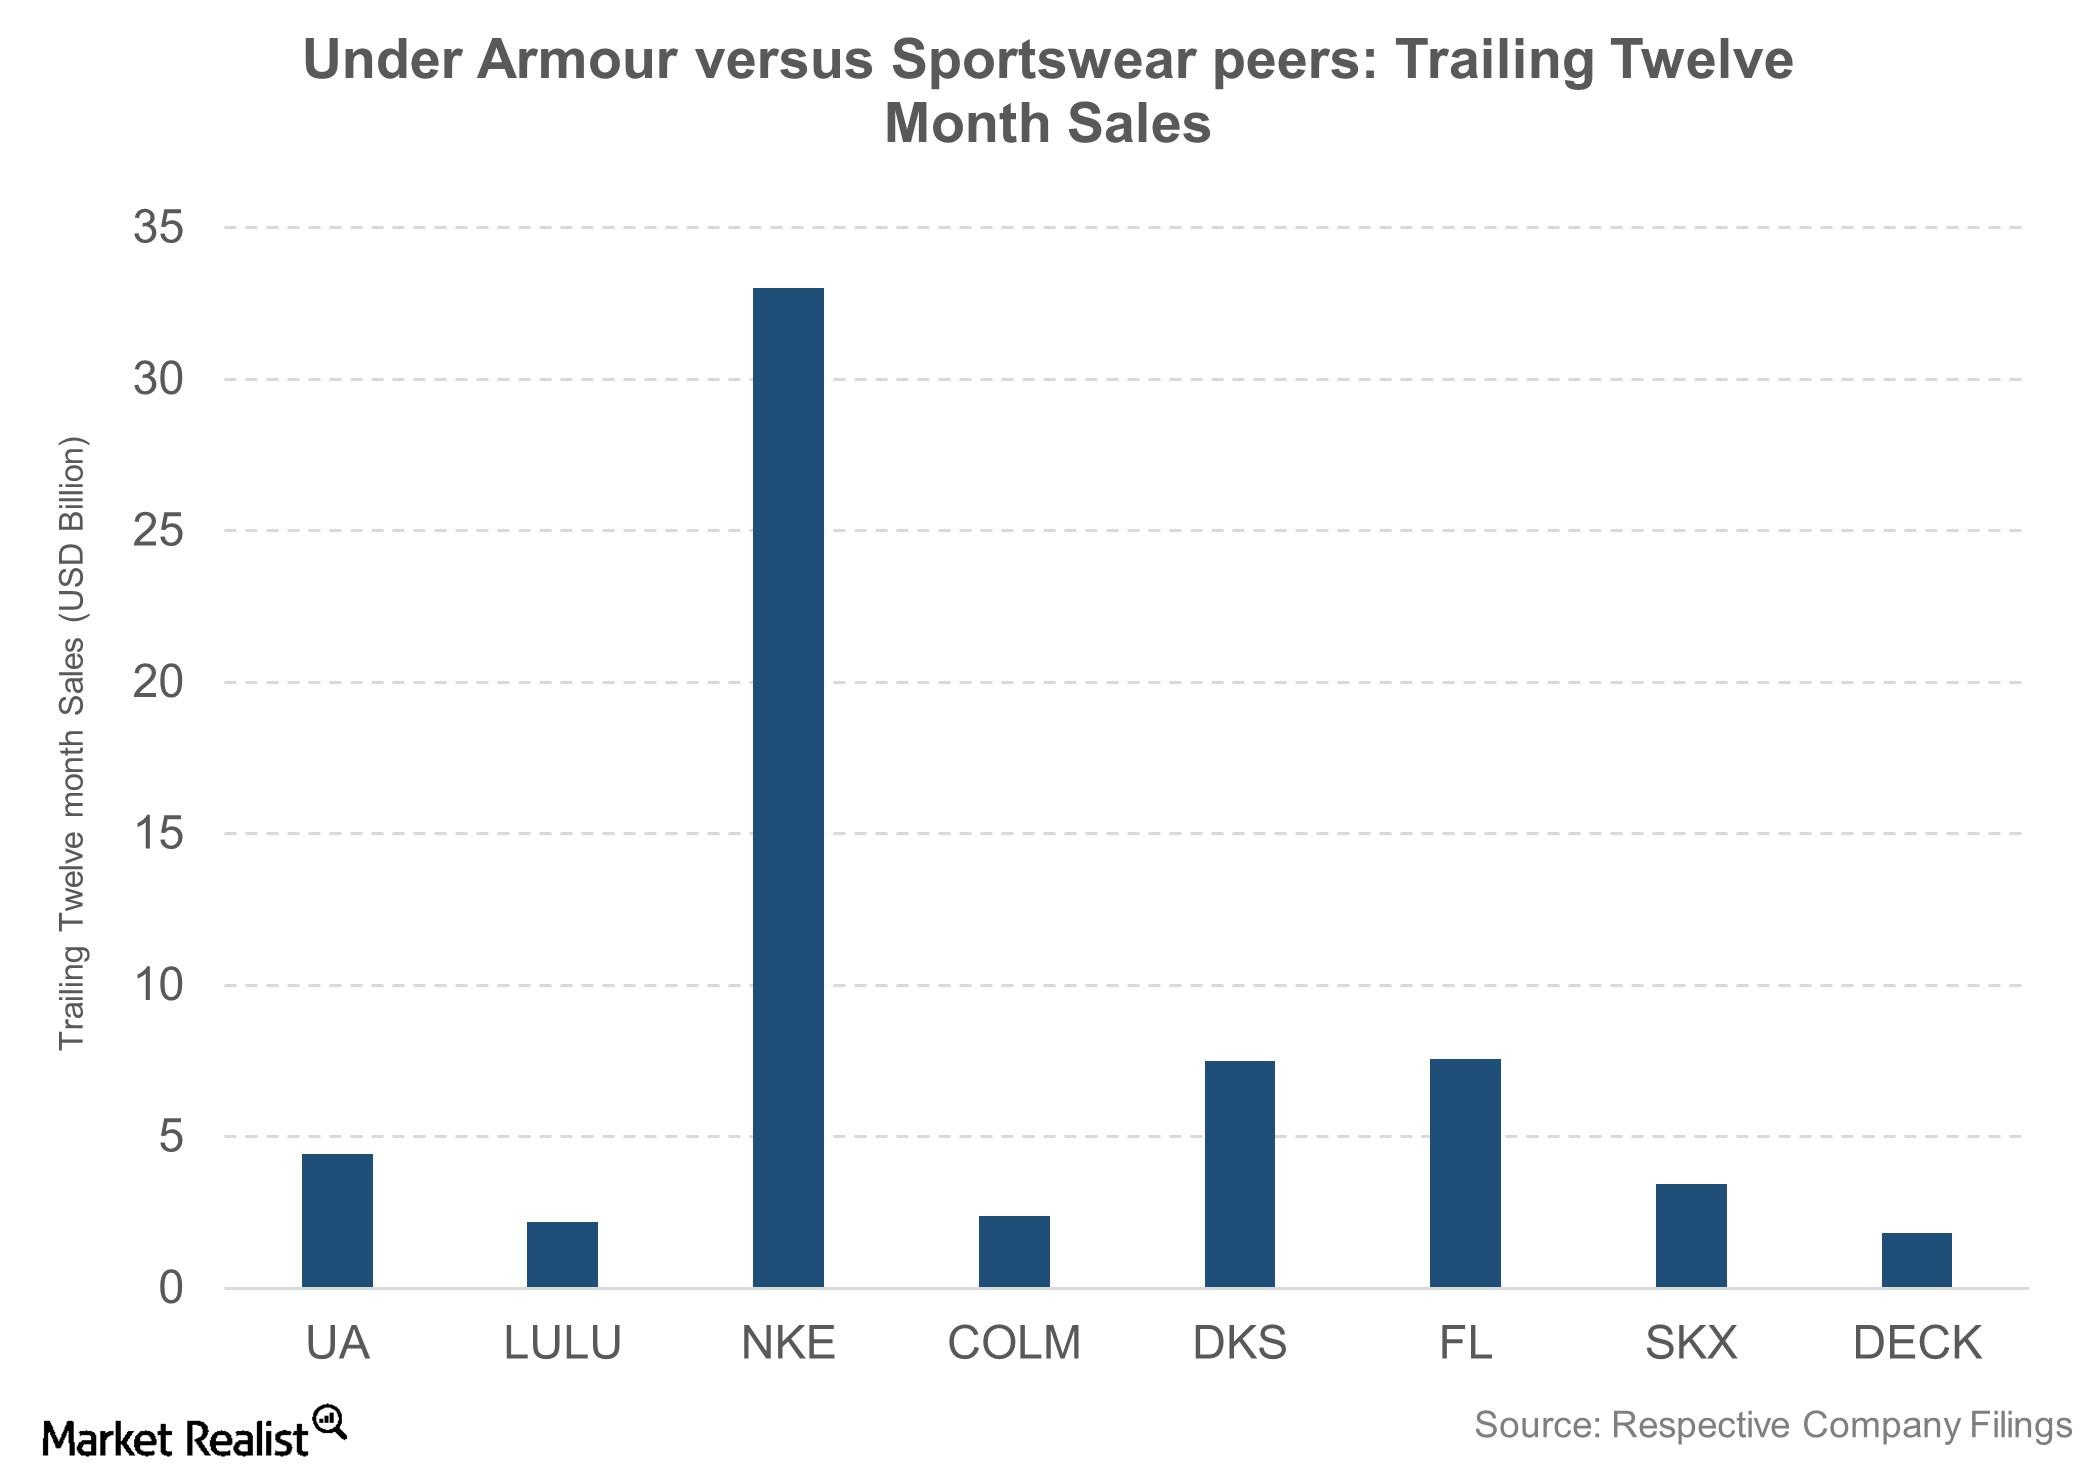
Nike May Have Jordan, but Under Armour Boasts Phenom Curry
Although it’s a relatively new player in the sportswear industry, Under Armour has given tough competition to industry pioneers such as Nike (NKE) and Adidas (ADDYY).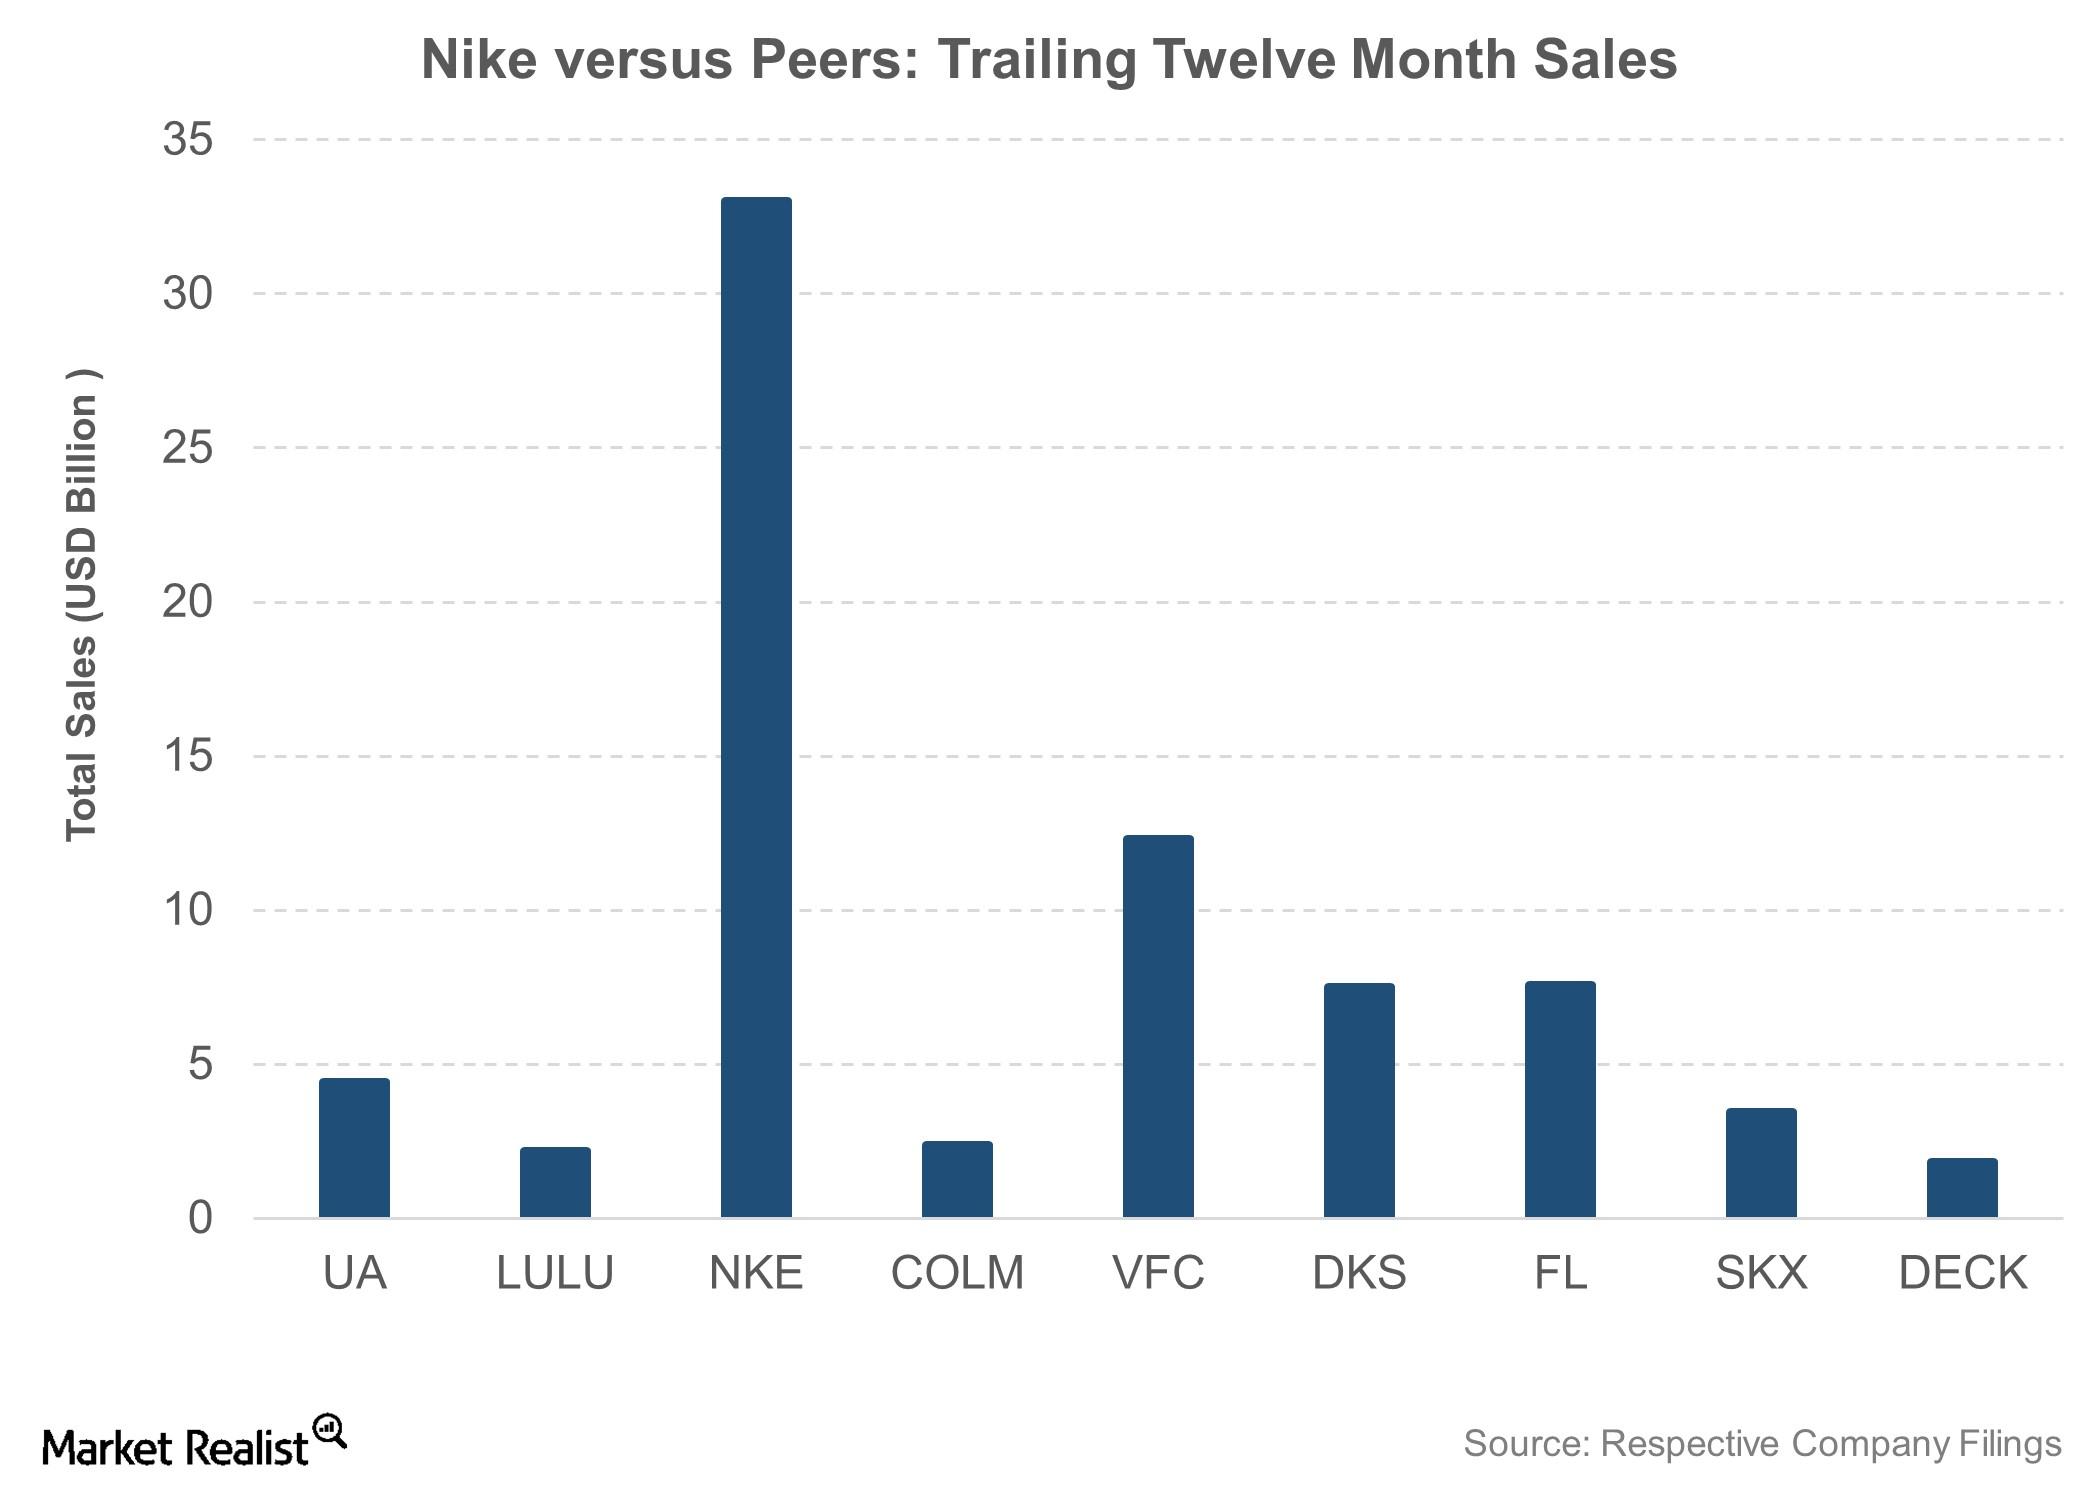
Why Star Power and Sponsorships Are Key for Nike
Endorsement deals and sponsorships have been key for Nike since the beginning.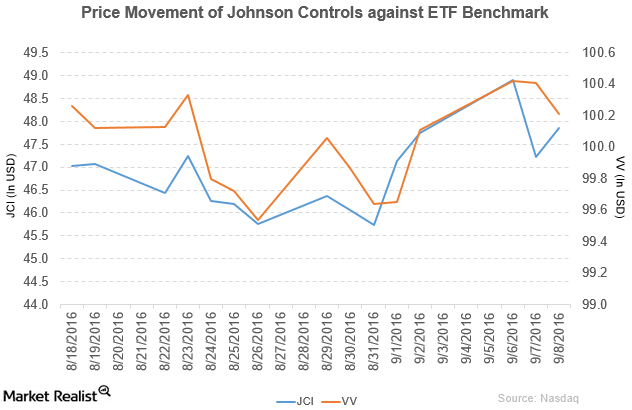
Macquarie Upgrades Johnson Controls to ‘Outperform’
Johnson Controls (JCI) has a market cap of $30.9 billion. It rose by 1.4% to close at $47.86 per share on September 8, 2016.
Why Did Nike Update Its Nike+ Run Club App?
In fiscal 2016, Nike reported revenue of $32.4 billion—a rise of 5.9% year-over-year. The company’s gross profit margin rose by 0.43% in fiscal 2016.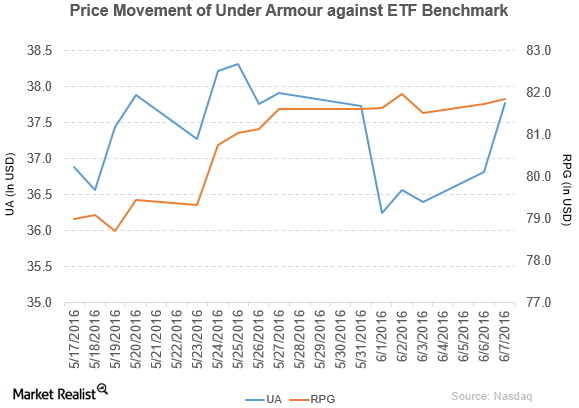
What Boosted Under Armour on June 7?
Under Armour rose by 2.6% to close at $37.77 per share on June 7. Its weekly, monthly, and YTD price movements were 0.11%, -2.4%, and -6.3%, respectively.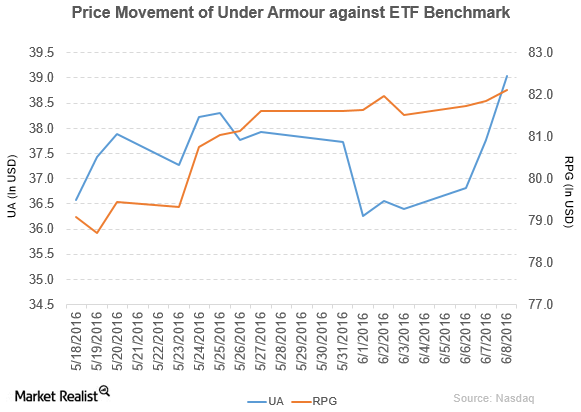
What Drove Under Armour’s Rise on June 8?
Under Armour (UA) has a market cap of $7.1 billion. It rose by 3.4% to close at $39.04 per share on June 8, 2016.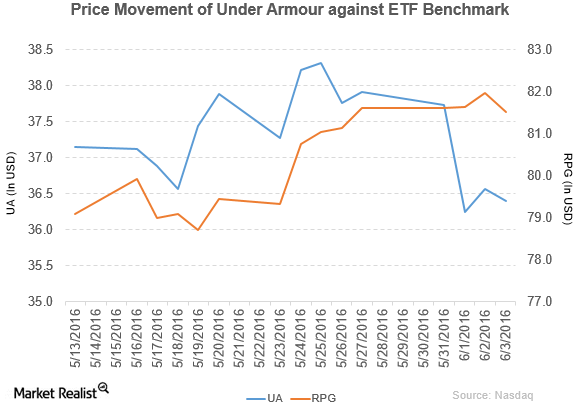
Under Armour Has Declared a Dividend for Its Class C Stock
Under Armour (UA) has a market cap of $6.7 billion. It fell by 0.44% to close at $36.40 per share on June 3, 2016.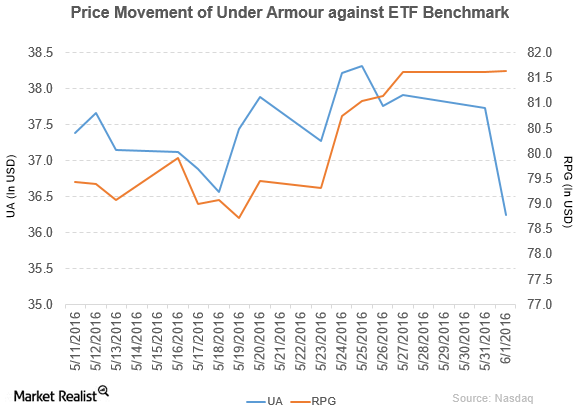
Under Armour Saw Its Price Target after Its Revised Outlook
Under Armour (UA) has a market cap of $6.6 billion. It fell by 3.9% to close at $36.25 per share on June 1, 2016.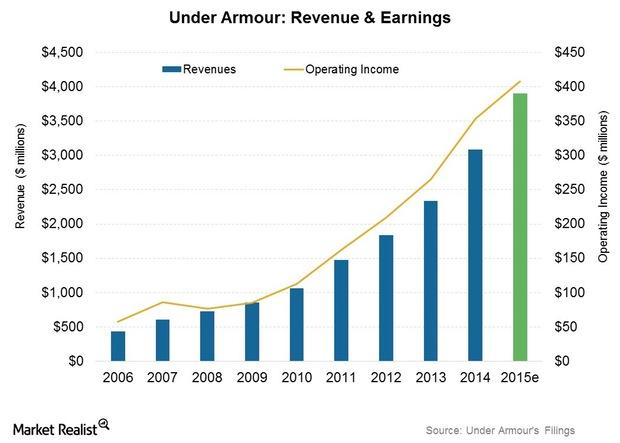
Under Armour Projects a ~26% Revenue Growth Rate for 2015
Under Armour is scheduled to declare its earnings for 4Q15 and full-year 2015 on January 28, 2016. It has projected revenue of $3.9 billion for 2015.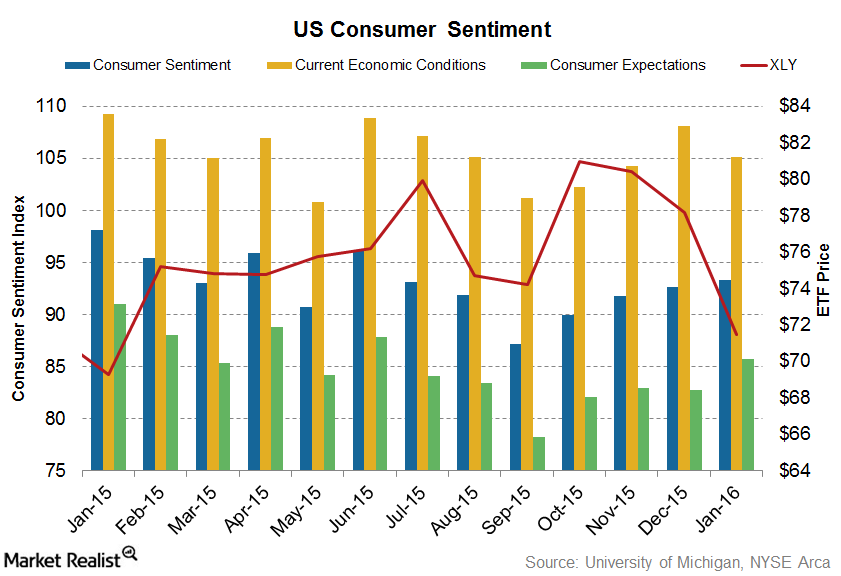
Future Expectations and Consumer Sentiment Rise
With improved consumer sentiment, there may be greater consumer spending in the economy, which may translate into faster economic growth.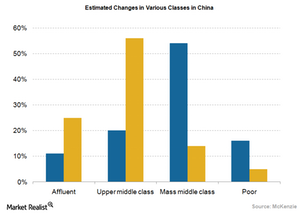
China’s Middle Class Growth Is an Important Driver for Apple
One of the most important growth drivers for Apple in China is the growing percentage of people in China’s upper middle class.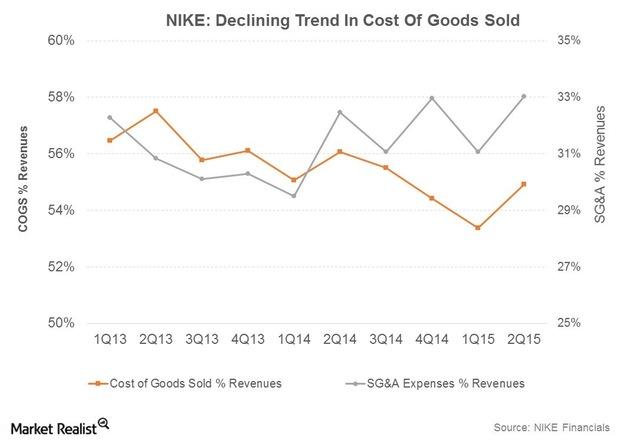
Reasons for NIKE’s Rising Profitability
NIKE is working to improve its profitability, as its margins trail industry peers such as Lululemon Athletica (LULU) and VF Corporation (VFC).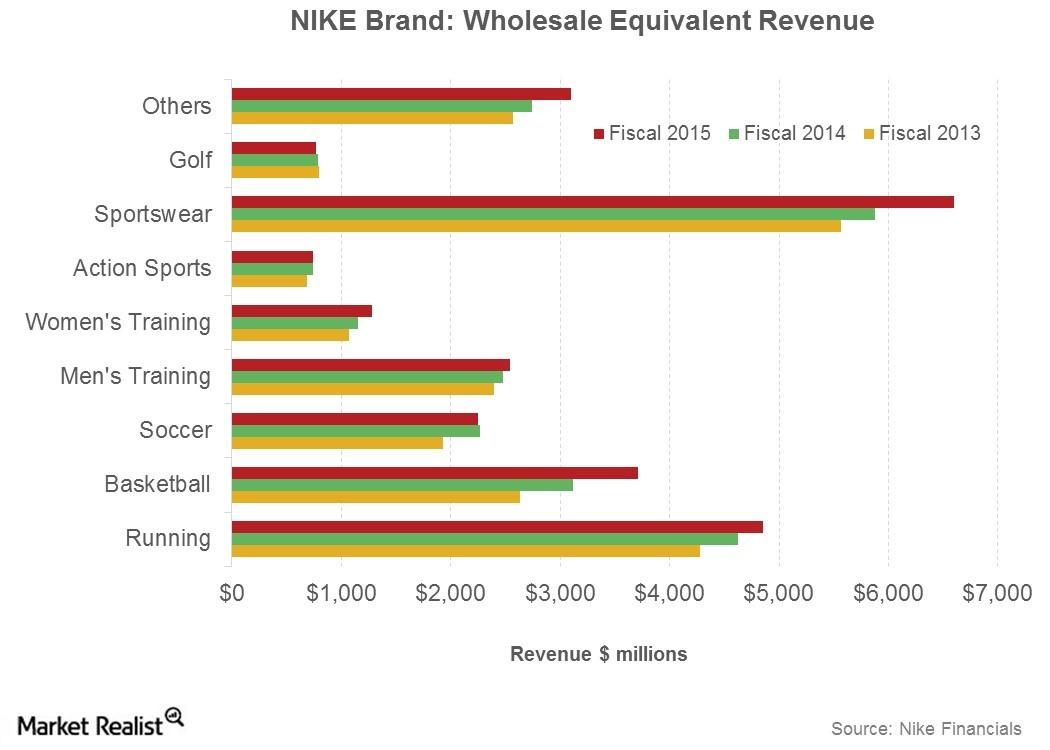
Future Sales Drivers for Nike’s Integrated Marketplace Model
Nike is expecting sales through wholesalers to grow at a mid- to high-single compounded annual growth rate over the next five years through fiscal 2020.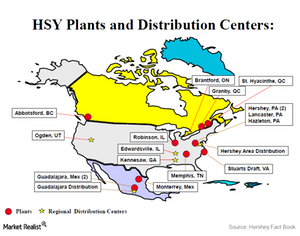
How Hershey Gained from Improving Its Supply Chain
In 2010, Hershey announced Project Next Century, which aims to streamline its global supply chain operations and create a more competitive cost structure.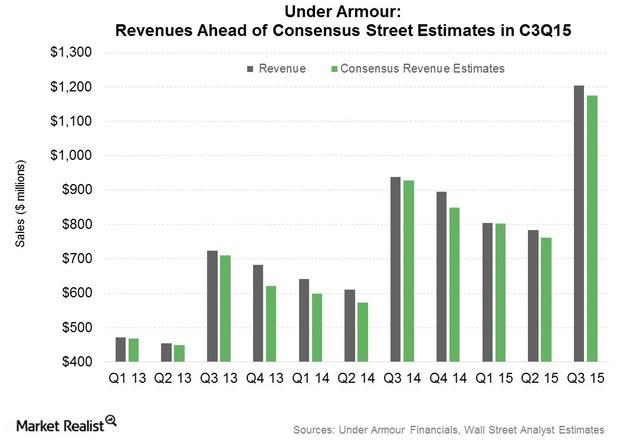
China Drove 3Q15 Sales Growth for Under Armour, Nike, and Adidas
This was a record quarter for Under Armour, with sales breaching the $1 billion mark for the first time.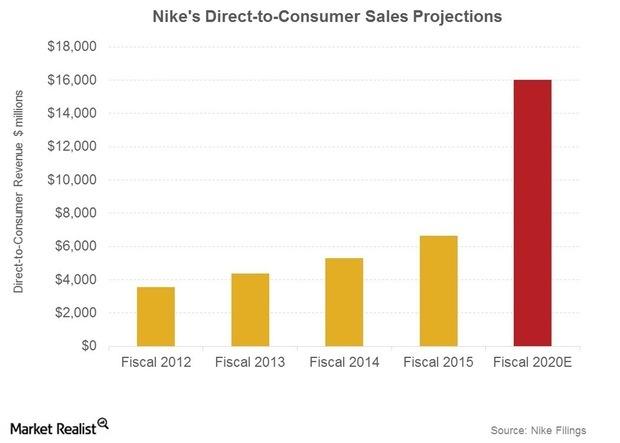
Why Nike Is Projecting Explosive Growth in Retail and Web Sales
Nike’s rival Adidas (ADDYY) is targeting over 2 billion euros from web sales by 2020, as detailed in its latest five-year plan unveiled in March 2015.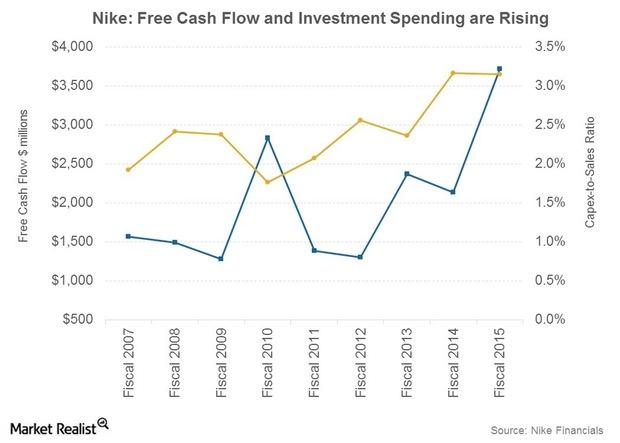
Nike’s Free Cash Flow Outlook and Projected Growth Investments
Nike expects to grow its Free Cash Flow, or FCF, at a faster pace compared to net income over the next five years through fiscal 2020. In fiscal 2015, FCF grew by ~74%.
Can Nike Grow North American Sales to $20 Billion by 2020?
Performance for Nike and peers has been strong in North America over the past few years. The sports gear category has benefited from the improving US economy.
Why Under Armour Unveiled a Blueprint for International Expansion
Under Armour’s (UA) international operations are among its fastest-growing businesses.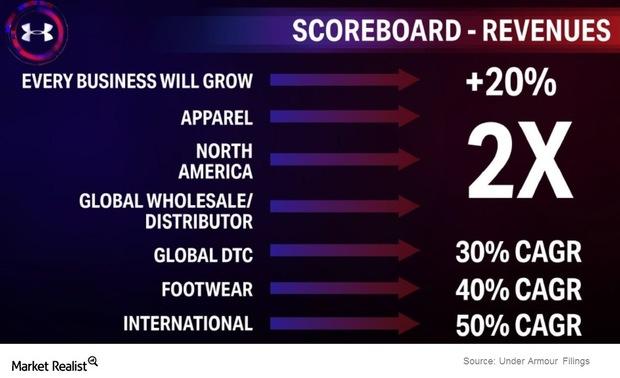
Analyzing Under Armour’s Latest Growth Updates
Under Armour is a growth company. In this series, we’ll discuss how the company plans to double its business in the next four years.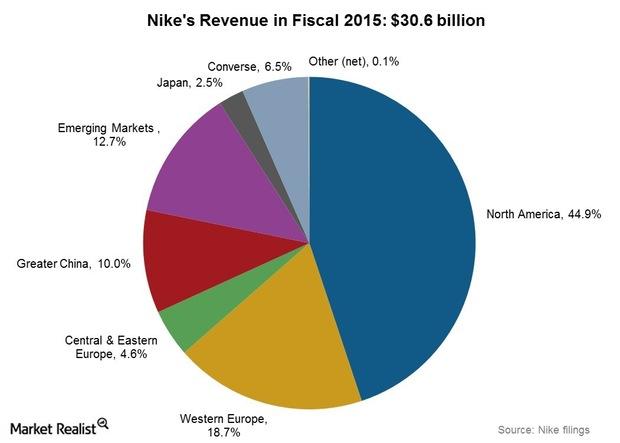
Overseas Markets and Nike: Obstacles on the Leading Footwear Company’s Revenue Racetrack?
In fiscal 2015, Nike derived ~55% of its sales from overseas markets—18.7% from Western Europe, 12.7% from Emerging Markets, and 10% from Greater China.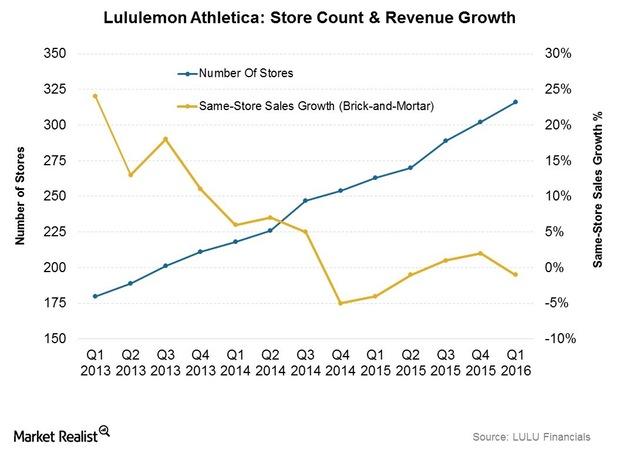
Analyzing Lululemon Athletica’s Revenue Performance this Year
Lululemon Athletica (LULU) reported revenue of $423.5 million in 1Q16, up 10% year-over-year.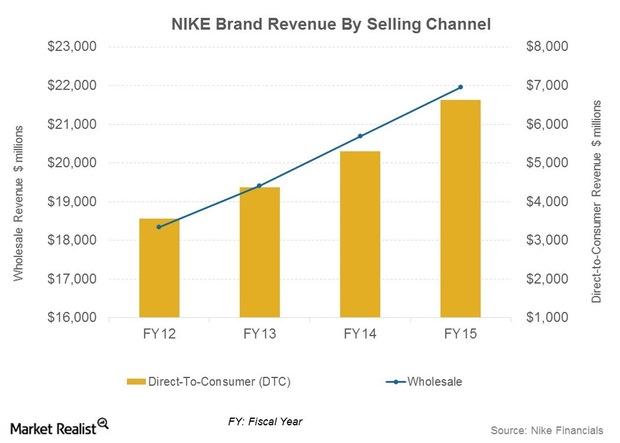
Why Nike Is Expanding Its Direct Retail Store Presence
Nike sales growth was fueled by new store openings, higher store comps, and growth in the e-commerce channel.
How Was Nike’s 4Q15 and 2014 Sales Performance in North America?
Nike’s sales performance was the strongest in the key markets of North America, Western Europe, and Greater China.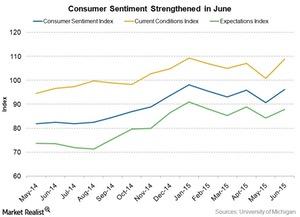
Consumer Sentiment Shines on Wall Street: Upbeat in June
In the US, consumer sentiment rose in June. The Consumer Discretionary Select Sector SPDR ETF (XLY) has gained about 1.22% over the past month.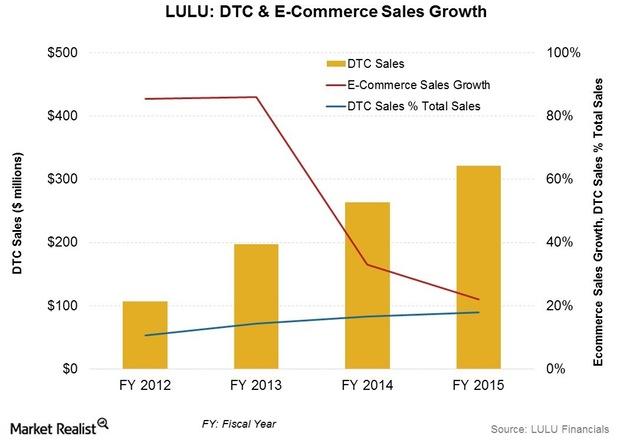
Analyzing Lululemon’s Omni-Channel and E-Commerce Differentiators
Lululemon is testing RFID (radio frequency identification) technology and plans to implement the technology, which is currently used in ~13 stores.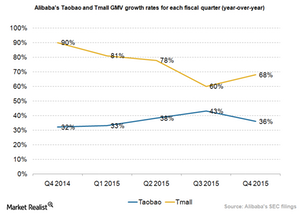
Alibaba Worries about Counterfeiting Once Again
Kering, a Paris-based luxury goods maker, sued Alibaba (BABA) for encouraging counterfeiting on its online platforms.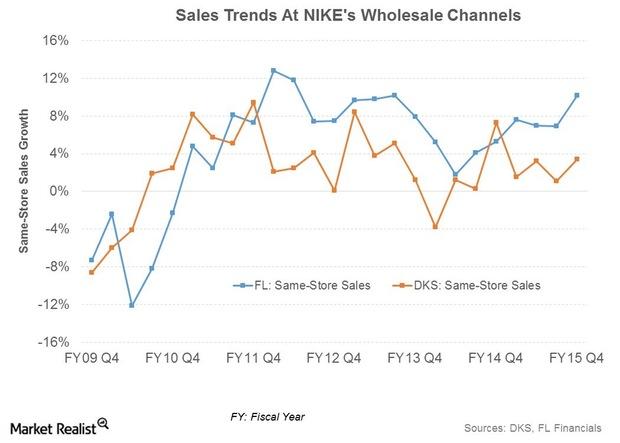
How Nike Benefits from Its Wholesale Partnerships
Nike (NKE) has a number of stores-within-stores, or exclusive standalone stores, partnering with retailers.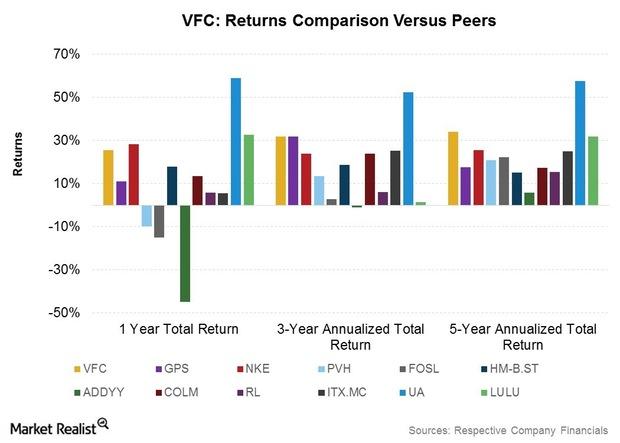
Shareholder Returns Analysis: Where VF Corp. Trumps Competitors
VFC’s total annualized returns to shareholders appear among the most consistent within its peer group for one-year, three-year, and five-year time periods.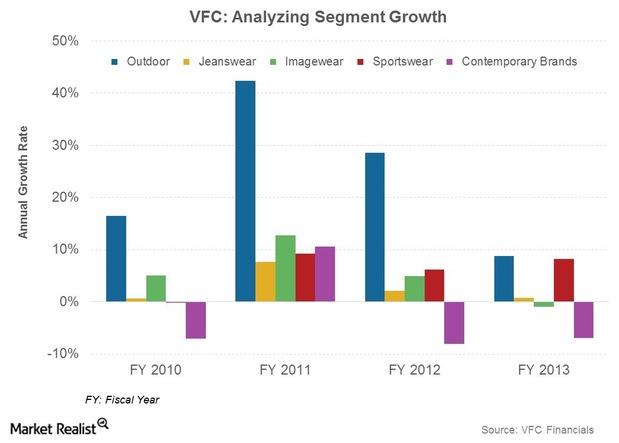
Making It To VF Corp.’s $2-Billion Brand Club
The North Face became VFC’s first brand to achieve $2 billion in sales in 2013. Timberland revenues are expected to come in at ~$1.7 billion in 2014.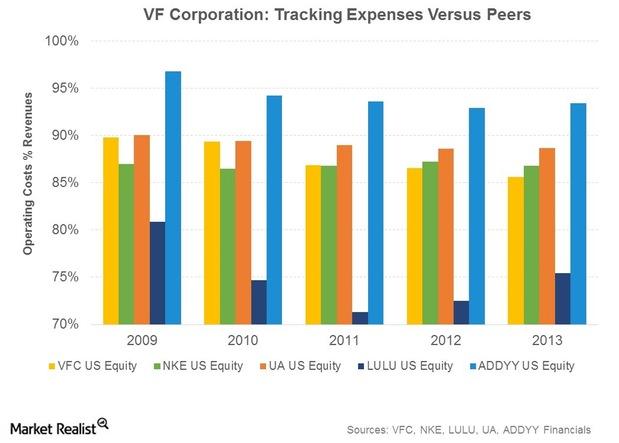
VF Corp.’s Location, Manufacturing, And Supply Chain Advantages
VFC manufactures ~27% of its products in facilities operated by the company. The company owns 28 manufacturing facilities.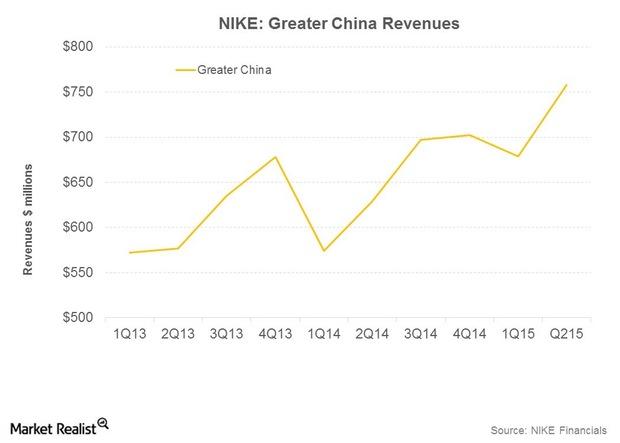
NIKE in Greater China: Strategies That Work
NIKE holds the #1 position for both apparel and footwear in China among sportswear rivals. It plans to leverage the value of its brand among consumers.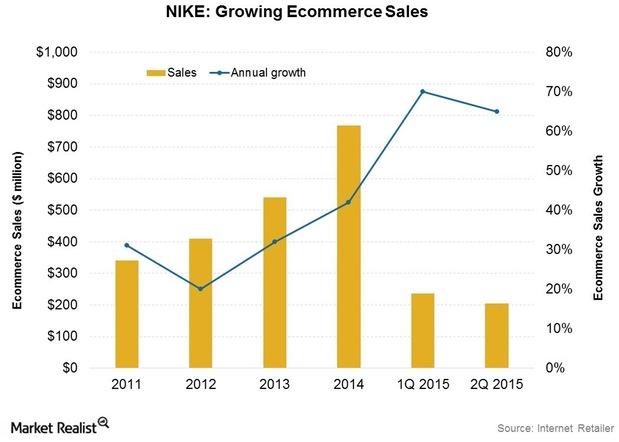
E-commerce: A Critical Growth Driver At NIKE
NIKE plans to grow DTC revenues to $8 billion by fiscal 2017, including e-commerce revenues of $2 billion. E-commerce grew 65% in 2Q15 to ~$205 million.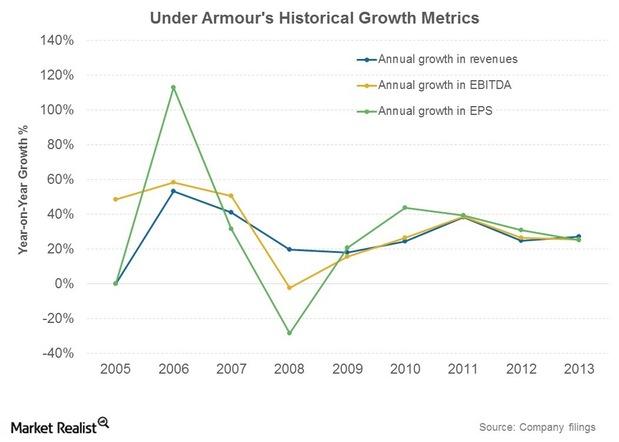
SWOT Analysis: Balancing Under Armour’s Strengths And Weaknesses
How strong is Under Armour’s business model? In the next parts of this series, you’ll read a SWOT analysis—looking at strengths, weaknesses, opportunities, and threats—of Under Armour, Inc. (UA). We’ll also compare the company to rival firms, the overall market, and the consumer discretionary (XLY) sector. In this part, we’ll cover the firm’s key strengths and weaknesses. […]