Reasons for NIKE’s Rising Profitability
NIKE is working to improve its profitability, as its margins trail industry peers such as Lululemon Athletica (LULU) and VF Corporation (VFC).
Dec. 15 2015, Updated 1:39 p.m. ET

NIKE’s profitability initiatives
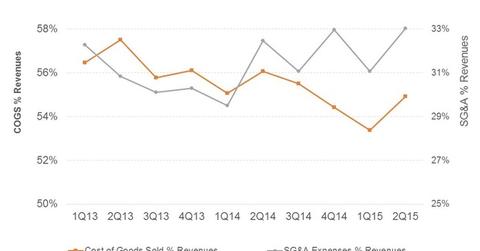
NIKE’s (NKE) gross margins expanded to 45.1% in 2Q15,[1. Quarter ending November 30, 2014 – Fiscal year ends on May 31, 2015] up from 43.9% in 2Q14, an increase of 1.2% year-over-year. The company is working to improve its profitability, as its margins trail industry peers such as Lululemon Athletica (LULU), VF Corporation (VFC), Under Armour (UA), and Deckers Outdoors Corporation (DECK). Note that it is possible to get exposure to NIKE and the retail sector through funds such as Fidelity Select Consumer Discretionary Portfolio or the SPDR S&P Sector Retail ETF.
Revenue-side factors
The roll-out of innovative products, coupled with a strong brand and marketing presence, allows NIKE to charge more for its products. Innovations like Tech Fleece in sportswear, new performance apparel lines in running, as well as a number of other performance categories, are higher margin products.
Footwear product sales have also tilted toward the high-end side in categories including Running, Basketball, and Sportswear, as we saw in Parts 4 and 5. These higher-priced products and the brand’s emphasis on premium have helped NIKE expand margins.
Direct-to-consumer sales
The percentage of direct-to-consumer, or DTC, sales in the overall sales mix has also jumped. DTC sales, which include e-commerce sales, grew 18% in 2Q15, compared to overall revenue growth of 14.7%. DTC sales are made either via the company’s websites, or through company-owned retail outlets. As a result, NIKE earns higher revenues on them, which expands margins.
Operating costs
Other operating costs, however, rose in the second quarter. As a percentage of sales, selling, general, and administrative expenses rose to 33% in 2Q15, an increase of 16.7% year-over-year. Demand creation expenses rose by 11% to $766 million, due to new product launches, digital brand marketing, and consumer events.
The company also incurred higher operating overheads for new retail stores, enhancement of digital capabilities, and operational infrastructure. Operating overhead costs increased by 19% to $1.7 billion.
