Mosaic Co
Latest Mosaic Co News and Updates
Cost Curves 101: What Nitrogen Investors Must Consider
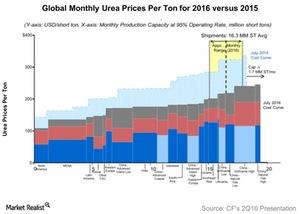
Demystifying the cost curve Earlier in this series, we saw that prices of nitrogen have fallen over the years, despite its significance in crop growth and feeding the vast population. The lower prices are due to a flatter cost curve, which we’ll explain in this part. Flat cost curve In the chart above, we compare a […]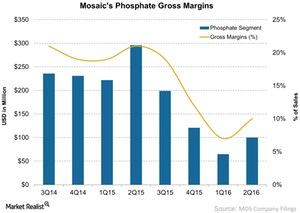
Why Have Mosaic’s Potash Shipments Declined?
The gross margin rate for Mosaic’s Phosphate segment fell significantly in 2Q16, to 10% from 21% in 2Q15.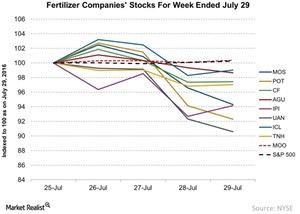
Which Fertilizer Stock Was the Top Loser Due to Price Movements?
Fertilizer prices are one of the key drivers for fertilizer stocks. So investors and analysts watch fertilizer prices closely.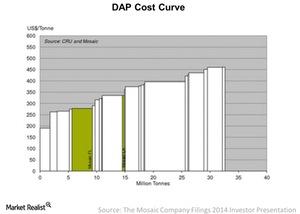
How DAP- and MAP-Producing Countries Stack Up on the Cost Curve
In 2014, the cost of production for DAP per ton ranged from $190 to $450 per metric ton, as we can see in the chart.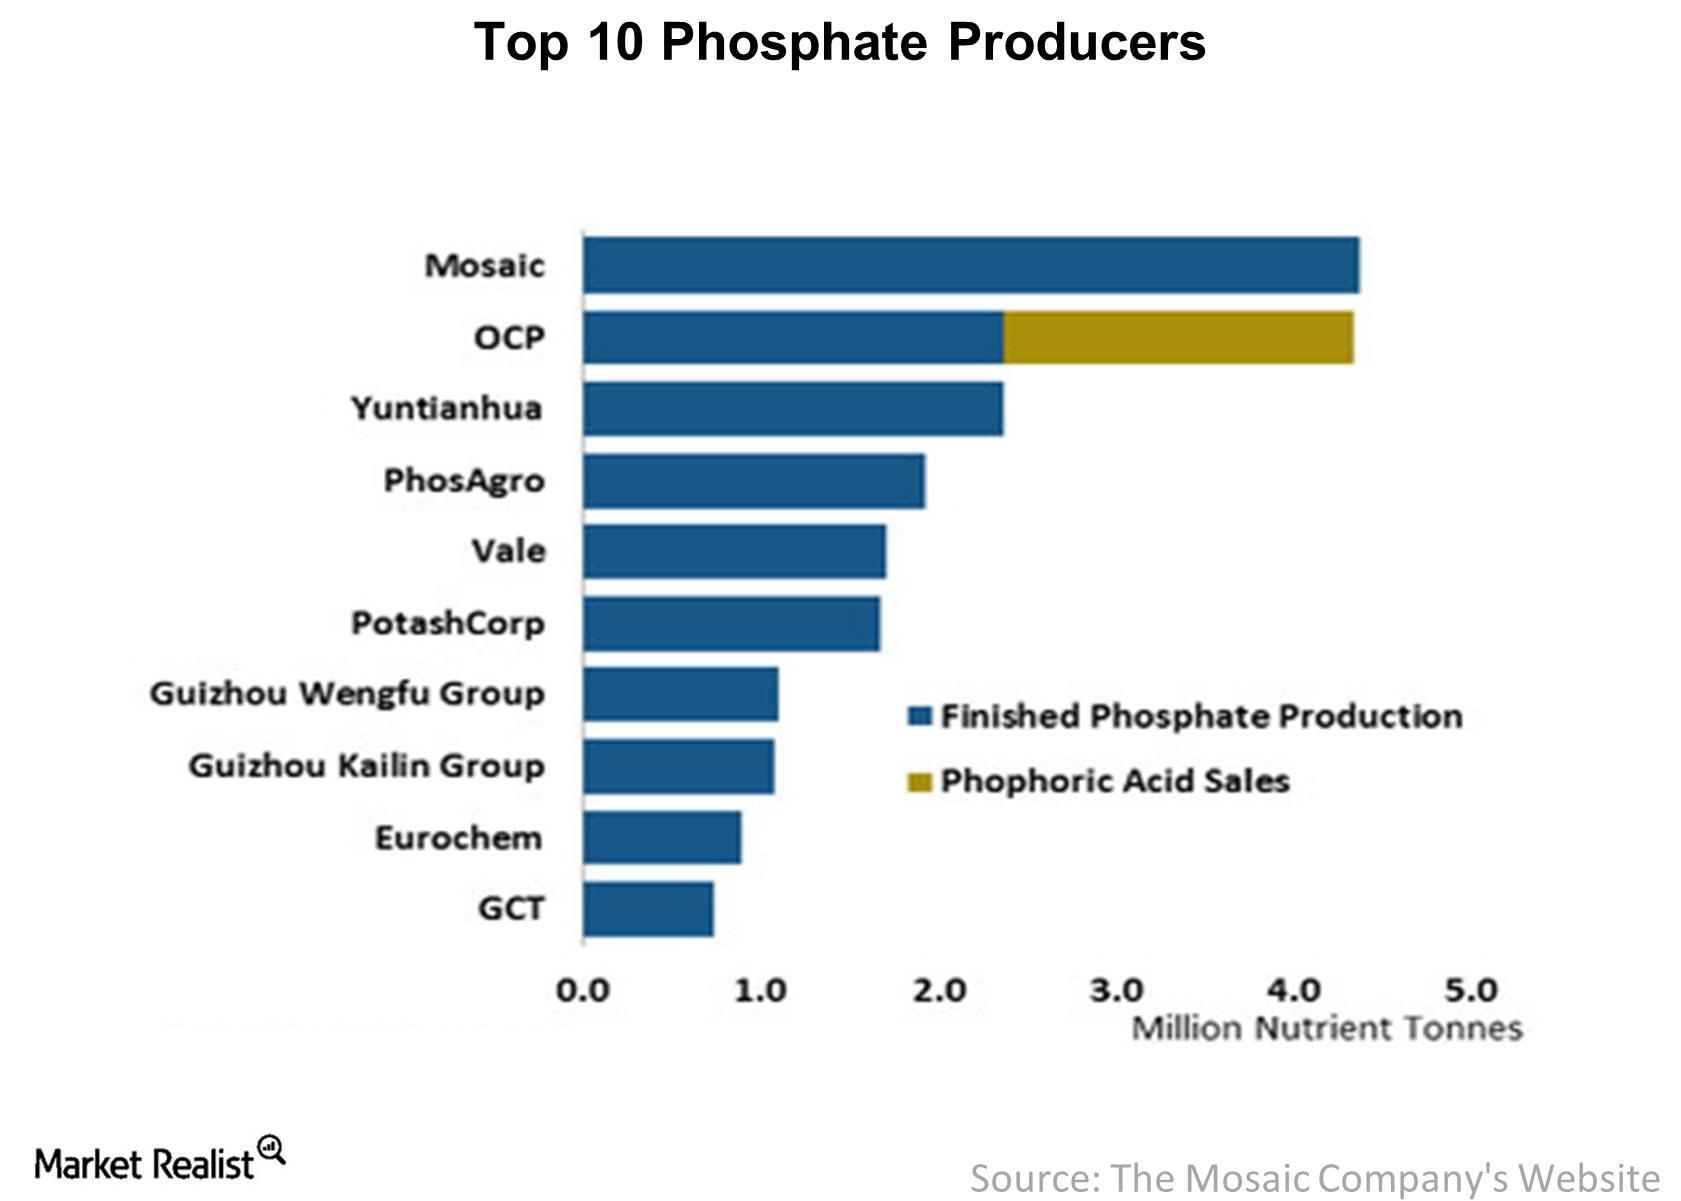
Phosphate Consumption Outlook and Top Producers to Serve the Market
The Mosaic Company (MOS), which acquired CF Industries’s (CF) phosphate business in 2014, is the largest producer of phosphate globally.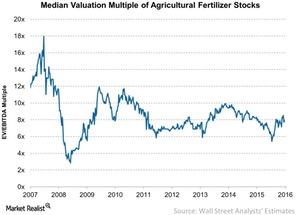
How Do Valuation Multiples Compare among Fertilizer Companies?
To date, the median valuation of fertilizer stocks is around 7.9x. That’s at the midpoint of the nine-year average of 8.2x.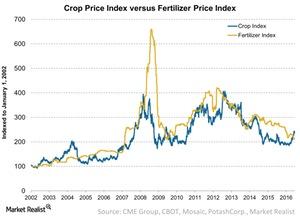
Agricultural Chemical Companies: Crop and Fertilizer Price Impact
Investors in the fertilizer industry (XLB) must actively track the relationship between crop prices and fertilizer prices. This, in turn, impacts agricultural chemical companies.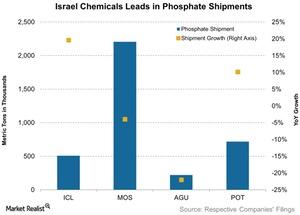
How Phosphate Shipments Performed in 1Q16
Israel Chemicals, which shipped 0.5 million metric tons during the recent quarter, saw the largest jump in shipment growth—20% year-over-year.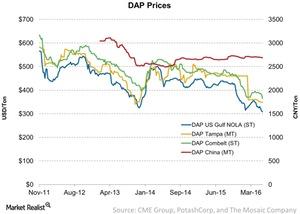
Last Week’s DAP Fertilizer Price Trends: Must-Knows
Ammonia is used to make phosphate fertilizers like DAP (diammonium phosphate) and MAP (monoammonium phosphate).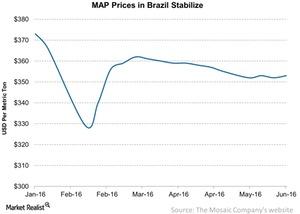
Why MAP Fertilizer Prices Continue to Stabilize
Last, average MAP prices in Brazil inched up to $353 per metric ton from $352 per metric ton the previous week.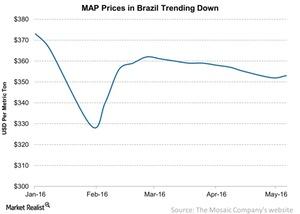
Ammonium Phosphate Prices: A Comparison
MAP (monoammonium phosphate) is the second-most used phosphate fertilizer after DAP (diammonium phosphate).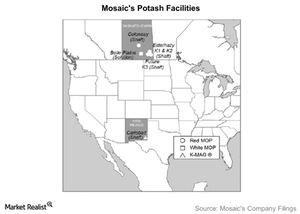
An Overview of Mosaic’s Potash Segment Operations
Mosaic’s Potash segment generated $2.5 billion in net sales, excluding intersegment sales, in 2015. This accounted for 28% of the company’s total net sales.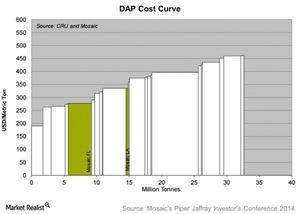
Where Does Mosaic Stand on the Cost Curve for Its Fertilizers?
Fertilizer prices and input costs affect all players in the industry. Survival and profitability come down to where a company stands on the cost curve.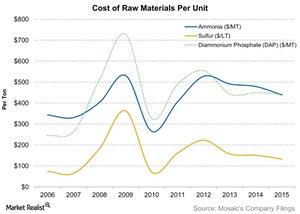
How Has Mosaic Done in Terms of Raw Material Costs?
Mosaic purchases certain raw materials at fixed costs to be consumed over time, but the selling prices of its finished goods can fluctuate rapidly.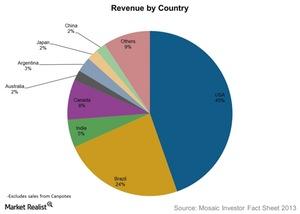
Who Are Mosaic’s Customers and How Does It Reach Them?
Mosaic doesn’t sell directly to farmers. Its customers include cooperatives, wholesale distributors, retail chains, and independent retailers.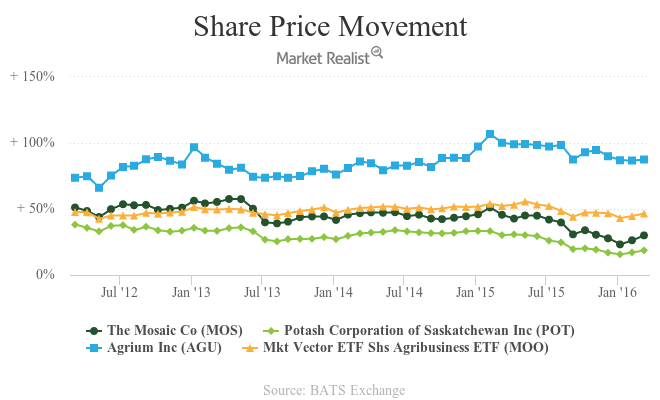
How Phosphate Fertilizer Prices Are Changing Trends
In the 2010–2011 planting season, phosphate fertilizers accounted for about 23% of total NPK fertilizers consumed globally.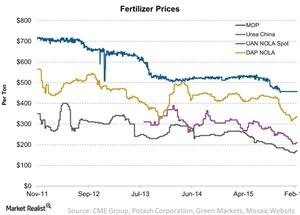
An Update on NPK Fertilizer Price Trends
Fertilizer prices have fallen significantly over the years. But more recently, prices are showing a trend reversal for urea, UAN, and phosphate fertilizer.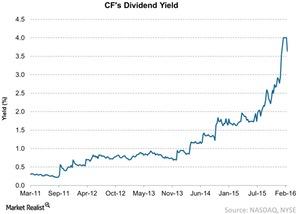
Checking in with CF Industries’ Dividend Yield
As of February 19, CF Industries pays a quarterly dividend of $0.3 per share. In 2015, it paid an annual dividend per share of $3.6—down from $5 in 2014.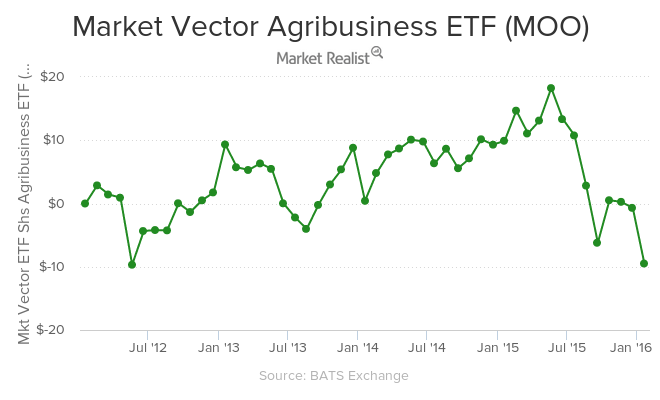
The Prevalent Price of Potash in 2016
As of January 19, 2016, the VanEck Vectors Agribusiness ETF (MOO) returned -12.7% in 2015. YTD as of January 19, the ETF is down by 8%.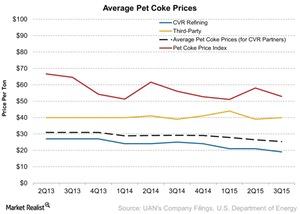
How CVR Partners Benefits from Pet Coke Prices
Unlike other companies, CVR Partners (UAN) uses petroleum coke, or pet coke, to produce nitrogen fertilizers.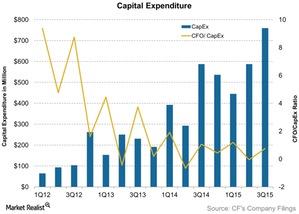
What is CF Industries’ Capital Expenditures Ratio Telling Us?
CF Industries’ cash flow to capital expenditure ratio has been falling. CF Industries’ cash flow to capital expenditure ratio stands at 0.75 as of 3Q15.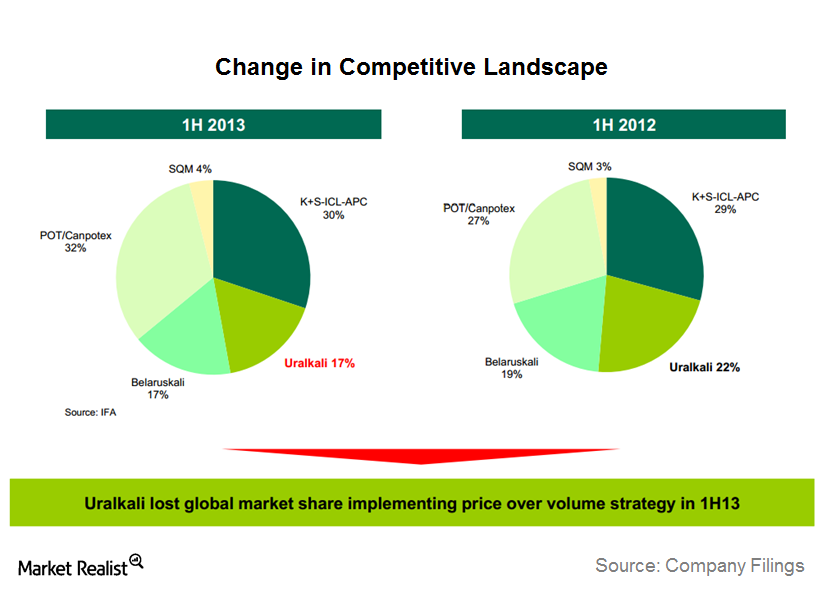
Why is Uralkali taking back—not gaining—fertilizer market share?
Uralkali’s move towards a volume-over-price strategy in order to gain market share (more like taking back market share) was the more important story.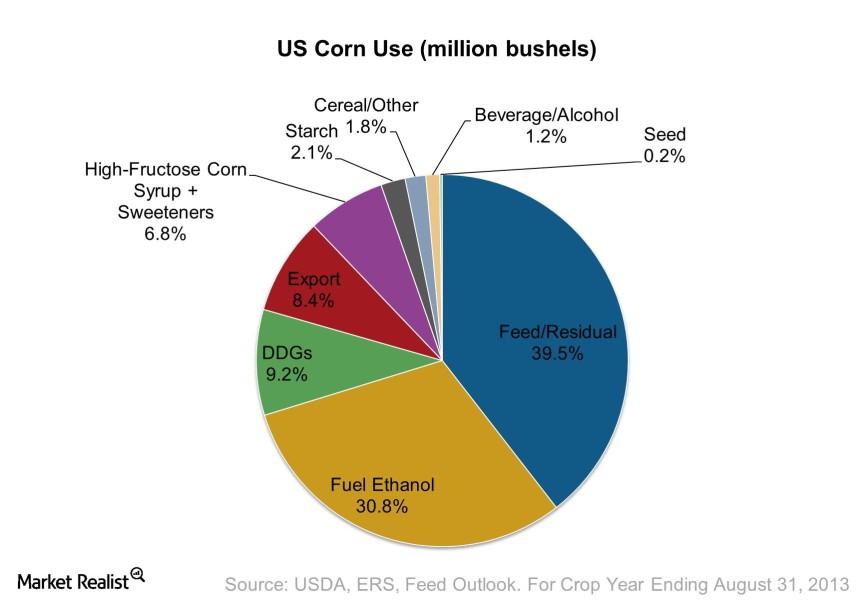
Why the average American uses more than 4 ears of corn per day
The United States is the biggest user of corn, consuming 265 million mt (metric tonnes) of corn in 2012—equivalent to 26% of global consumption.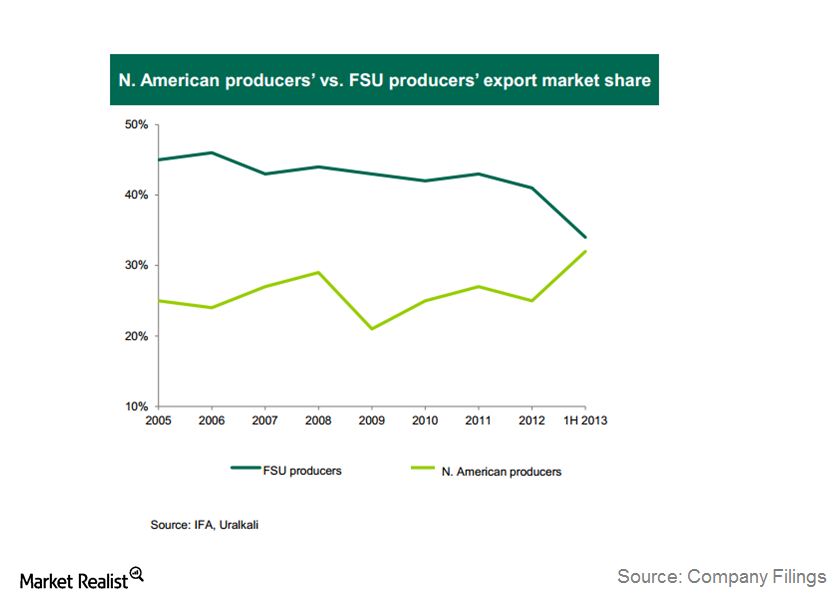
Why the wayward Canpotex upset the Russian giant Uralkali
In its recent earnings call, Uralklali highlighted its new strategy, called the Revenue Maximization Strategy.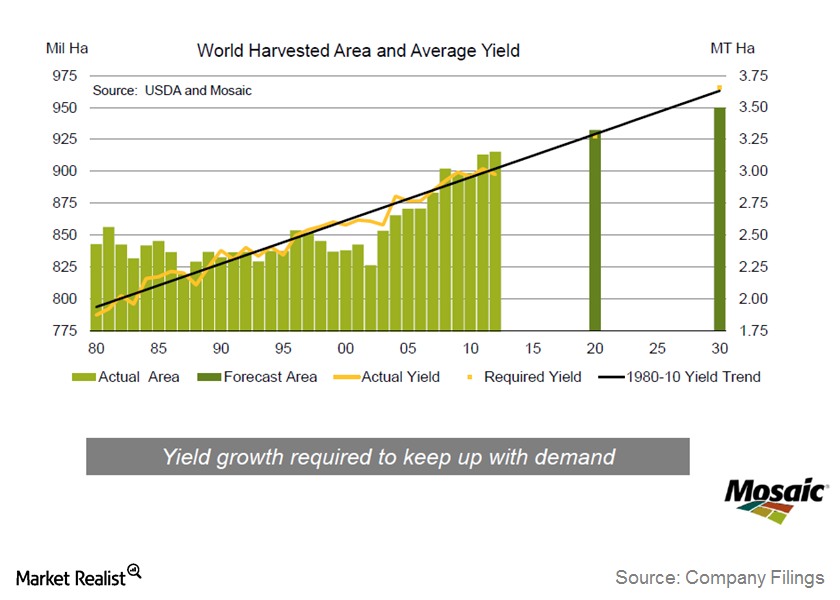
Why Mosaic shows that agriculture is always a cyclical business
In this series, we’ll explore Mosaic Co.’s latest discussions on its third quarter 2013 earnings results and the industry outlook.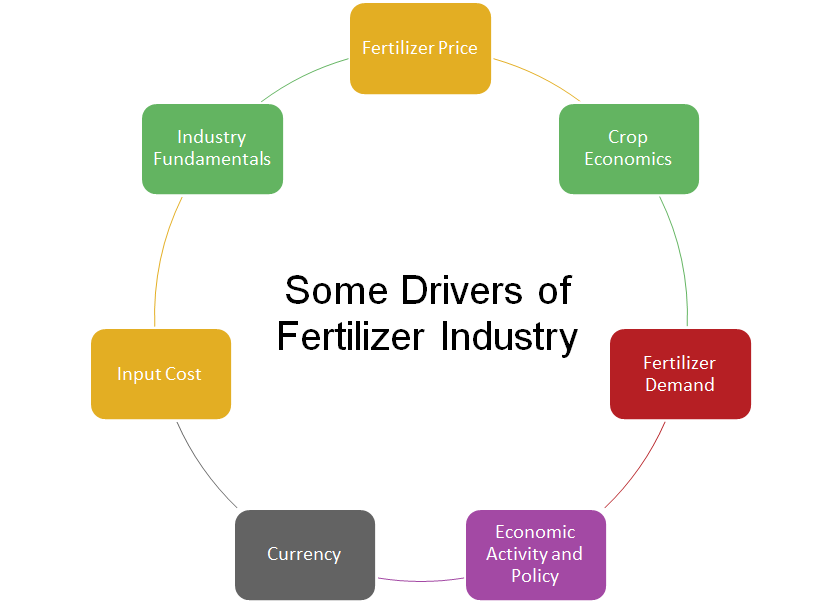
Analyzing the key factors that affect the fertilizer industry
The Essential Fertilizers Weekly series comprises key factors that have a potential impact on the bottom line—depending on revenue and expenses.
Must-know: The key drivers of fertilizer company performance
The importance of the bottom line The performance of any investment over the medium to long term depends on current or future changes in the bottom line, like earnings per share, free cash flow per share, EBITDA (earnings before interest, tax, depreciation, and amortization) per share, and dividend per share. When the bottom line is […]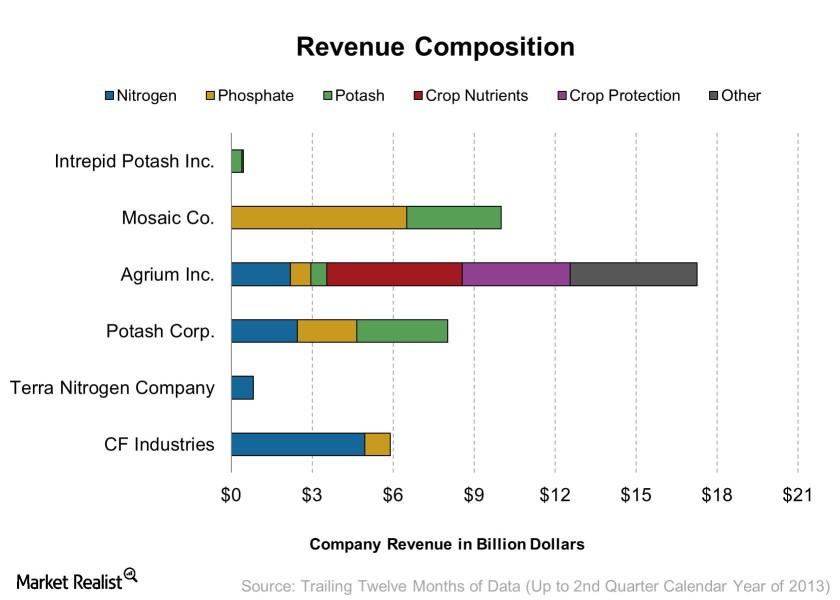
Revenue composition of major publicly traded fertilizer stocks
Main companies traded on the US market There are six main fertilizer producers that are widely traded on the US stock exchange: CF Industries Holdings Inc. (CF), Agrium Inc. (AGU), Mosaic Co. (MOS), Potash Corp. (POT), Terra Nitrogen Company LP (TNH) and Intrepid Potash Inc. (IPI). While they all operate producer fertilizers, each are exposed […]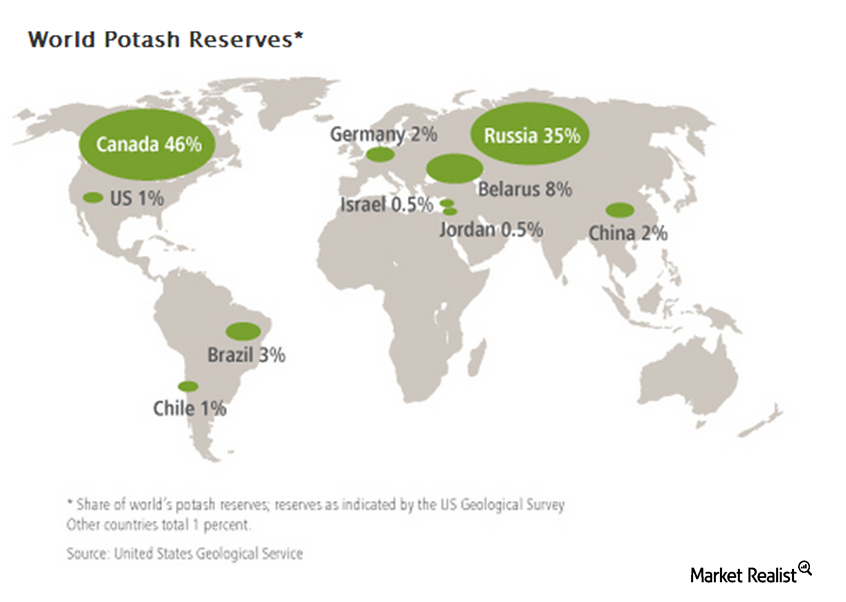
Must-know: Why cost and location affect potash production
Where potash is found Of all the fertilizer sub-industries, potash is the most concentrated. Mineral deposits of potash are more geographically concentrated than phosphate rock. Most of these resources are found in Canada, Russia, and Eastern Europe. Because of this, a large chunk of the world potash supply is controlled by companies like Potash Corp. […]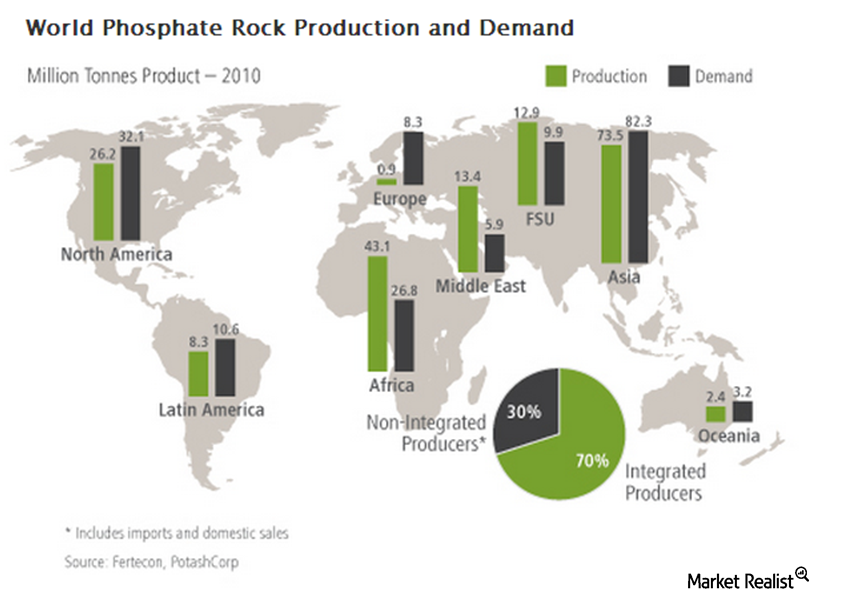
Why phosphate is a less competitive fertilizer sub-industry
The phosphate industry is less competitive than the nitrogen industry Unlike nitrogen-based fertilizers, the production of phosphate and potash fertilizers begins in mines. Mineral deposits for the latter two fertilizers are much scarcer and are usually concentrated in specific regions around the world. Because of this, there are fewer firms that make up the two […]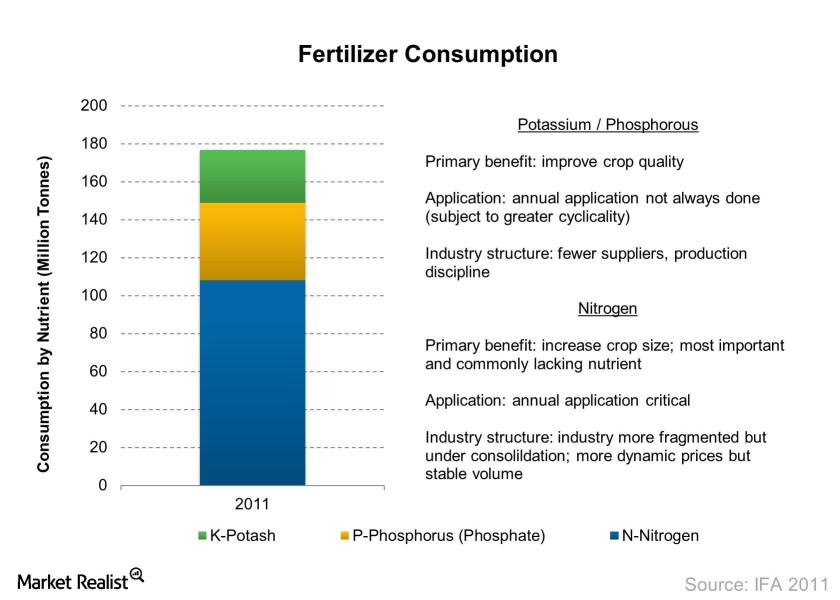
Fertilizer industry overview: Must-know fertilizer types
Fertilizers are used in the agriculture industry to improve the yield farmers receive. The three main types of nutrients or fertilizers are nitrogen, phosphate, and potash.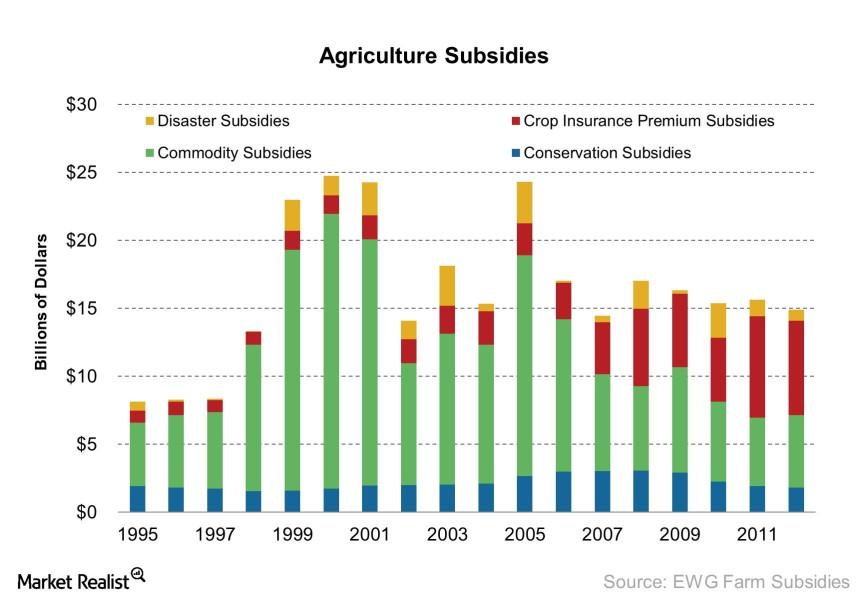
Must-know: Important types of farm subsidies in the United States
As a critical part of economic and social welfare, agriculture is a key industry governments around the world support.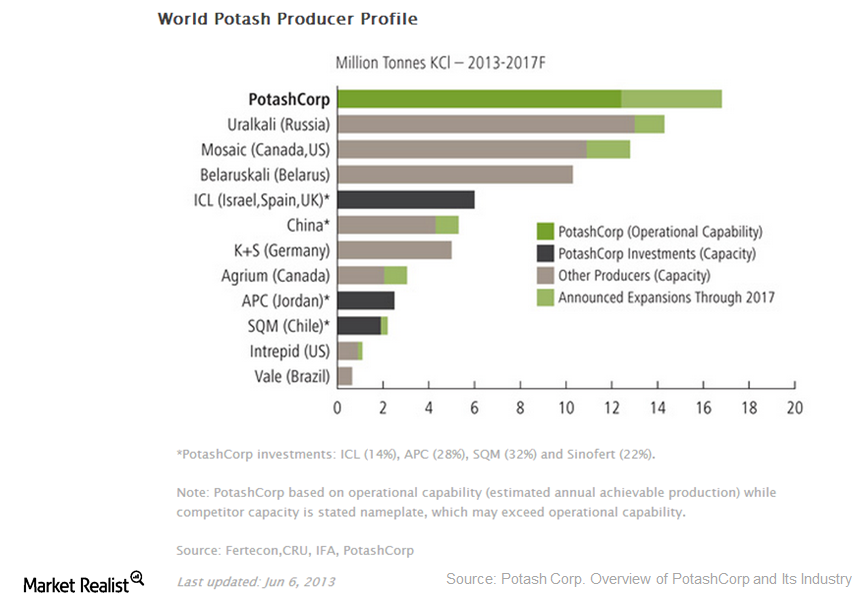
Why are potash producers increasing capacity?
Introduction Most often, investors expect new capacity addition plans as a positive indicator of booming business. This is because companies often increase their capacity following a period of demand boom. But capacity increases can be negative, as we saw with several fiber optics companies back during the tech bubble, when earnings plummet on falling demand […]
