JetBlue Airways Corp
Latest JetBlue Airways Corp News and Updates
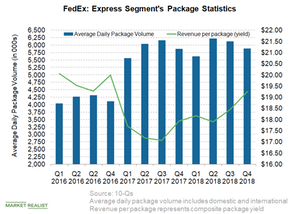
What’s behind FedEx Express’s Revenue Growth?
In this article, we’ll consider FedEx’s (FDX) Express segment’s performance in the fourth quarter.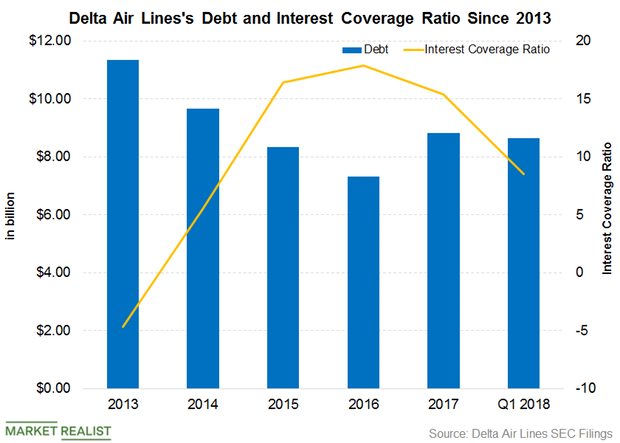
Delta Air Lines: Is Higher Debt a Concern?
Delta Air Lines’ higher debt means a higher interest expense and a higher DE (debt-to-equity) ratio. Delta Air Lines’ current DE ratio is 0.69x.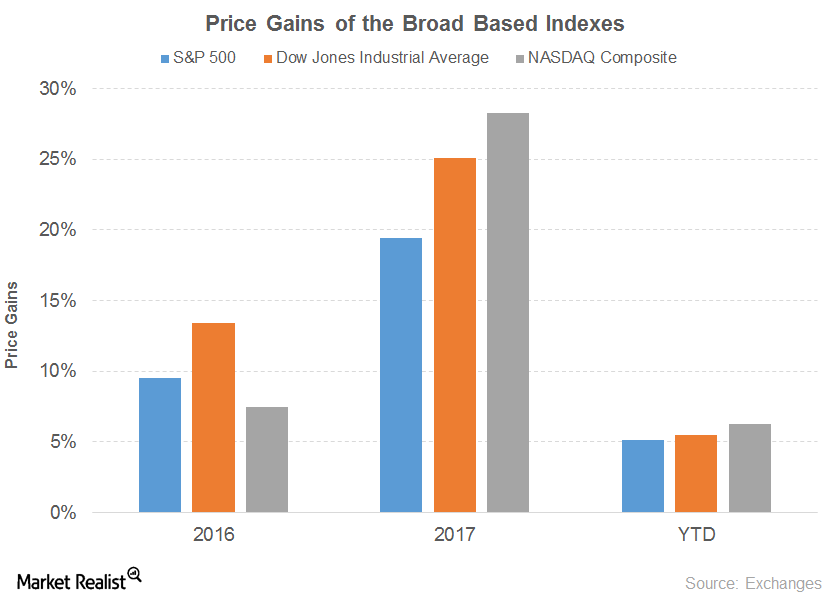
Which Stocks Have Announced $1,000 Bonuses?
In this series, we’ll be taking a look at the companies that have announced $1,000 dollar bonuses, pay raises, increased dividends, and buybacks in the last two months.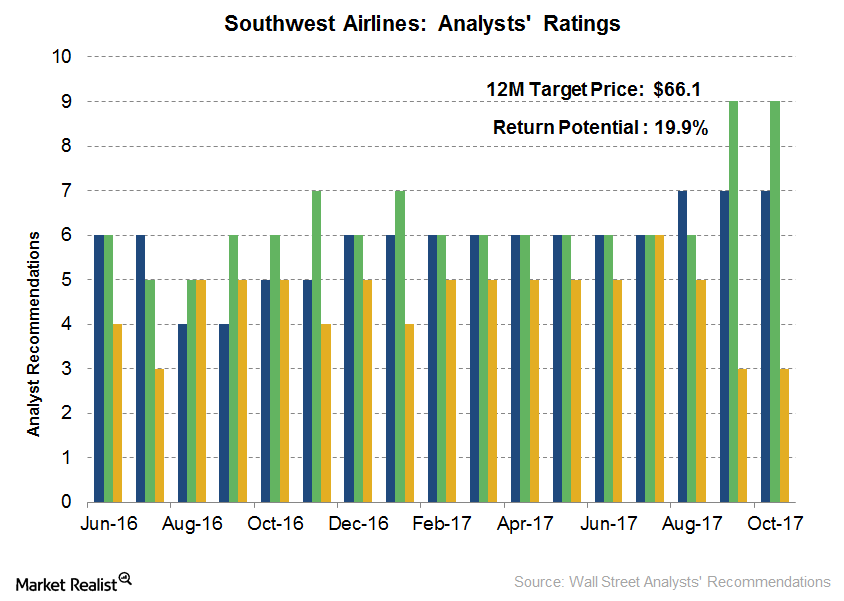
Analysts’ Recommendations for Southwest Airlines
Analysts’ recommendations Of the 17 analysts tracking Southwest Airlines (LUV), 36.8% of the analysts (seven analysts) gave a “strong buy” rating on the stock, while another 47.4% (nine analysts) gave a “buy” rating. The remaining 15.8% (three analysts) gave a “hold” rating. None of the analysts gave a “sell” or “strong sell” rating on the […]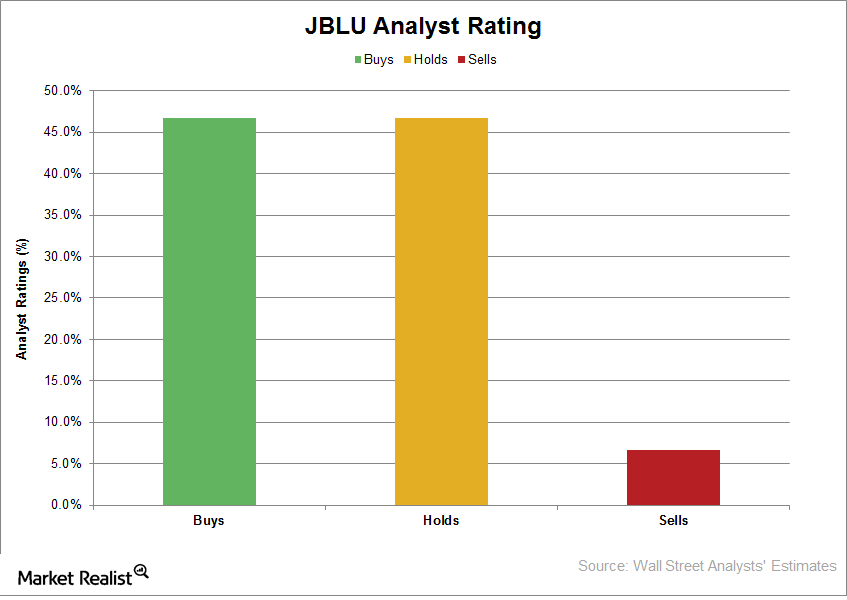
What Wall Street Analysts Recommend for JetBlue Airways
As of September 19, 2017, one analyst out of the 15 analysts tracking JetBlue Airways (JBLU) had a “strong buy” recommendation on the stock.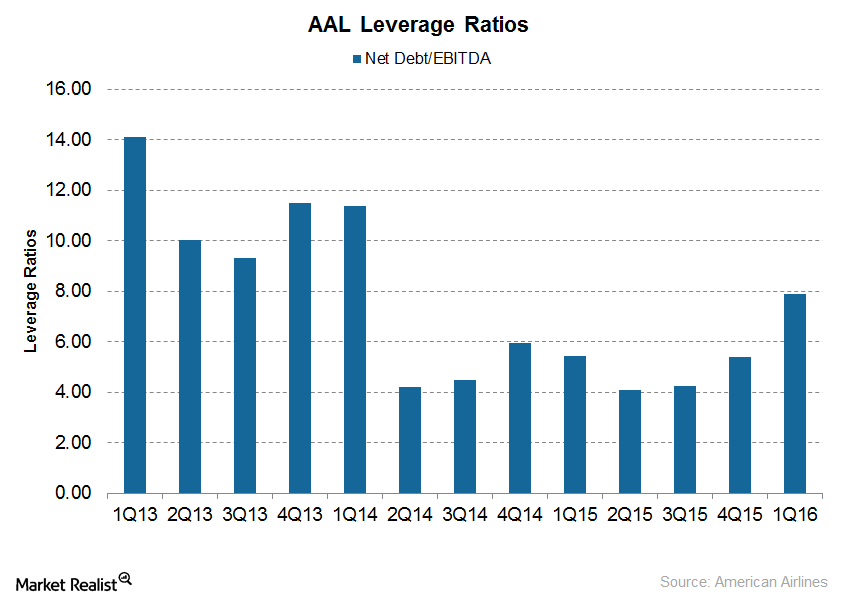
Why Investors Should Be Concerned about American Airlines’ Debt
AAL has paid little attention to its total debt, which rose from $20.8 billion at the end of 2015 to $24.3 billion at the end of 2016 and $24.5 billion at the end of 1Q17.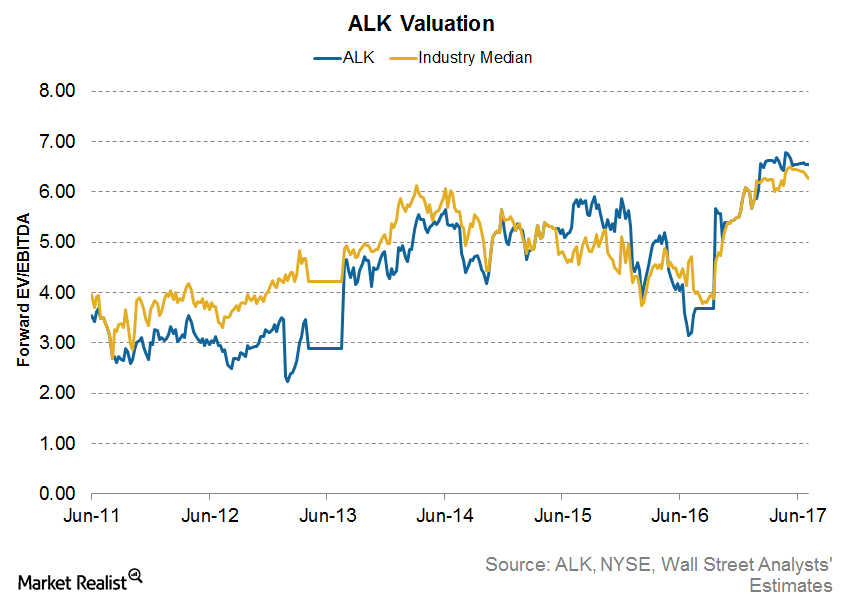
Inside Alaska Air’s Valuation: Cheap Enough?
Alaska Air Group (ALK) is now trading at 6.6x its forward EV-to-EBITDA ratio—one of the highest valuations in the industry.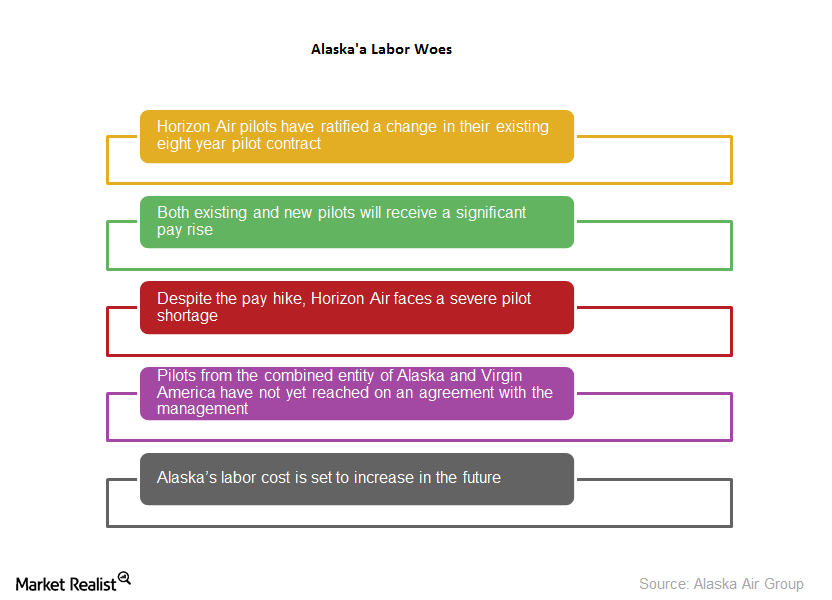
Horizon Air’s Pilots Ratify Change in Agreement
Horizon Air pilots have ratified a change in their existing eight-year pilot contract that entitles both existing and new pilots to receive significant pay raises.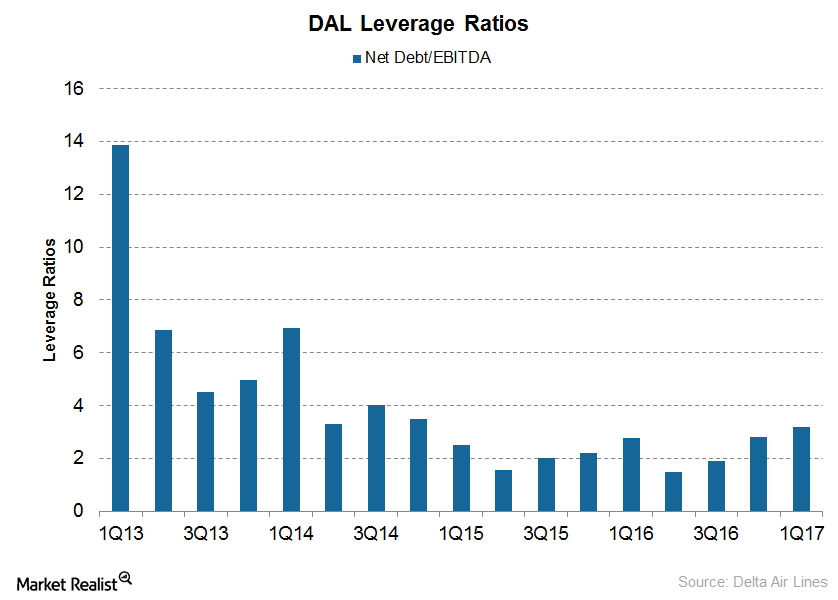
What Delta Air Lines’ Debt Position Means for Investors
During 1Q17, Delta Air Lines’ (DAL) debt rose by ~$2 billion at a blended interest rate of just 3.3%.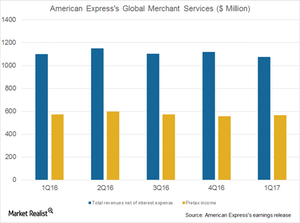
Inside American Express’s Global Merchant Services Segment
American Express’s (AXP) Global Merchant Services segment is expected to see a marginal increase in its net income in 2Q17.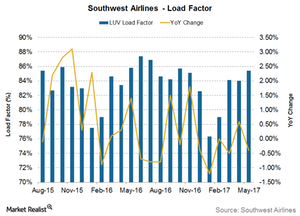
Is LUV on Track to Achieve Its Unit Revenue Guidance?
Because Southwest Airlines’ (LUV) traffic growth lagged its capacity growth in three of the first five months of 2017, its utilization also fell in three of the five months.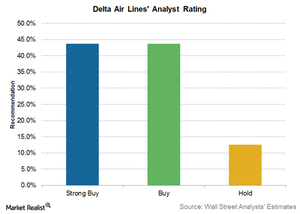
Analyst Ratings for Delta Air Lines after Traffic Release
Only one analyst has upgraded Delta Air Lines (DAL) since it released its traffic data on Friday, June 2, 2017.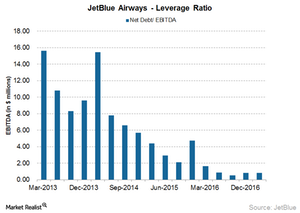
What Investors Should Know about JetBlue’s Debt
The airline industry is very capital-intensive, so airlines generally have huge debt numbers on their balance sheets.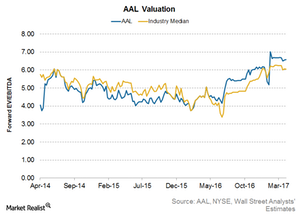
American Airlines’ Valuation: What’s Priced In?
Currently, American Airlines (AAL) is valued at 6.6x its forward EV-to-EBITDA ratio (enterprise value to earnings before interest, tax, depreciation, and amortization).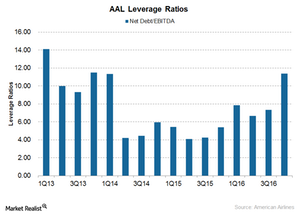
Why American Airlines Has Higher Debt Compared to Its Peers
As opposed to most other airlines that have been reducing their debts, American Airlines’ (AAL) debt has risen, partly due to its focus on completing its integration with US Airways.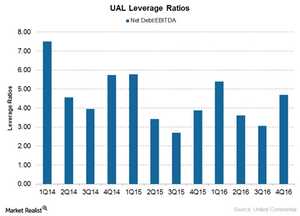
United Continental’s Debt: What You Need to Know
For 2016 overall, United Continental (UAL) has generated $5.5 billion in operating cash flow and $1.9 billion in free cash flow.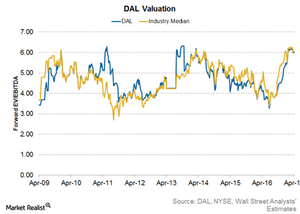
What’s Priced into Delta’s Valuation?
Delta Air Lines (DAL) is currently valued at 5.3x its forward EV-to-EBITDA (enterprise value to earnings before interest, tax, depreciation, and amortization) multiple.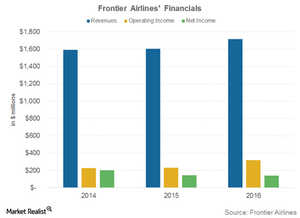
Frontier Airlines Cut Costs and Became Profitable
Frontier Airlines earned 42% of its revenue from ancillary fees or non-ticket revenue in 2016—a significant rise compared to 25% in 2015.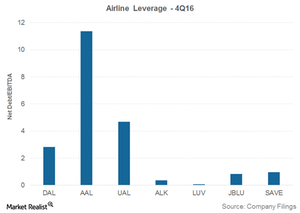
Balance Sheet Analysis of the Major Airline Carriers
In 4Q16, regional carrier Spirit Airlines (SAVE) had a leverage ratio of 0.96x, JetBlue Airways (JBLU) had a leverage ratio of 0.83x, and Alaska Air Group (ALK) had a leverage ratio of 0.36x.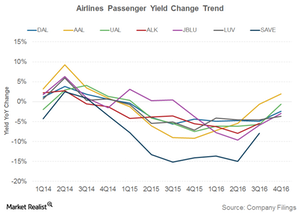
Airlines’ Passenger Yields Fall—What Does It Mean for Investors?
In 4Q16, Southwest Airlines’s (LUV) yields fell 4% year-over-year to 14.7 cents, followed by Alaska Air’s (ALK) 3.3% decline in yield to 13.4 cents.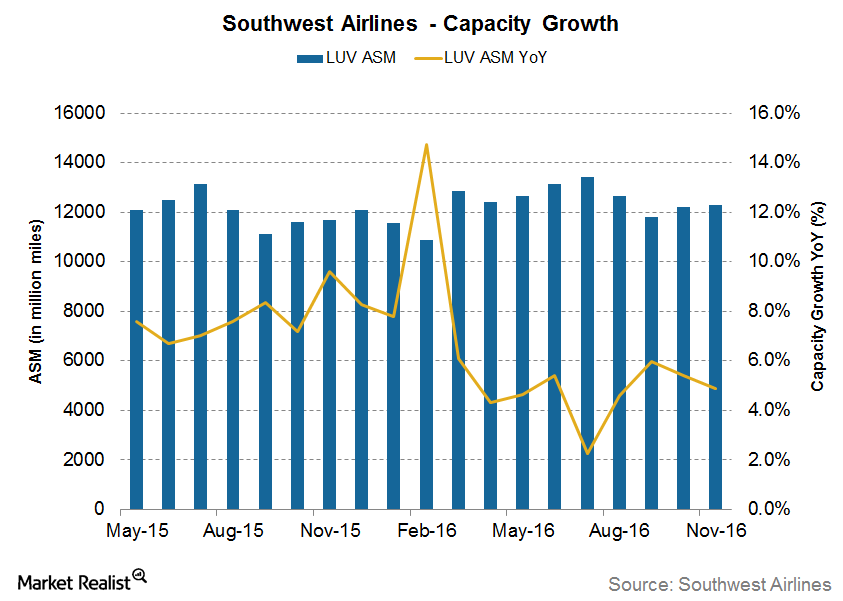
Southwest Airlines: Slowing Capacity Growth in November
For November 2016, Southwest Airlines’ (LUV) capacity grew 4.9% YoY (year-over-year). It’s slower than 5.4% YoY growth the previous month.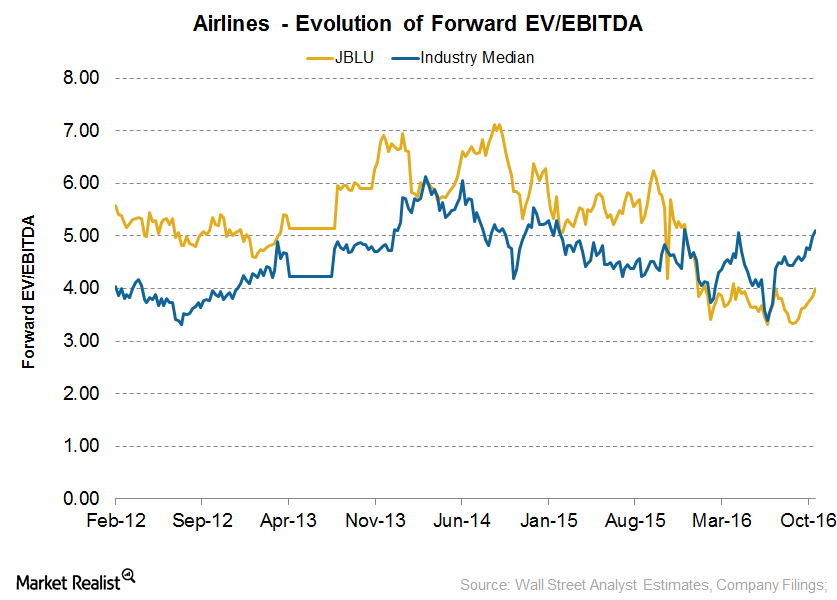
Could JetBlue’s Valuation Change after 3Q16?
Currently, JetBlue Airways (JBLU) is valued at 4x its forward EV/EBITDA (enterprise value to earnings before interest, tax, depreciation, and amortization) multiple.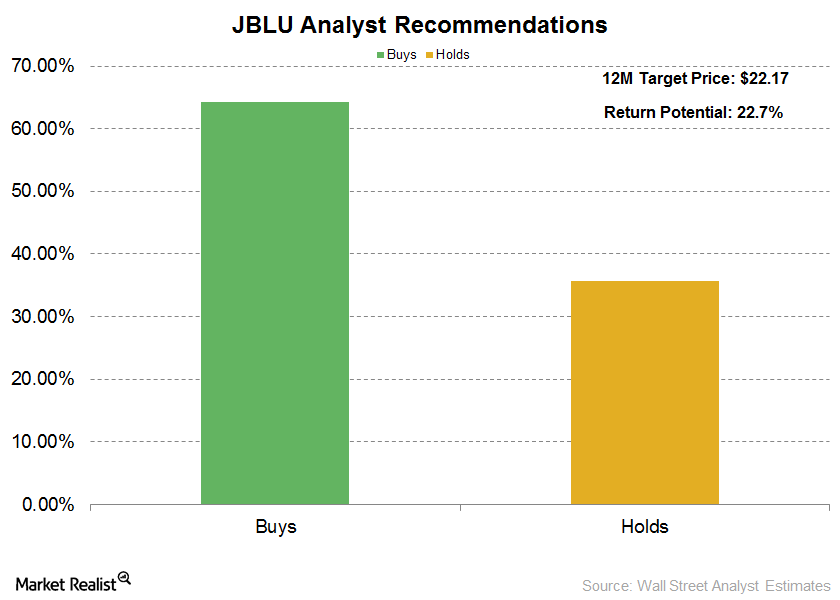
JetBlue: The Latest Analyst Estimates and Recommendations
Following JetBlue’s 2Q16 earnings release, analysts’ consensus estimate for revenues remains unchanged.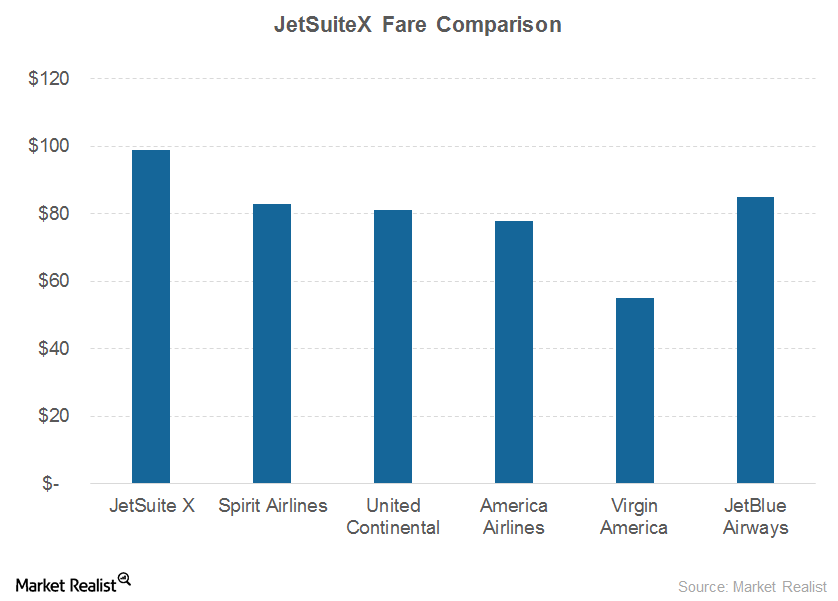
JetBlue’s New Investments: A Pioneer in Private Jet Services?
JetBlue announced that it had undertaken a small stake (the exact stake is unclear) in JetSuite, the fourth-biggest private jet operator in the United States.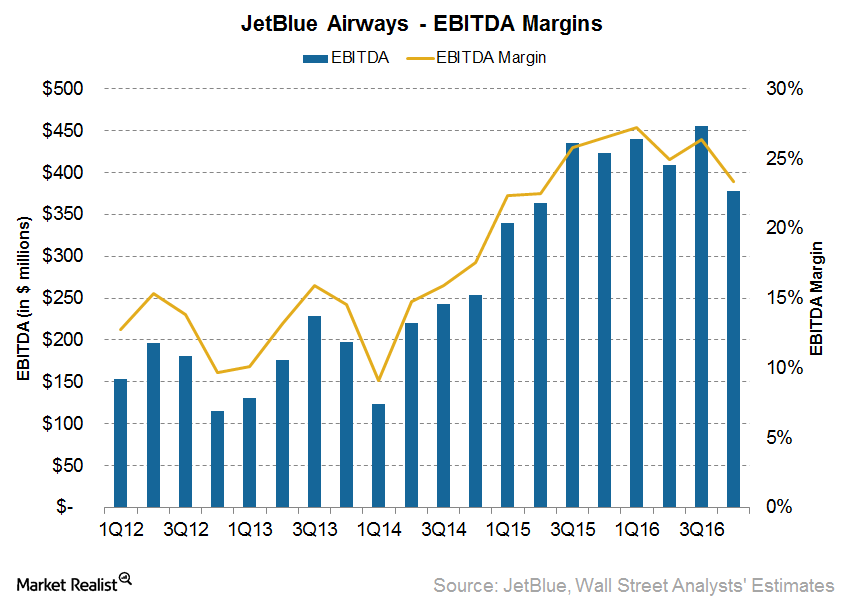
Why Does JetBlue Expect Unit Costs to Rise in 4Q16?
For the third quarter of the year, JetBlue Airways’ (JBLU) operating expenses—excluding fuel and profit sharing—rose 3.1% to 7.86 cents.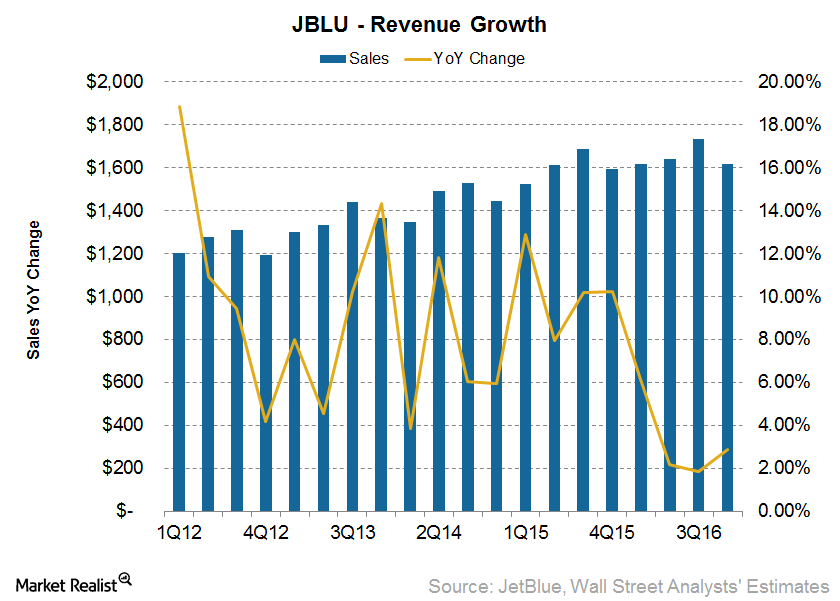
JetBlue’s: Can Investors Expect Improved Revenue in 4Q16?
For 3Q16, JetBlue Airways’ (JBLU) revenues stood at $1.73 billion—a 2.6% year-over-year increase compared to revenue of $1.69 billion in 3Q15.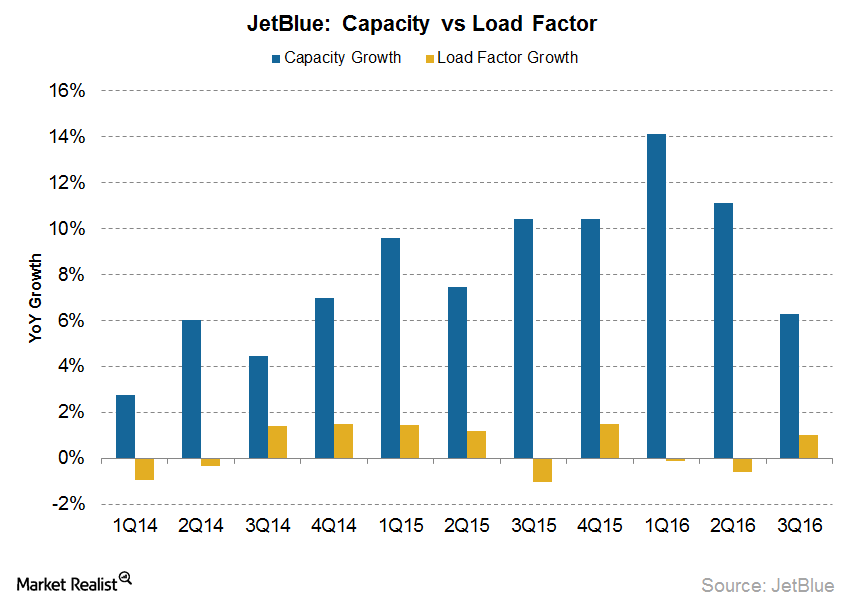
JetBlue Airways: Checking Up on Operational Performance in 3Q16
JetBlue Airways (JBLU) saw average traffic of about 11.9 billion passenger miles for the quarter, a 7.6% year-over-year increase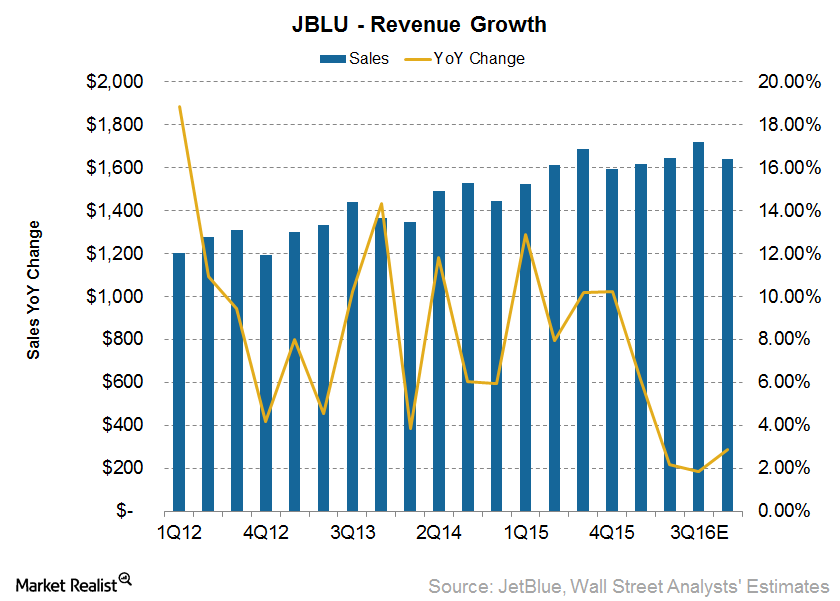
Do Analysts Expect JetBlue’s Revenue to Rise in 3Q16?
Analysts expect JetBlue Airways’ (JBLU) 3Q16 revenue to come in at $1.7 billion, a year-over-year rise of 2.2%.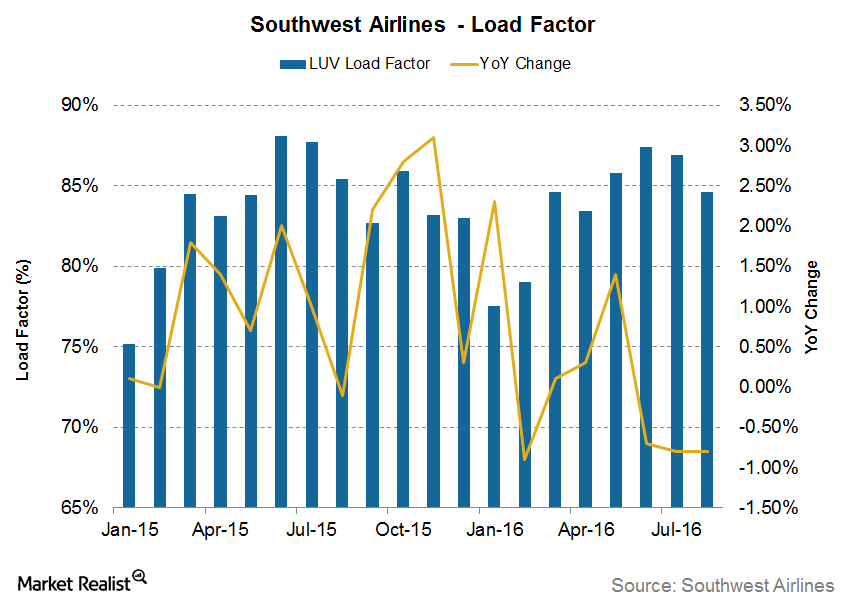
Is Southwest Airlines On Track to Achieve Its Utilization Goals?
In 2015, Southwest Airlines’ prudent approach to capacity growth resulted in the better utilization of its capacity.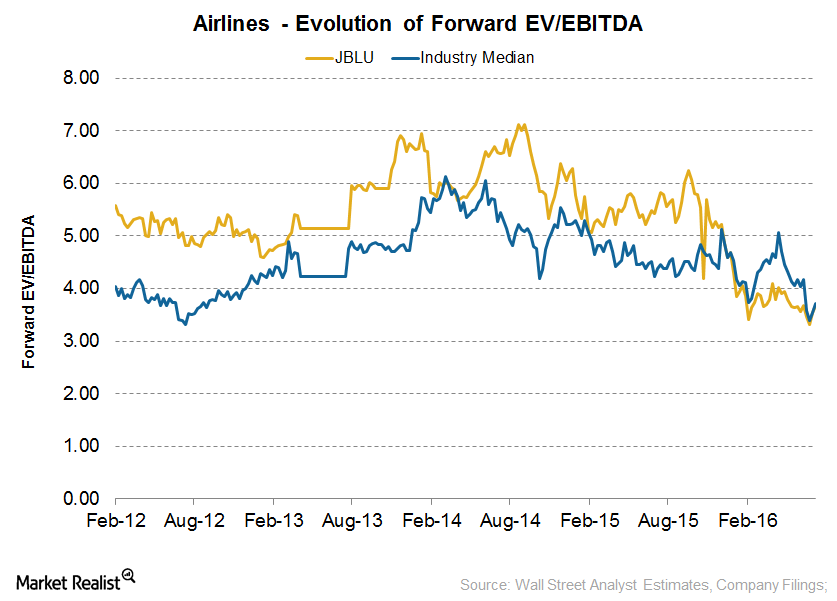
Could JetBlue Airways’ Valuation Change after 2Q16?
As of July 22, 2016, JetBlue was valued at 3.8x its forward EV-to-EBITDA multiple, which is lower than its average valuation of 4.8x since September 2009.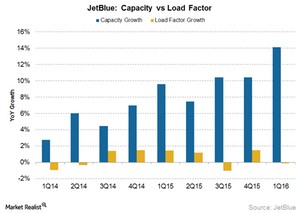
Does JetBlue Airways’s Capacity Growth Support Analyst Estimates?
Capacity growth Like other airlines, JetBlue Airways (JBLU) has taken advantage of falling crude oil prices to expand its existing fleet. JetBlue’s double-digit revenue growth has been fueled by double-digit growth in its capacity. Historically, JetBlue Airways has seen the highest capacity growth among the seven major airlines. Spirit Airlines (SAVE) has seen the highest growth, followed by Alaska […]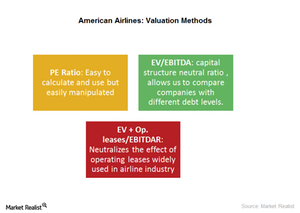
What’s the Best Approach for Valuing American Airlines?
For airlines such as American Airlines (AAL), we go a step further and use an EV+ Op. leases-to-EBITDAR ratio.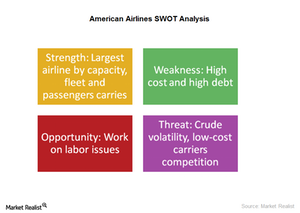
What Are American Airlines’ Key Strengths and Weaknesses?
Some key strengths keep American Airlines ahead of its competitors. It’s the largest airline in fleet, capacity, and number of passengers. It also has a strong hold on key hubs.
American Airlines Stock: The Past, the Crisis, the Recovery
After the merger, American Airlines became the world’s leading airline in terms of fleet size, network, and finances. American Airlines stock has risen more than 270% since 2011.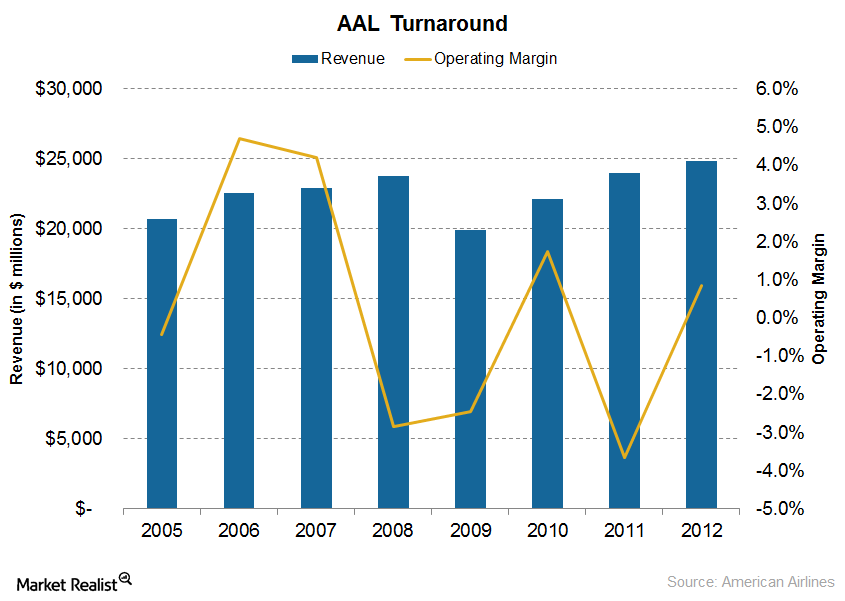
How Did American Airlines Recover from Bankruptcy?
Soon after US Airways declared its intention to merge with American Airlines, AAL started working on its weak points and restructuring costs.
ORION: A Star in United Parcel Service’s Technology Crown
United Parcel Service, through 10,000 routes optimized with ORION, saves up to 1.5 million gallons of fuel per year.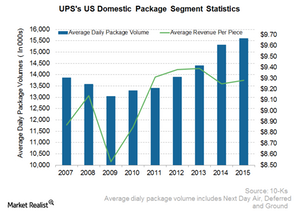
UPS Domestic Package Segment: Largest Courier Service in the US
UPS’s US Domestic Package segment consists of the time-sensitive delivery of letters, documents, and packages across the US. As the jewel in the company’s crown, this segment’s share averaged 61.1% of the total revenues in the last six years.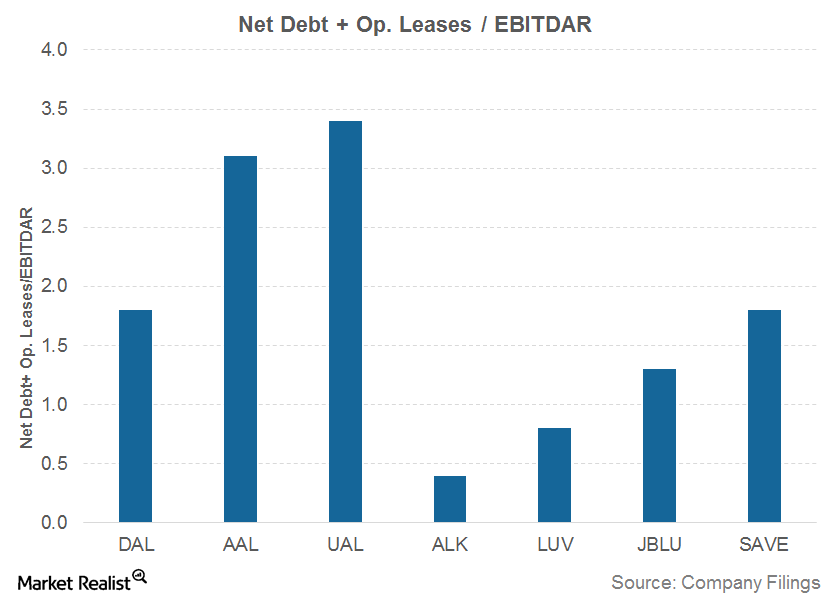
Which Airline Has the Highest Leverage?
The airline industry is a capital-intensive industry with heavy investments required in building infrastructure, fleets, and their maintenance. As a result, airline stocks generally have high levels of debt on their balance sheets.Industrials Must-know: External factors that influence the airline industry
The airline industry has contributed to the globalization of the world economy. It connects buyers and sellers. It also transports goods across nations. It breaks the barrier of distance and time. The industry’s future looks bright. Travel expenditure in the U.S. is expected to grow by 4.3% in 2014 and 5.1% in 2015.
Spirit Airlines’ Valuation Ratio: How Does It Stack Up?
Spirit and its competitors have seen their EV/EBITDA decrease in the last six months due to the fear of a large increase in available seat miles.
How Does Spirit Airlines Manage Its Low-Cost Structure?
Spirit (SAVE) ranks first in profitability among seven airlines in the United States. The main driver for this ranking comes from its exceptional ability to manage costs.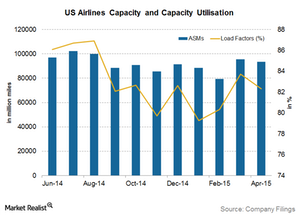
Improving Capacity Utilization Adds to Airline Profitability
Capacity utilization has improved from the lows of ~57% in the 1970s to ~76% in 2014 and 81.88% in year-to-date 2015.Industrials Why political and legal factors impact the airline industry
The airline industry is widely impacted by regulations and restrictions related to international trade, tax policy, and competition. It’s also impacted by issues like war, terrorism, and the outbreak of diseases—such as Ebola. These issues are political. As a result, they require government intervention.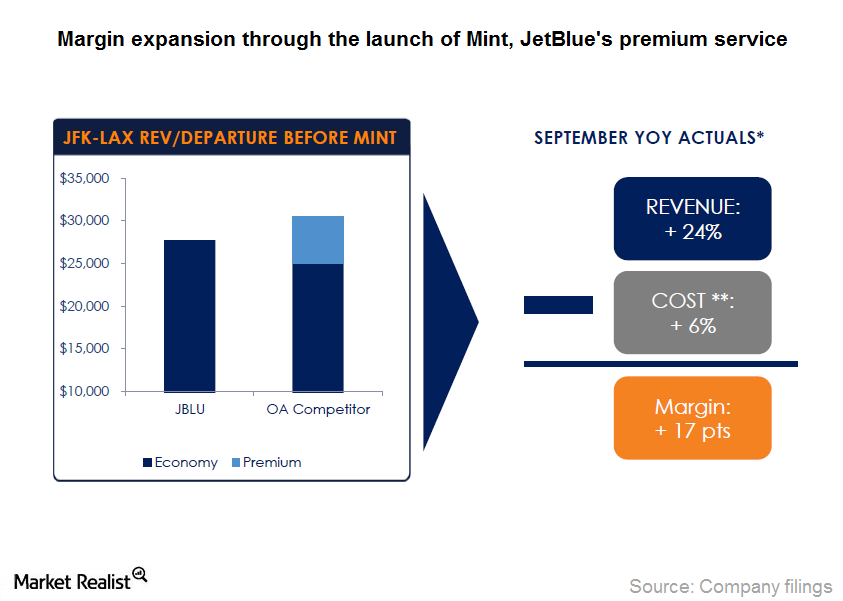
Even More drives JetBlue’s ancillary revenue
Revenue from JetBlues’ Even More Space grew at a five-year compounded annual growth rate of ~30% from $45 million in fiscal year 2008 to $170 million in fiscal year 2013.Macroeconomic Analysis Freight, passenger index values show rising transportation demand
Although trucking is the most widely used mode of transportation, the fastest growing mode of transport is by air.Industrials The global airline market’s key revenue drivers and profitability
According to IATA (or the International Air Transport Association), the global airline industry passenger volume and capacity increased by 5.3% year-over-year in July 2014. Freight volume increased by 5.8%. In July load factor (or capacity utilization) for passengers was 82.3%, and for freight, it was 44.4%.Industrials Why investors should track labor costs in the airline industry
The second largest cost component for airlines is salaries, wages, and benefits. Employment in the U.S. airline industry has increased in the last couple of years when the U.S. economy recovered from the recession and demand for air travel picked up.Industrials Must-know: Why yield is another key driver for airline revenue
Yield is the average fare per passenger per mile. Passenger revenue is calculated by multiplying RPM (or revenue passenger miles) with yield. Yield varies based on demand and supply factors. Since demand for air travel is seasonal, yield is higher during peak seasons.Industrials Must-know: Why airlines should improve their load factor
Load factor is a measure of capacity utilization. It indicates the percentage of total capacity that is utilized by an airline. Since airlines are capital intensive and have high fixed costs, the efficiency with which they utilize their assets is key to generate adequate return on investment.Industrials Must-know: Why available seat miles affect airlines’ revenue
Available seat miles (or ASM) is the measure of airline capacity. It’s calculated as the total number of seats multiplied by the total distance travelled. While RPM (or revenue passenger miles) is a measure of demand, ASM is the measure of supply.
