BP PLC
Latest BP PLC News and Updates

Integrated Energy Stocks: The Top Eight Dividend Yielders
In this series, we’ll look at eight integrated energy stocks and rank them on dividend yields. Royal Dutch Shell (RDS.A) holds the top spot.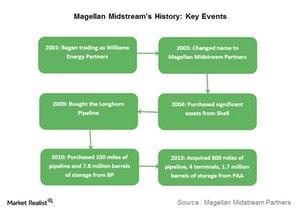
Magellan Midstream Partners: A Brief History
Magellan’s history Magellan Midstream Partners (MMP), which began trading in 2001, has grown through various asset acquisitions and expansion projects over the years. Magellan was formerly a part of Williams Companies (WMB). The company started trading as Williams Energy Partners in 2001, and changed its name to Magellan Midstream Partners in 2003. In 2004, the […]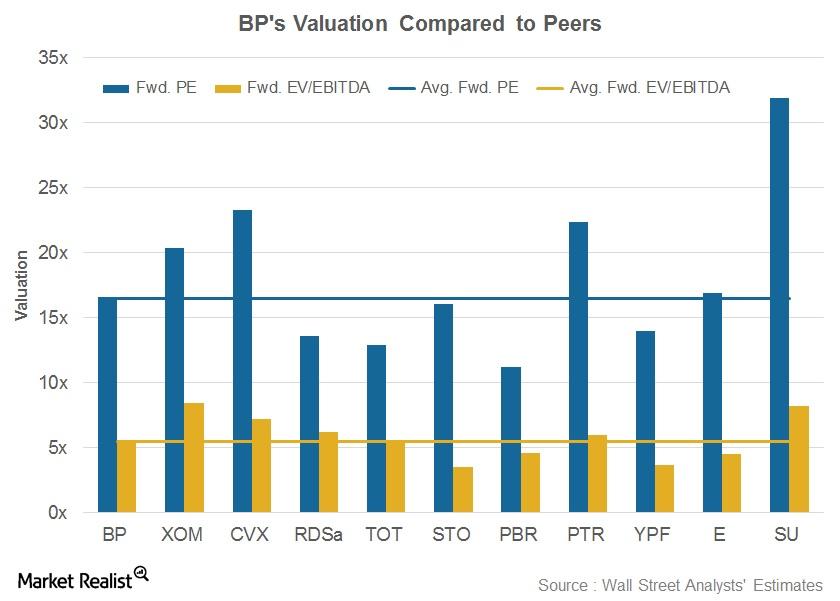
What’s BP’s Valuation?
BP (BP) is now trading at a forward PE (price-to-earnings ratio) of 16.6x, above its peer average of 16.5x.
Understanding KBR’s Business Segments
Business segments KBR’s (KBR) business is classified into three core segments (government services, technology and consulting, and engineering and construction) and two non-core segments (non-strategic business and other business). Government services The government service segment’s primary focus is providing support solutions to US, UK, and Australian government agencies. According to KBR’s Form 10-K, the segment offers “full […]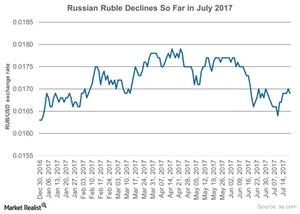
How Has the Ruble Performed in July 2017?
The Russian ruble (ERUS) tends to move in line with crude oil prices (USO) (UCO).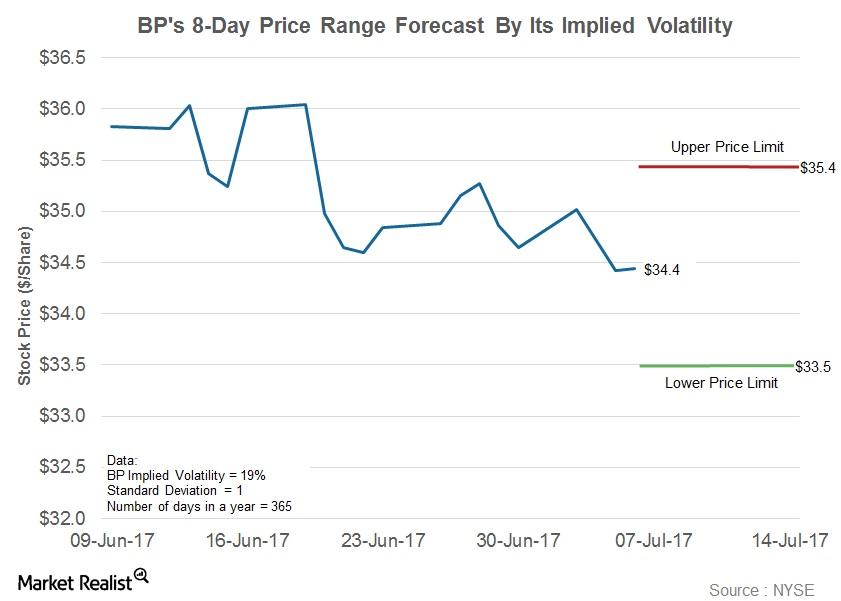
Estimating BP’s Stock Price Using Implied Volatility
What is implied volatility? Volatility gauges changes in a stock’s return over a period. When estimated based on historical stock prices, it is called historical volatility. We can estimate the future volatility, or implied volatility, of security using an option pricing model. A high implied volatility would indicate that a stock price is expected to move […]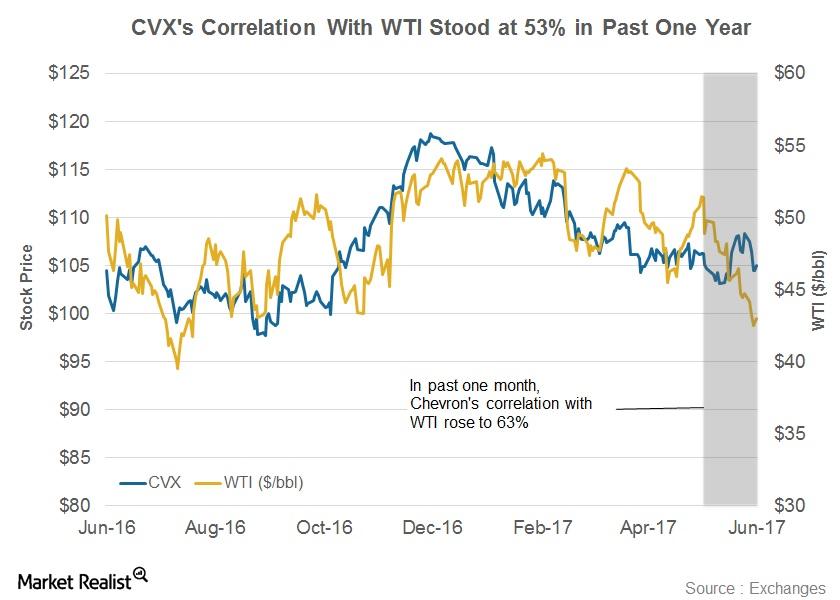
Correlation of Chevron Stock with WTI Crude Oil
The correlation coefficient of Chevron (CVX) versus WTI stood at 0.53 in the last one-year period.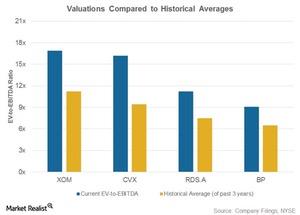
Energy Stock Valuations and Their Historical Averages
EV-to-EBITDA multiples in 1Q17 for ExxonMobil (XOM), Chevron (CVX), Royal Dutch Shell (RDS.A), and BP (BP) were above their historical averages.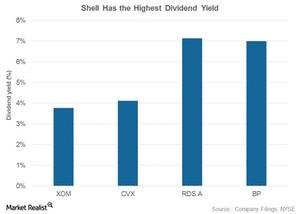
Who Has Higher Dividend Yields: RDS.A, XOM, CVX, or BP?
Shell has the highest dividend yield of 7.1% among the integrated energy stocks we’re covering in this series.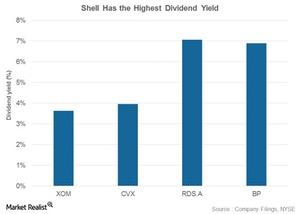
Inside Integrated Energy’s Dividend Yields: Comparing XOM, CVX, RDS.A, and BP
ExxonMobil (XOM), Chevron (CVX), Royal Dutch Shell (RDS.A), and BP (BP) have consistently given returns to shareholders in the form of dividends.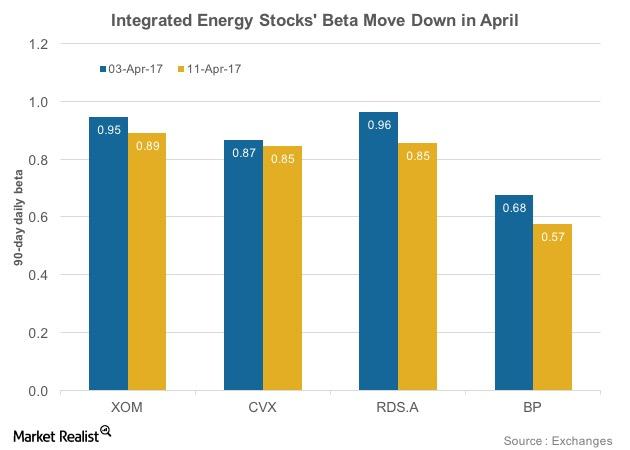
Understanding Integrated Energy Stocks’ Betas in April 2017
Royal Dutch Shell’s (RDS.A) 90-day daily beta fell from 0.96 on April 3, 2017, to 0.85 on April 11, 2017.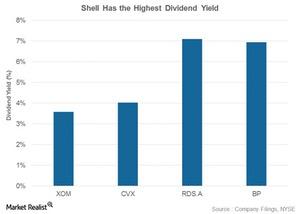
Integrated Energy Stocks: Who Stands Tall in Dividend Yield?
Shell’s dividend yield is 7.1%, the highest among the integrated energy stocks in this series.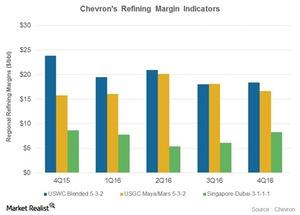
A Look at Chevron’s Refining Margin Trends
Chevron’s refining capacity Before we analyze Chevron’s (CVX) refining margin trends, le’s quickly look at its refining capacity. Chevron’s total refining capacity stands at 1.8 MMbpd (million barrels per day). Most of Chevron’s capacity, around ~1 MMbpd, is in the United States. In the international arena, Chevron has combined refining capacity of 0.3 MMbpd in South […]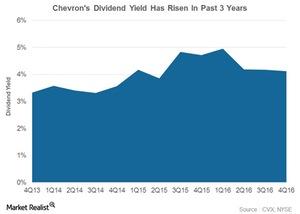
How Chevron’s Dividend Yield Has Trended
Chevron’s dividend yield Chevron (CVX) has consistently given returns to shareholders in the form of dividends. Therefore, we have evaluated its dividend yields. Yield is calculated as a ratio of the annualized dividend to stock price. Chevron’s dividend yield rose from 3.3% in 4Q13 to 4.1% in 4Q16, due to a dividend increase coupled with […]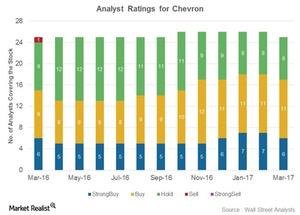
Why Most Analysts Rate Chevron a ‘Buy’
Analyst ratings for Chevron Chevron (CVX) has been rated by 25 analysts. Of the total, 17 analysts have given “buy” or “strong buy” ratings, eight have given “hold” ratings, and none have given “sell” or “strong sell” ratings on the stock. These ratings have improved from March 2016, when Chevron had fewer “buy” ratings, more […]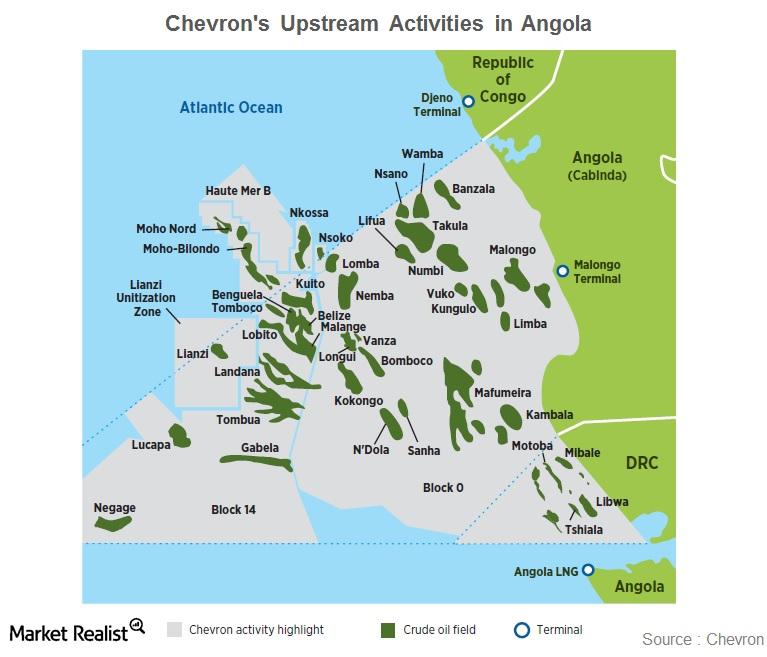
Chevron’s Mafumeira Sul Project Kick-Starts Production
In this series, we’ll provide updates on Chevron’s market performance. We’ll examine CVX’s latest stock performance, analyst ratings, dividend yield, PEG (price-to-earnings-to-growth) ratio, beta, short interest position, institutional ownership status, and implied volatility movement.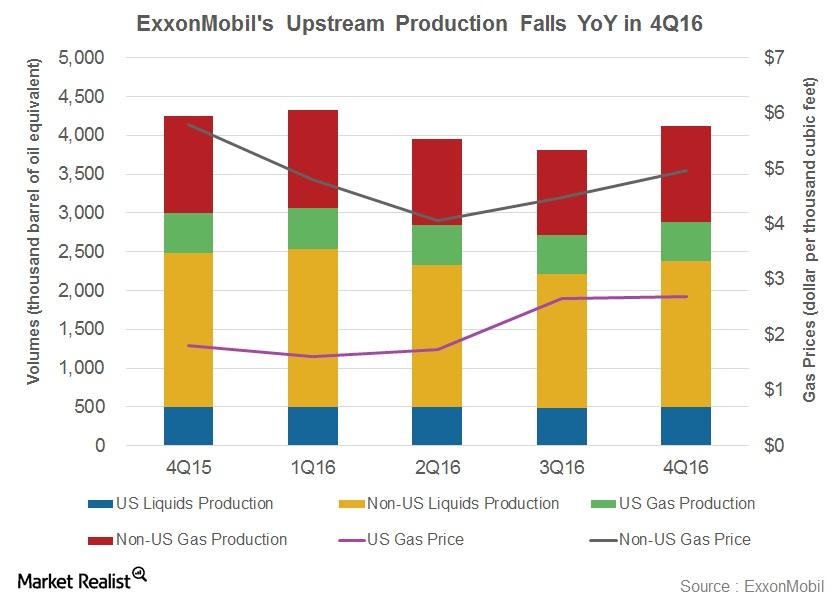
ExxonMobil’s Robust Upstream Portfolio: Poised for Growth
ExxonMobil (XOM) produced 4.1 MMboepd (million barrels of oil equivalent per day) from its worldwide operations in 4Q16.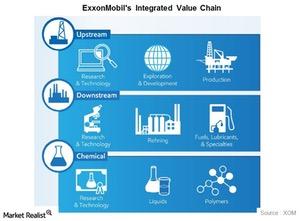
ExxonMobil Focuses on Integrated Growth, Reveals the Path Forward
In its latest analyst meeting, ExxonMobil (XOM) announced that it had plans to concentrate on an integrated earnings model, capturing value at every stage of the energy chain.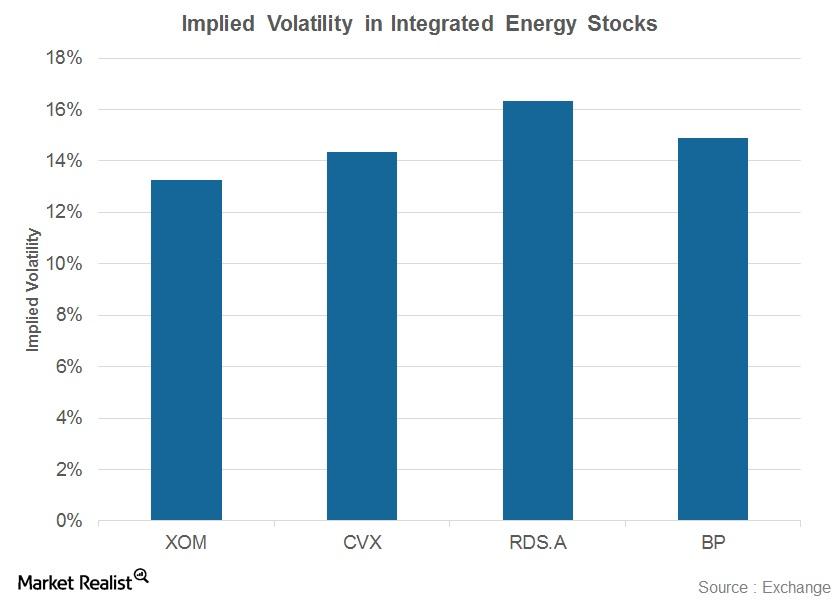
Where Do Implied Volatilities in Integrated Energy Stocks Stand?
Implied volatility in Royal Dutch Shell (RDS.A) currently stands at 16%, which is the highest compared to peers ExxonMobil (XOM), Chevron (CVX), and BP (BP).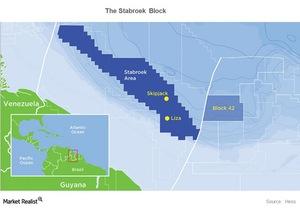
Once Again, ExxonMobil Discovers Oil in Guyana
ExxonMobil (XOM) has found oil in the Payara-1 Well in the Stabroek Block, positioned 120 miles offshore Guyana. This is the company’s second discovery in the block.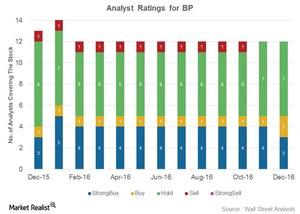
Why Do a Majority of Analysts Rate BP as a ‘Hold’?
BP (BP) plans to rebalance its sources and uses of cash by 2017 at an oil price level of $50–$55 per barrel.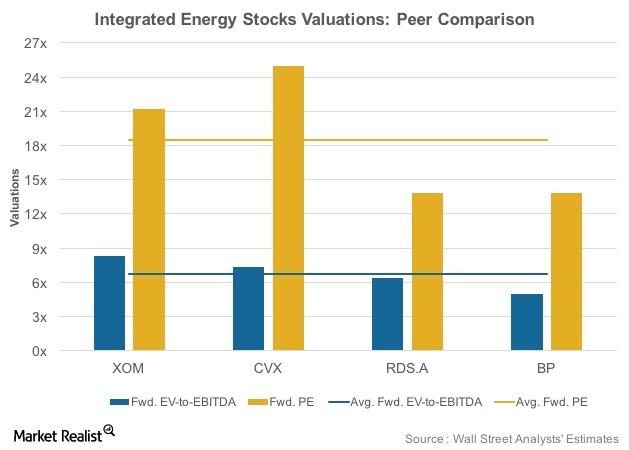
Integrated Energy Stocks’ Post-3Q16 Forward Valuations
XOM trades at 8.3x forward EV-to-EBITDA and 21.2x forward price-to-earnings, both above its peer averages.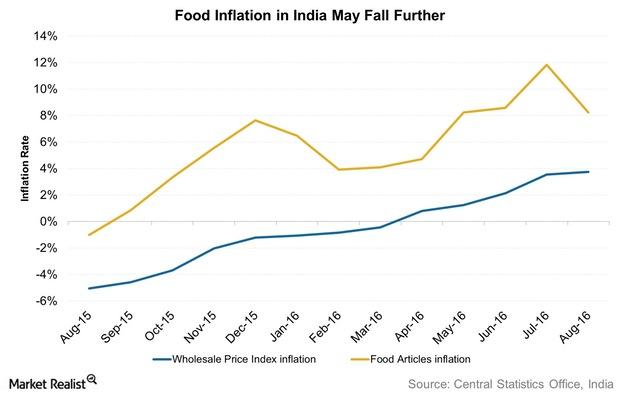
How Does the RBI See Food Inflation Panning out in India?
Components of inflation While food inflation in India has been pushing retail inflation up, fuel inflation (BP) (STO) (RDS.B), another important component, has been subdued. According to the October monetary policy statement issued by the RBI (Reserve Bank of India), “Fuel inflation has moderated steadily through the year so far.” The RBI has also announced […]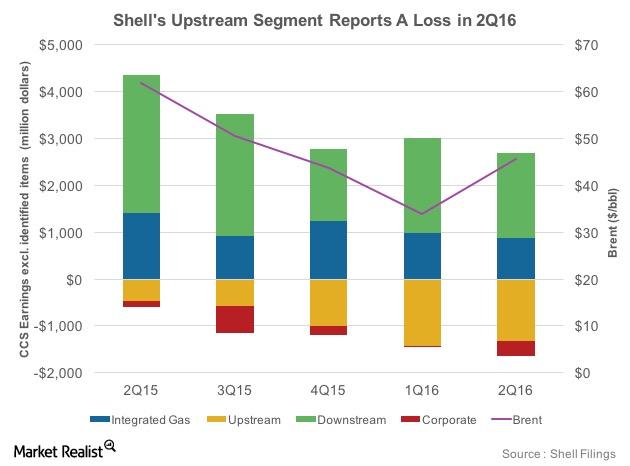
Shell’s Segments: Upstream Continues to Report Losses
Falling crude oil prices have changed the segmental dynamics within integrated energy companies such as Royal Dutch Shell (RDS.A).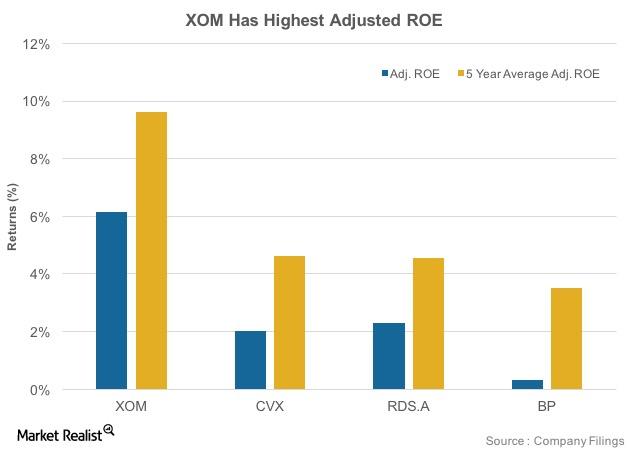
Look to This Energy Company for the Best ROE
Battered by falling oil prices, the 2Q16 ROE numbers for ExxonMobil (XOM), Chevron, Royal Dutch Shell, and BP were lower than their five-year average historical ROE figures.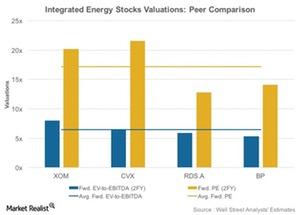
Looking 2 Years Out, Energy Stocks Trade at Respectable PEs
ExxonMobil (XOM) trades at an 8.1x EV-to-EBITDA multiple and a 20.2x price-to-earnings ratio, both above its peers’ averages.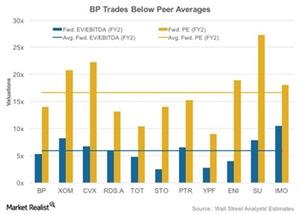
BP’s Forward Valuations: A Peer Comparison
In this article, we’ll consider BP’s forward valuations compared to those of its peers. BP’s market cap stands at ~$105 billion.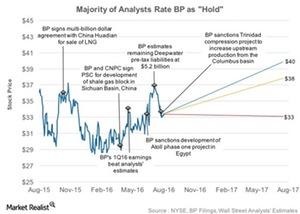
Why Most Analysts Recommend ‘Holds’ on BP
Analysts’ ratings for BP (BP) show that 31% of those covering the stock rate it as a “buy,” and 61% rate it as a “hold.”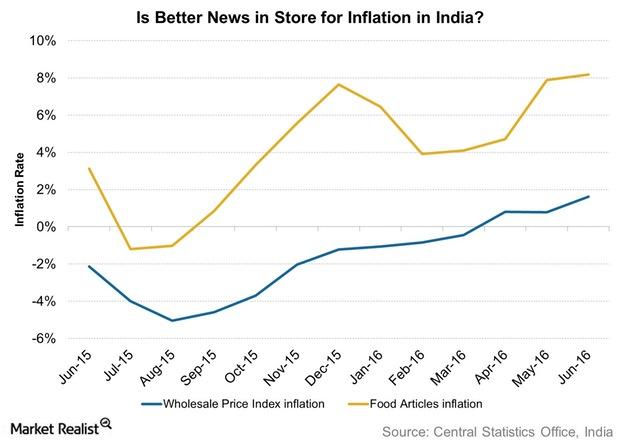
What Risks Does the RBI See for Retail Inflation?
The RBI thinks that risks to inflation are “tilted to the upside.” A subsequent rise in inflation could have a negative impact on consumer spending.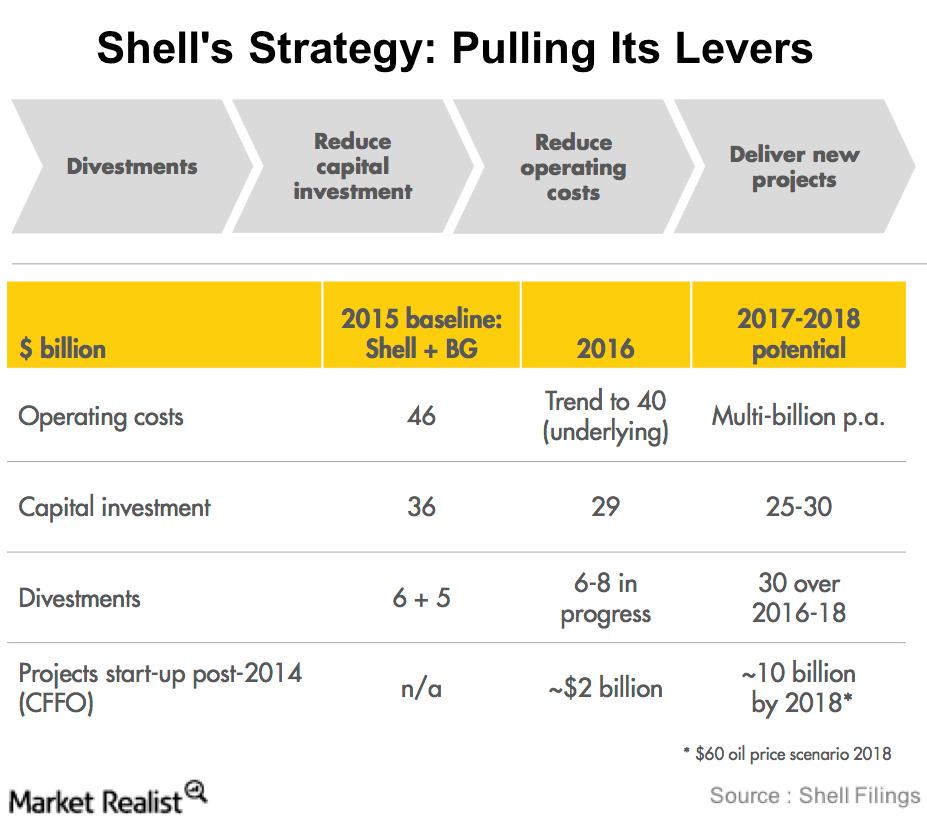
Shell’s Strategy: Pulling Its Levers
Shell plans to restructure itself to become more resilient to lower oil prices and more focused in terms of assets. To do this, it plans to use four levers.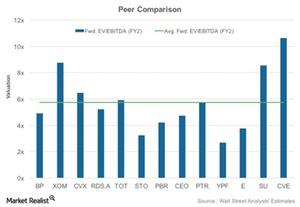
A Forward Valuation Comparison of BP’s Competitors
BP’s market cap stands at ~$100 billion. Among the company’s peers, ExxonMobil (XOM) has the highest market cap of ~$371 billion.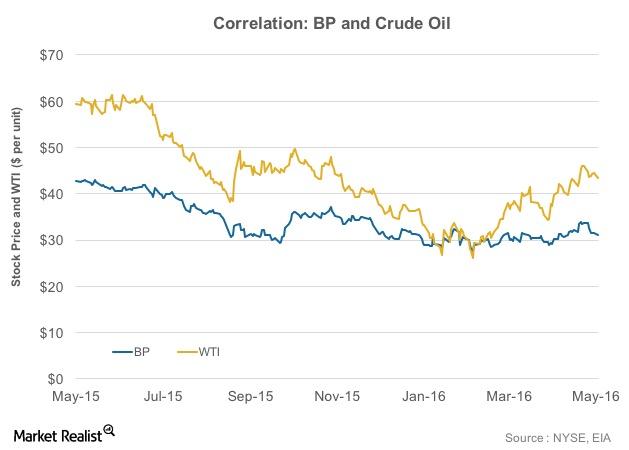
How Do BP’s Stock and Crude Oil Prices Correlate?
To what degree are integrated energy companies such as BP affected by volatility in crude oil prices? This varies from company to company.
Why TIPS Are an Attractive Investment Option Right Now
Asset managers have warned that costs may rise. They recommend inflation-linked securities such as Treasury inflation-protected securities (or TIPS).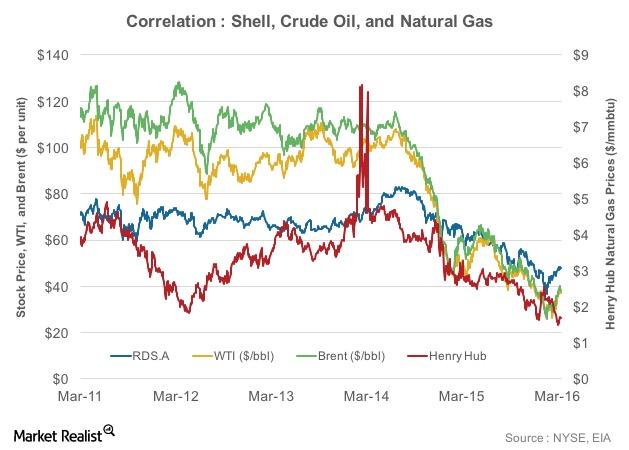
Correlation Analysis: Shell and Oil Price
Shell’s stock price has largely moved in-line with crude oil prices. This is reflected in the results of a correlation test.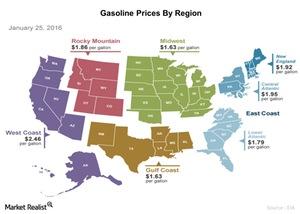
Why Are Gasoline Prices So High in the West Coast Region?
Gasoline prices in the West Coast region were at $2.45 per gallon on January 25, 2016—around $0.60 per gallon higher than the average US gasoline prices.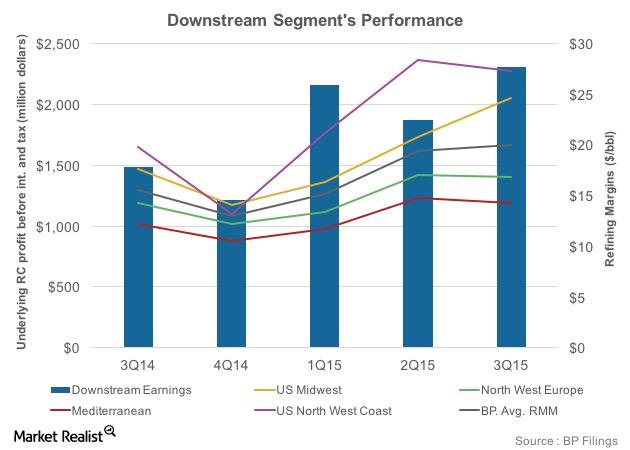
Overview of BP’s Refining Segment and Margins
BP’s refining segment has 2.0 million barrels per day of refining capacity worldwide. In the United States, it has around 0.74 MMbpd of refining capacity.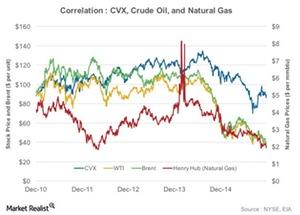
The Correlation of Chevron’s Stock to Oil and Natural Gas Prices
The integrated energy model provides Chevron’s insulation from oil and natural gas price volatility. This is reflected in the results of the correlation test.
Bearish Crude Oil Market Has Put $5 Trillion at Risk
The depressed energy market has erased just over $1 trillion of market capitalization from oil and gas companies around the globe.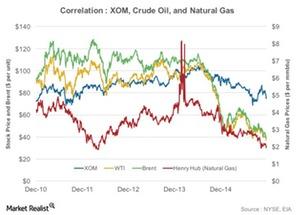
Correlation Analysis: ExxonMobil’s Crude Oil, Natural Gas prices
The correlation coefficients of ExxonMobil to Brent, West Texas Intermediate, and Henry Hub natural gas prices stand at 0.22, 0.35, and 0.36, respectively.
How OPEC’s Crude Oil Reserves Affect the Crude Oil Market
OPEC countries control 40% of global crude oil production and have around 81% of global crude oil reserves, as of 2014.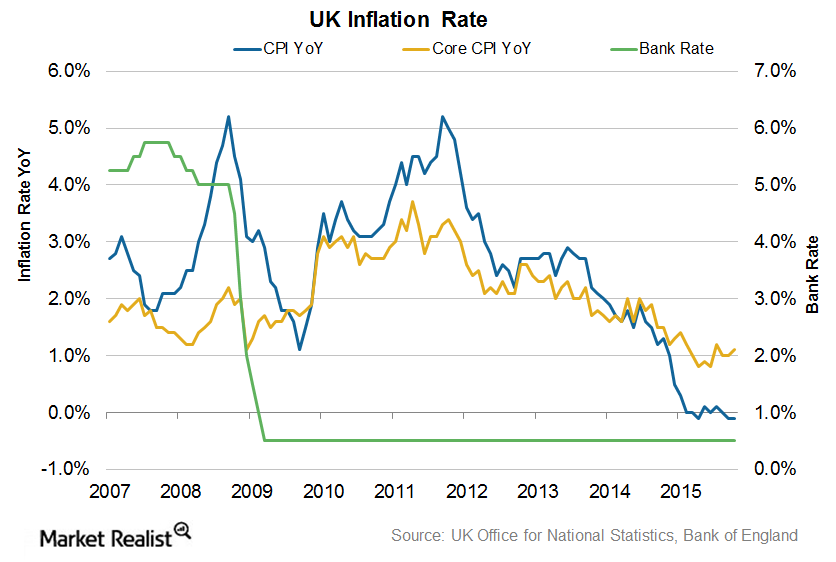
Falling Crude Oil Prices Keep UK Inflation in Check
The Bank of England or BoE is targeting an inflation rate at 2.0% in order to attain economic growth in the United Kingdom.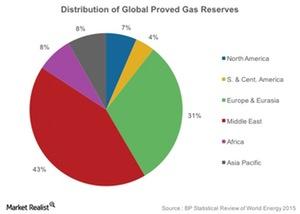
A Vital Resource: Which Region Has the Most Natural Gas Reserves?
Total global natural gas reserves stand at 6,606 trillion cubic feet, of which 43% are in the Middle East.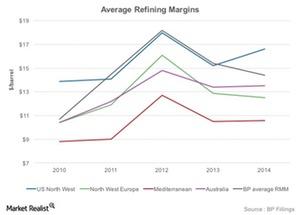
What Are the Key Indicators of Refining Profits?
Investors should track the GRM and crack spread of a region where a company’s refinery is located.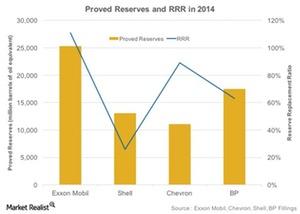
Why Is Reserve Replacement Ratio Important to the Upstream Sector?
RRR reflects how many barrels of oil equivalent the company adds to its reserves in replacement of ones that are produced.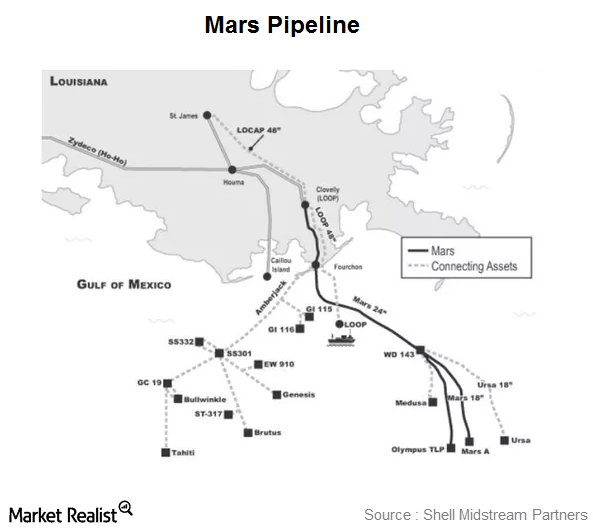
Shell Midstream’s Mars: A Corridor Pipeline Servicing the Gulf
Shell Midstream Partners (SHLX) has a 28.6% ownership in the Mars pipeline, and Shell Pipeline Company has a 42.9% interest.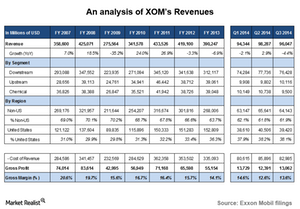
A key analysis of ExxonMobil’s revenues
ExxonMobil’s businesses and revenues depend on crude oil and natural gas’ price levels. In the first three quarters of 2014, ExxonMobil reported revenues of ~$290 billion.Consumer BP lost 55% shareholder value after the Deepwater Horizon incident
Deepwater Horizon was a deepwater, offshore oil drilling rig owned by Transocean (RIG) and operated by BP Plc. (BP). On April 20, 2010, while drilling at the Macondo Prospect, there was an explosion on the rig caused by a blowout that killed 11 crew members.