Vanguard Energy ETF
Latest Vanguard Energy ETF News and Updates
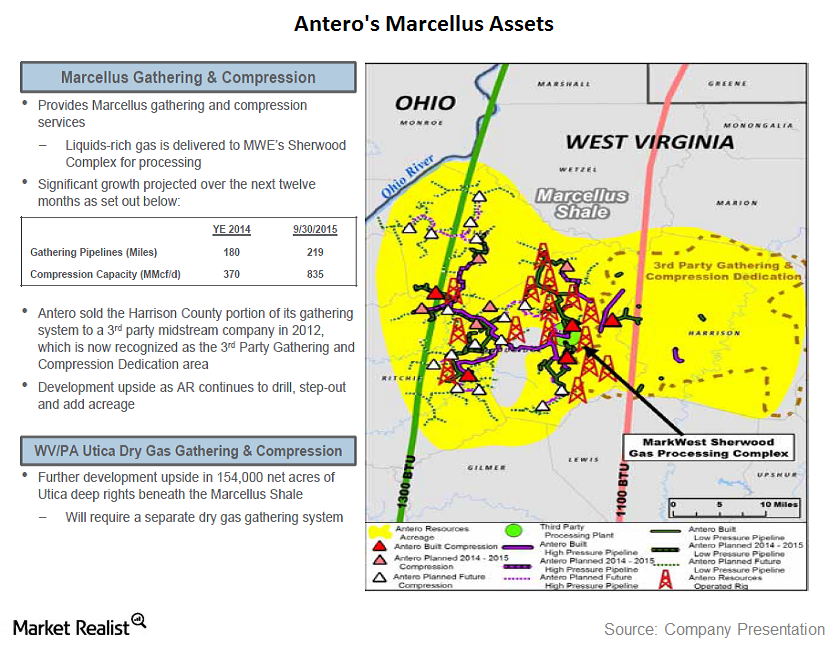
Key update on Antero Midstream’s assets
Antero Resources’ current acreage is focused in the Marcellus Shale in West Virginia and the Utica Shale in Ohio.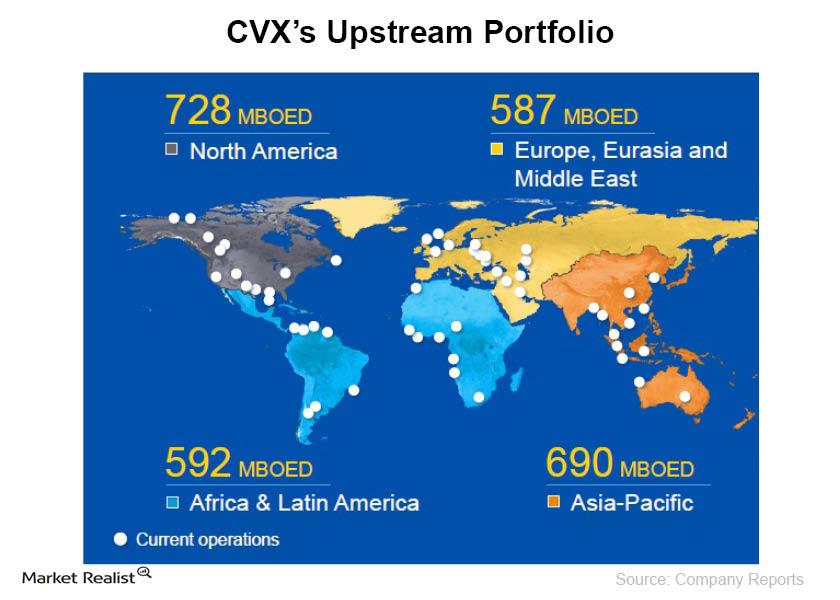
Chevron Corporation: A must-know brief overview
Chevron Corporation is currently trading at EV-to-2014E EBITDA of 5x, has an approximately $239 billion market cap, and ~$245 billion enterprise value.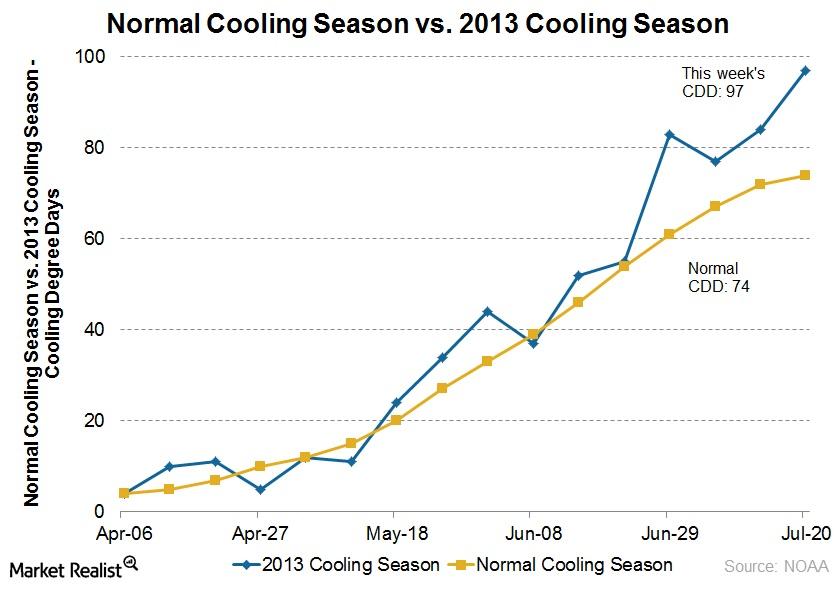
Why the summer heat wave supports natural gas prices
A heat wave that has persisted in the US has helped to lift natural gas prices.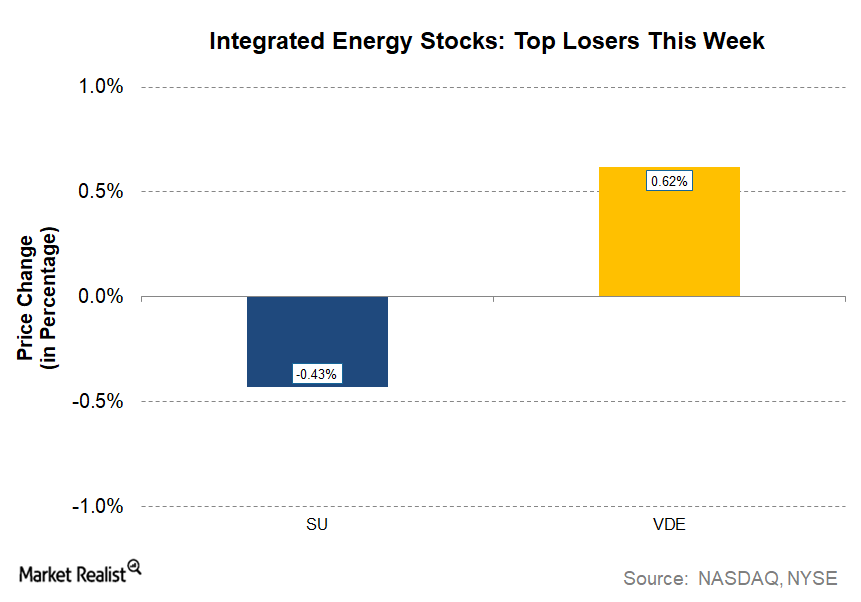
Suncor Energy: The Only Integrated Energy Loser This Week
Suncor Energy (SU) is the only losing stock in the current week from the integrated energy sector. It fell from last week’s close of $34.67 to $34.52 on October 11, 2017.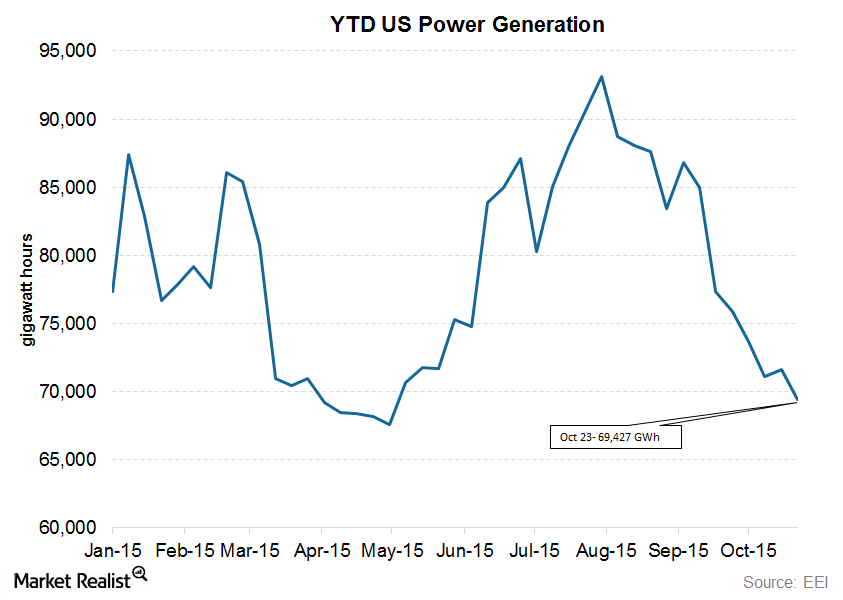
US Power Generation Down Again: An Analysis of Trends
An increase in US power generation numbers is expected for the week ended October 30, 2015.
Why oil prices spiked on tensions in Gaza and Ukraine
Early last week, WTI crude oil had eased to close to $99 following Libya’s restarting exports from major ports and abating fears over supply disruptions in Iraq.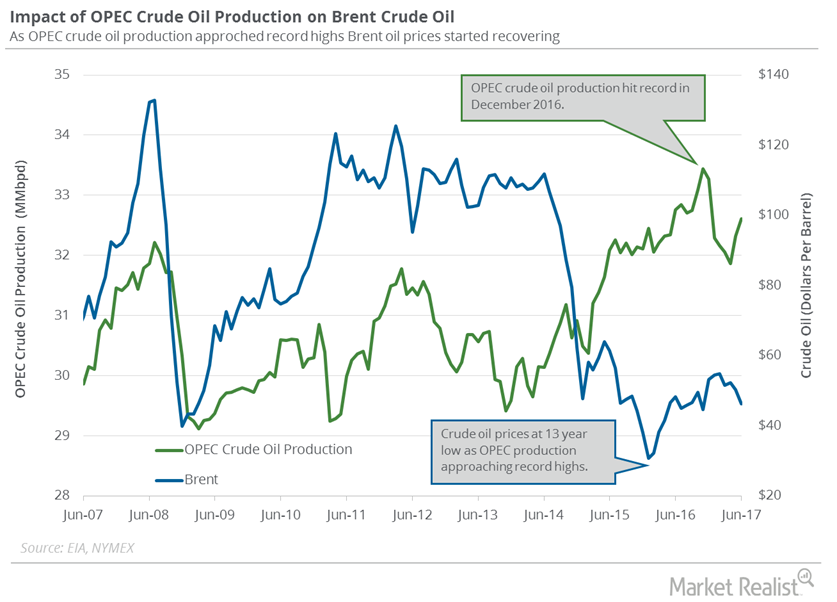
What to Expect from OPEC’s Crude Oil Production in August 2017
October WTI (or West Texas Intermediate) crude oil (USO) (UCO) futures contracts rose 0.4% and were trading at $47.73 per barrel in electronic trade at 2:00 AM EST on August 22, 2017.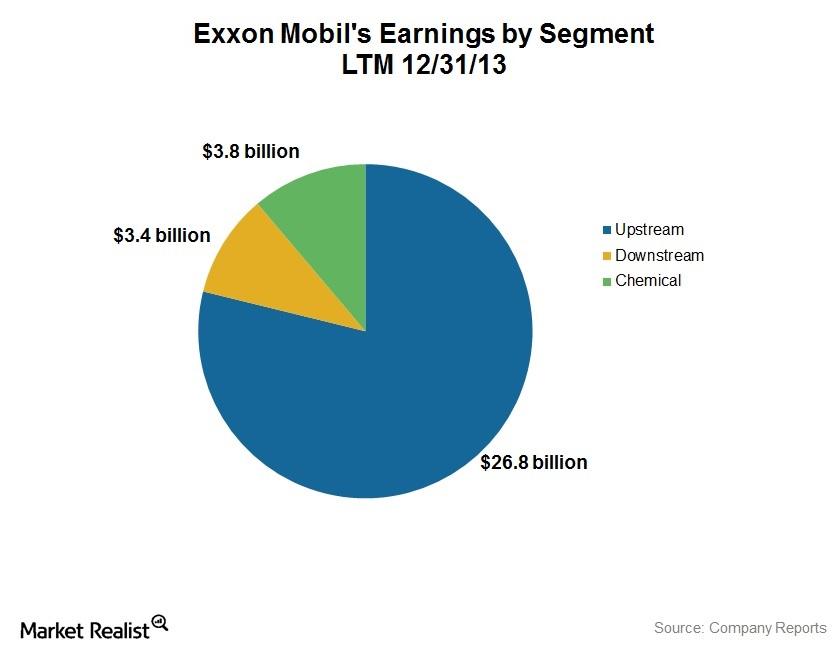
An essential guide to Exxon Mobil: XOM’s major areas of operation
Exxon Mobil has three major business segments: Upstream, Downstream, and Chemical. Upstream contributes the most to XOM’s earnings.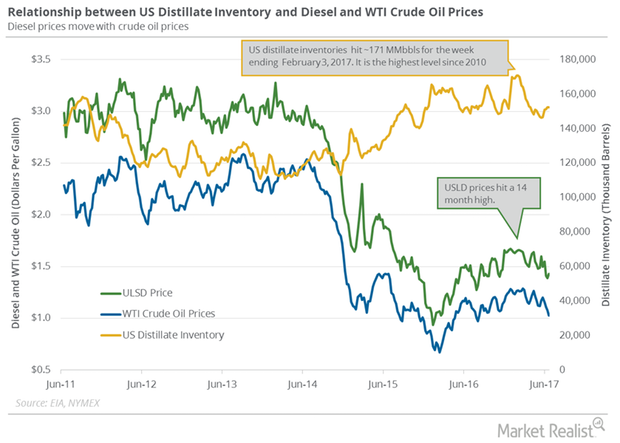
US Distillate Inventories Fell for the First Time in 5 Weeks
The fall in distillate inventories supported diesel and crude oil futures on June 28, 2017. US diesel futures rose 1.4% to $1.43 per gallon on June 28.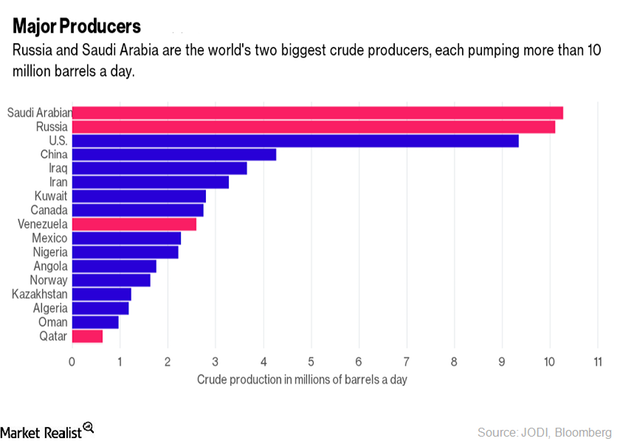
Will Oil Producers’ Meeting Support Crude Oil Prices in September?
OPEC producers will be meeting at an energy forum in Algeria from September 26–28, 2016. Crude oil prices are up by 16% so far in August 2016.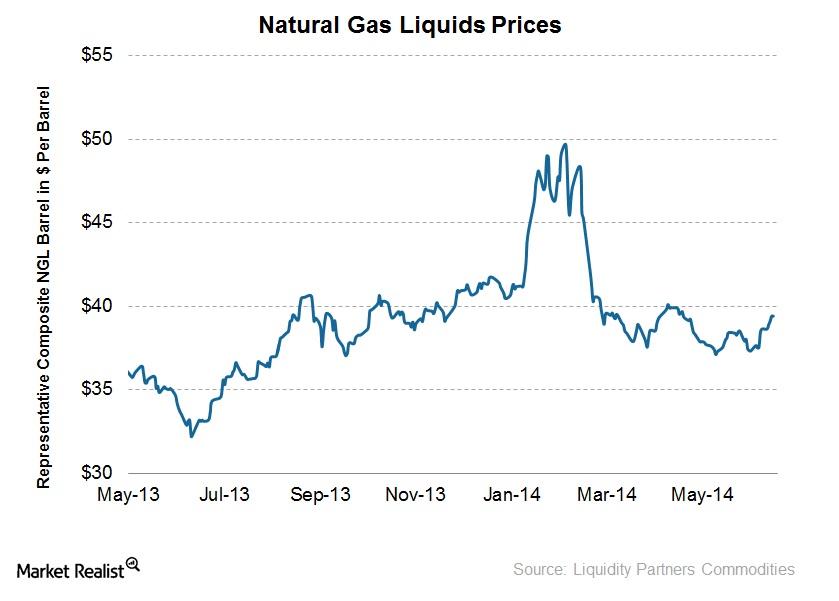
Natural gas liquids prices rise, boosted by propane prices
The representative NGL barrel reached highs of up to ~$50 per barrel in early February, given the strength in propane prices due to a cold winter as well as natural gas prices that pushed ethane prices up.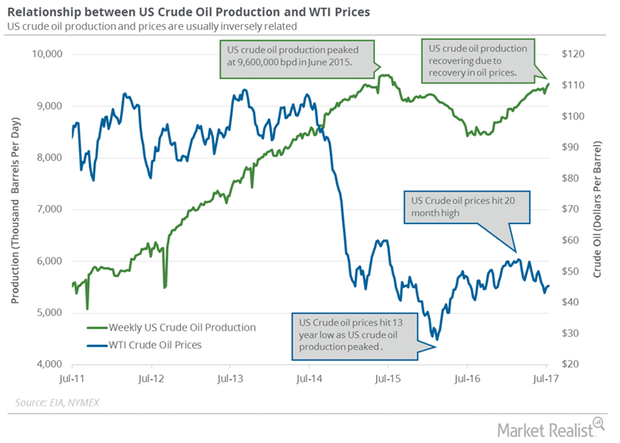
Crude Oil Futures Near 7-Week High
September US crude oil (RYE) (VDE) (BNO) futures contracts rose 3.3% to $47.8 per barrel on July 25, 2017.
US Distillate Inventories Rose for the Fourth Time in 5 Weeks
US distillate inventories rose for the fourth time in the last five weeks. They rose ~3% in the last five weeks, which is bearish for diesel and oil prices.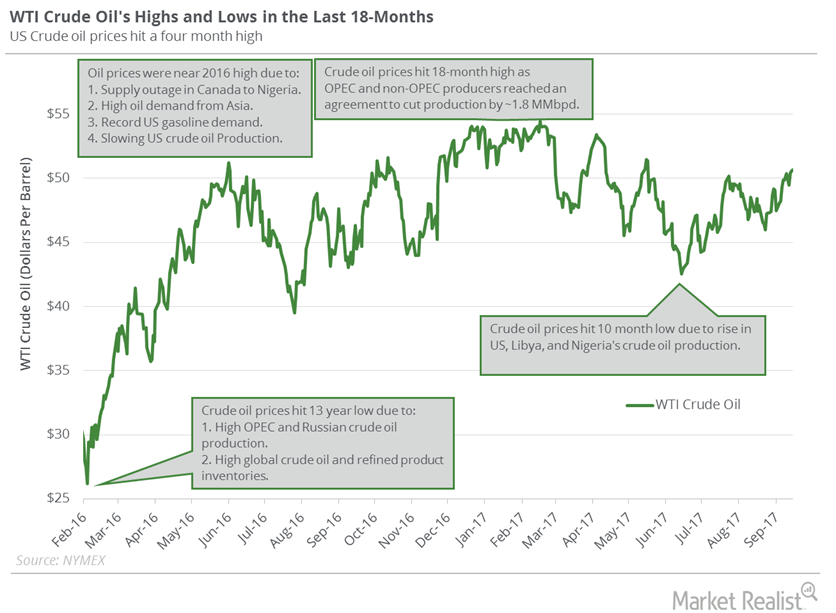
Will US Crude Oil Futures Fall from 4-Month Highs?
WTI (West Texas Intermediate) crude oil (RYE) (VDE) futures hit $26.21 per barrel on February 11, 2016—the lowest level in more than a decade.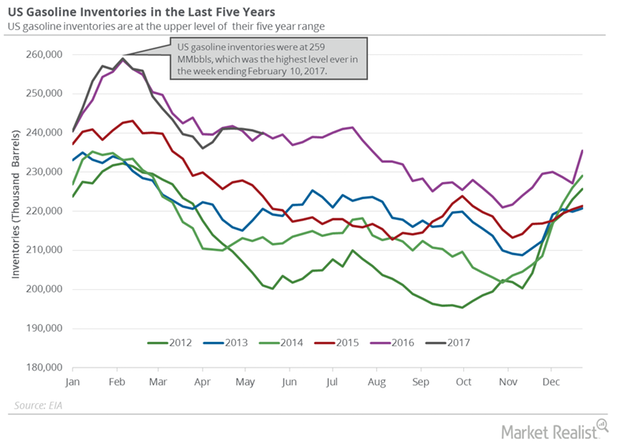
US Gasoline Inventories Fell Less, Pressured Gasoline Prices
The EIA released its weekly crude oil report on May 24, 2017. US gasoline inventories fell by 0.8 MMbbls to 239.9 MMbbls on May 12–19, 2017.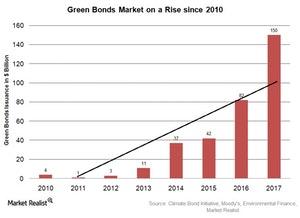
Green Bonds Issuance Show Signs of Growth in 2017
Green bonds carry the same risk-return profile as conventional bonds. However, these bonds fund projects focused on energy efficiency, clean water, transportation, biodiversity, and sustainable waste management.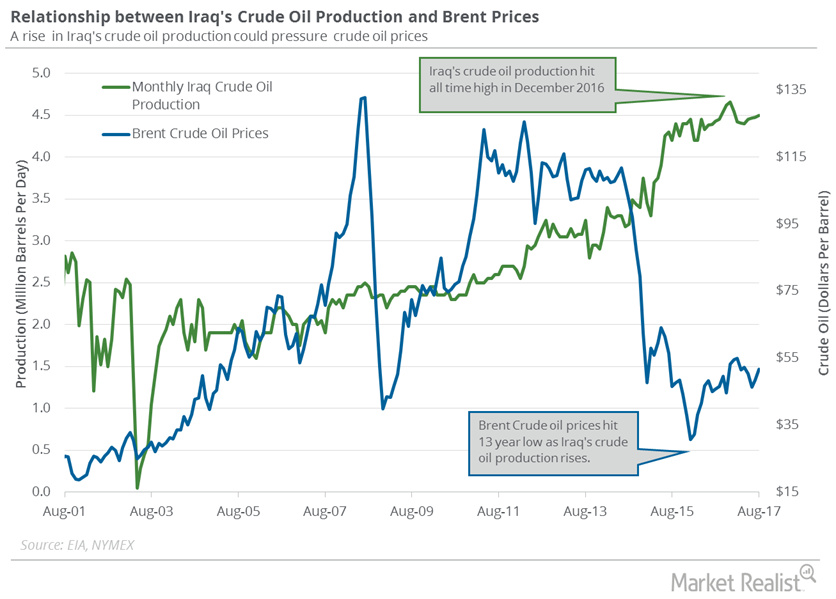
Geopolitical Tensions Impact Crude Oil Prices
On October 3, 2017, Iraq banned selling dollars to Kurdistan’s banks due to the vote in the referendum. Geopolitical tensions could impact crude oil prices.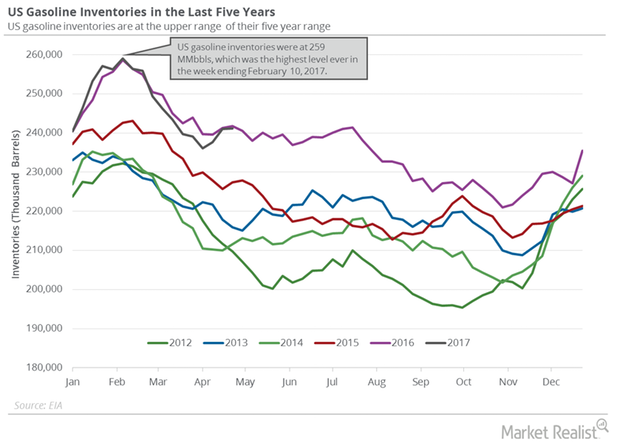
Why US Gasoline Inventories Rose for the Third Straight Week
A less-than-expected rise in gasoline inventories supported gasoline prices on May 3, 2017. Gasoline and crude oil (DIG) (SCO) (VDE) prices rose on May 3.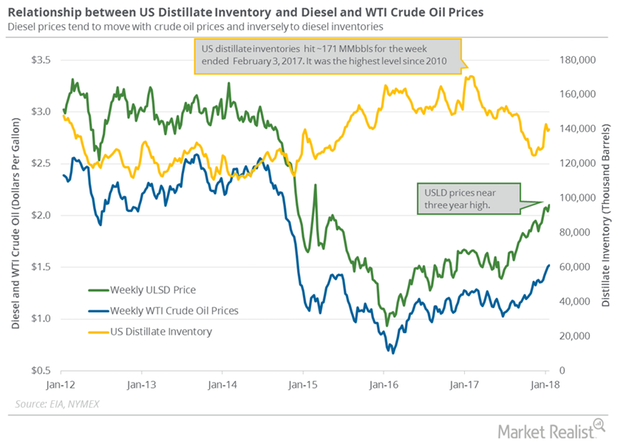
US Distillate Inventories Rose for the Eighth Time in 10 Weeks
US distillate inventories rose by 0.64 MMbbls (million barrels) to 139.8 MMbbls on January 12–19, 2018, according to the EIA.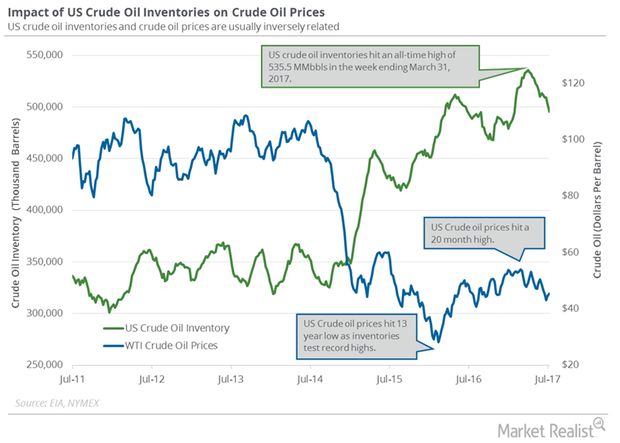
Supply, Demand: Will Crude Oil Futures Rally Be Short-Lived?
August WTI (West Texas Intermediate) crude oil futures contracts rose 1.0% and closed at $45.49 per barrel on Wednesday, July 12, 2017.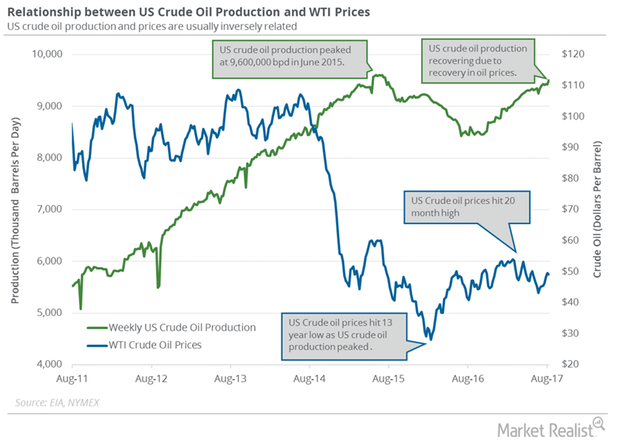
Why Is US Crude Oil Production at a 2-Year High?
The EIA (U.S. Energy Information Administration) estimates that US crude oil production rose by 79,000 bpd or 0.83% to 9,502,000 bpd on August 4–11, 2017.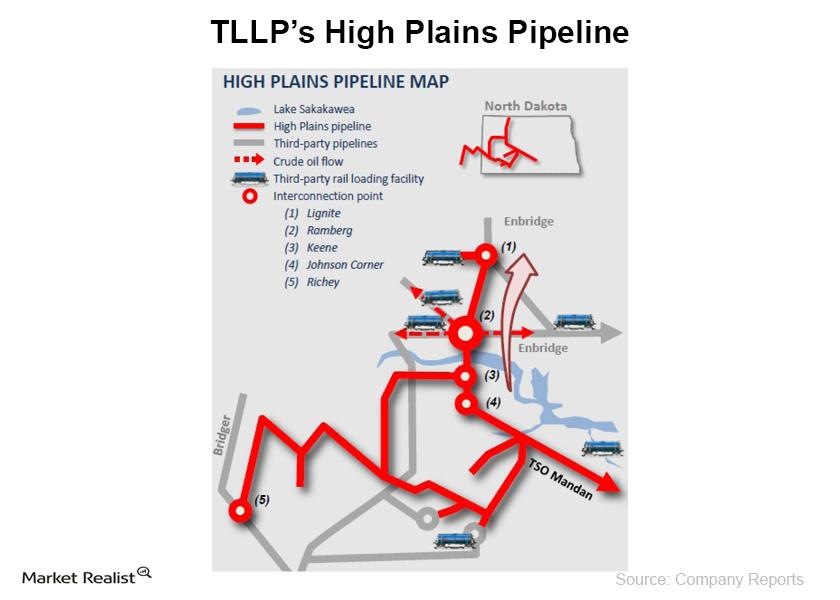
Why Tesoro’s crude oil gathering and pipeline segment is positive
Tesoro Logistics’ (TLLP) operations are organized into the Crude Oil Gathering segment and the Terminalling and Transportation segment.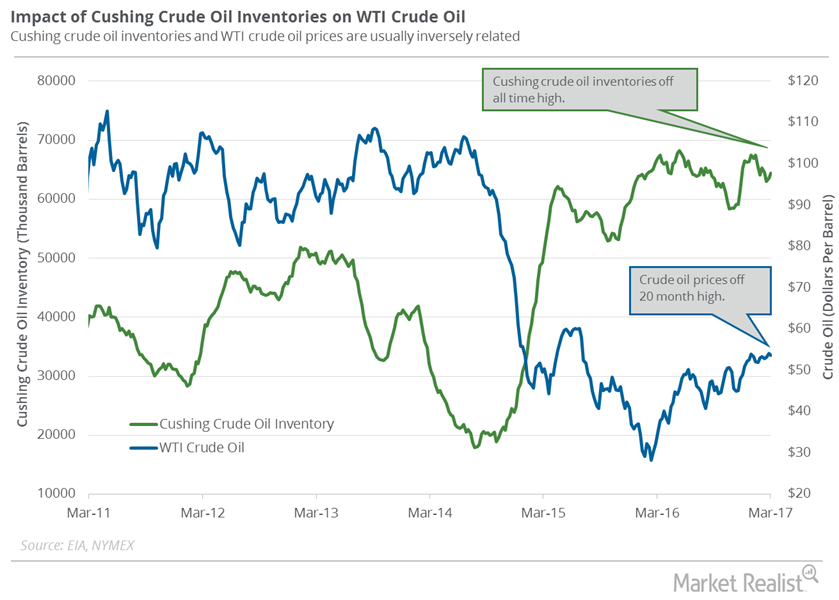
Cushing Crude Oil Inventories: More Pain for Oil Prices?
Market surveys estimate that Cushing crude oil inventories rose from March 3–10. A rise in crude oil inventories could pressure US crude oil prices.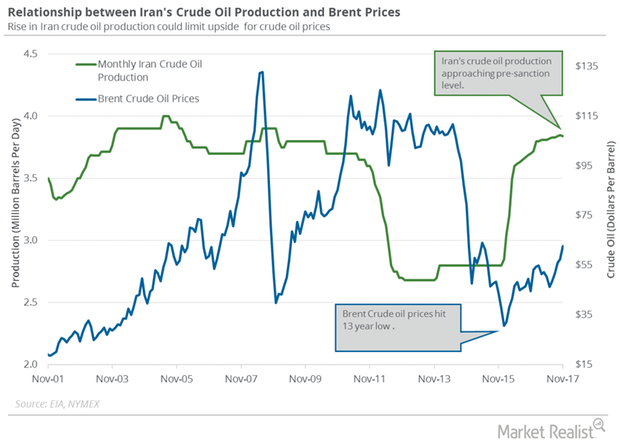
Will Crude Oil Futures and S&P 500 Move in the Same Direction?
February US crude oil (UWT) (USL) futures contracts rose 0.5% to $61.73 per barrel on January 8. Prices are near the highest level since December 2014.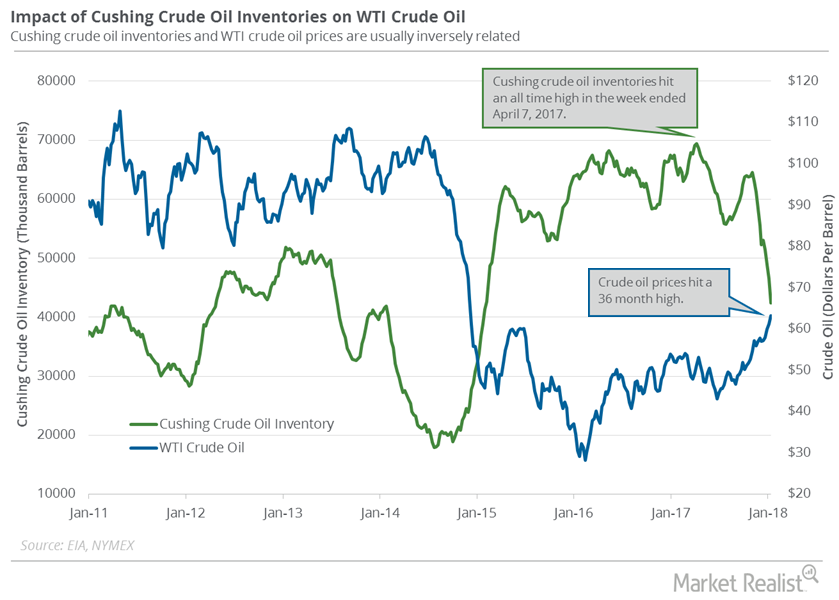
Cushing Inventories Hit January 2015 Low
A Bloomberg survey estimates that the crude oil inventories at Cushing could have declined by 2.3 MMbbls (million barrels) on January 12–19, 2018.
Crude Oil and Product Inventories Impact Crude Oil Futures
US crude oil futures have risen 6% from the ten-month low on June 21, 2017. Futures have also risen 2% in the last month.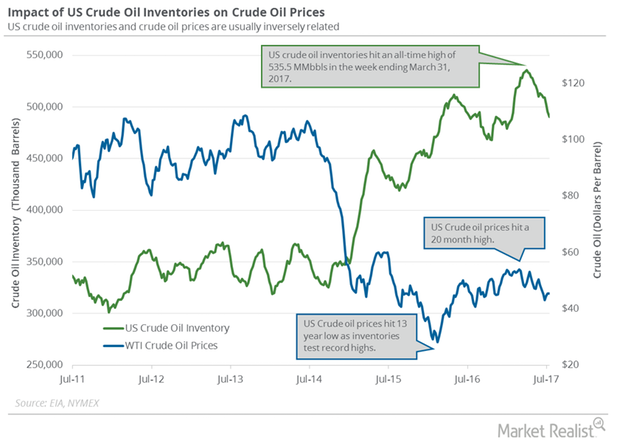
US Crude Oil Imports from Saudi Arabia Hit a 7-Year Low
US crude oil imports have fallen 4.5% YTD. US crude oil imports from Saudi Arabia are at a seven-year low at 524,000 bpd for the week ending July 14, 2017.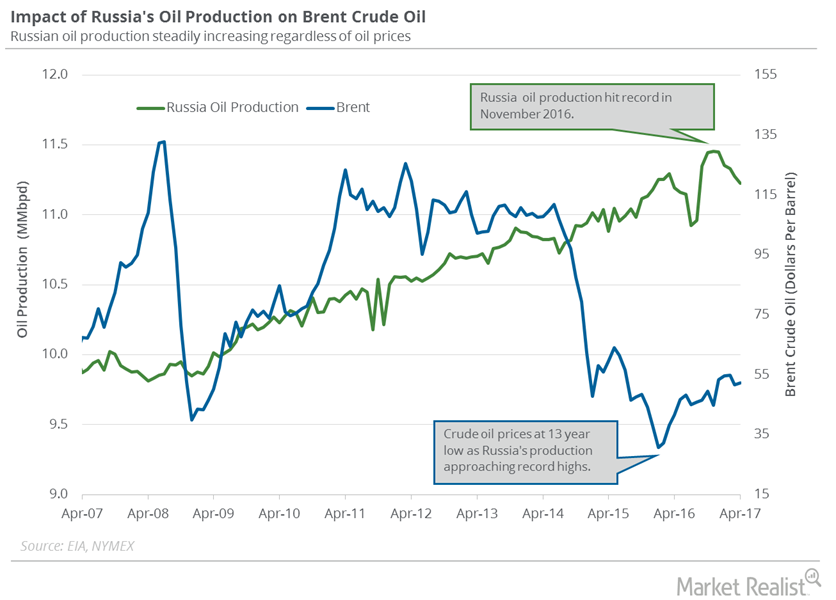
Russia Could Leave OPEC’s Production Cut Deal
Rosneft is Russia’s largest oil producer. On June 1, a Rosneft board member stated that Russia wouldn’t extend the production cut deal beyond March 2018.
FOMC Meeting Could Surprise Crude Oil Traders
US crude oil (UCO) (USL) futures contracts for January delivery rose 0.7% and were trading at $58.4 per barrel at 1:02 AM EST on December 12, 2017.Energy & Utilities Why the triple top and triple bottom patterns are important
The triple top pattern is formed in the uptrend. In this pattern, three consecutive peaks are formed. The peaks have roughly the same price level.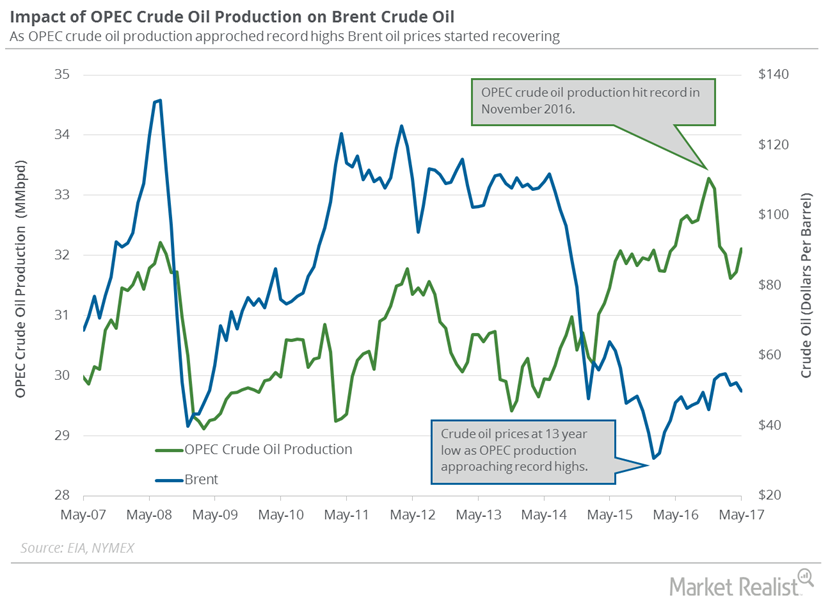
OPEC’s Monthly Report Could Pressure Oil Prices
OPEC will release its Monthly Oil Market Report on July 12, 2017. OPEC’s crude oil production rose in June 2017.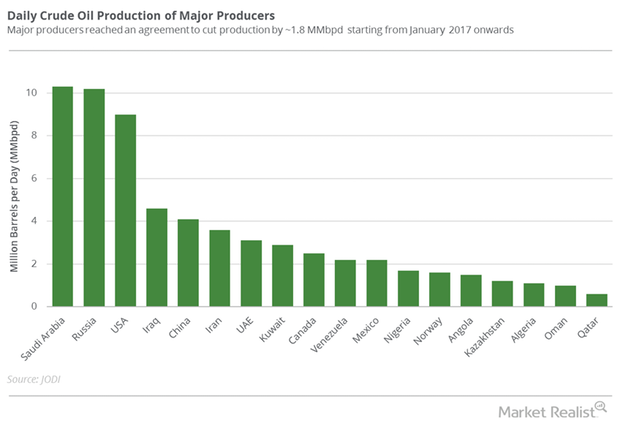
Will the OPEC and Non-OPEC Meeting Drive Crude Oil Futures?
September WTI (West Texas Intermediate) crude oil (RYE) (VDE) (UCO) futures contracts rose 1.1% to $49.58 per barrel on August 4, 2017.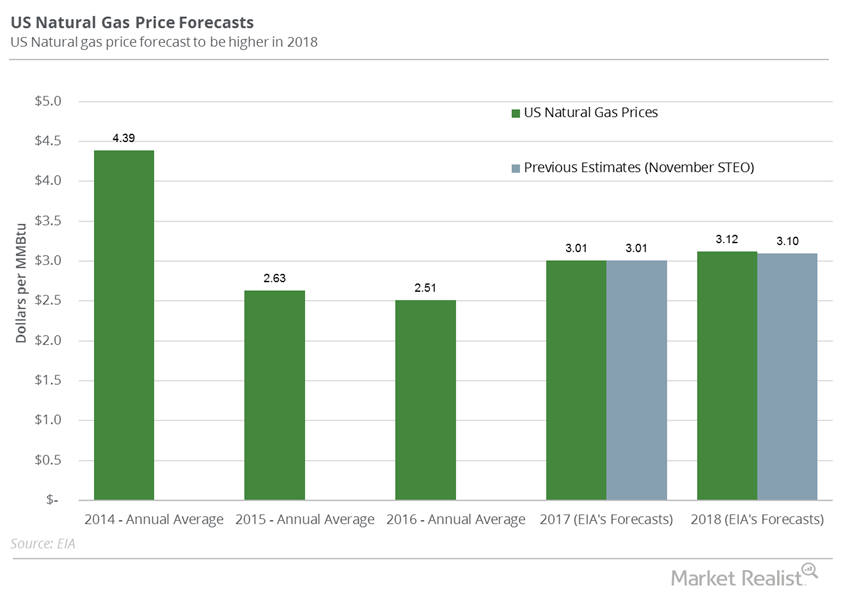
Will US Natural Gas Futures Fall More?
US natural gas (GASL) futures contracts for January delivery were below their 20-day, 50-day, and 100-day moving averages on December 14, 2017.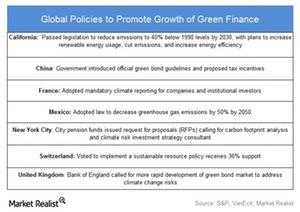
The Economic Costs That Come with Climate Goals
Climate-related policies and a transition to a low-carbon economy require capital, and most countries are already burdened with high debt.
US Distillate Inventories Fell for the Third Time in 10 Weeks
US distillate inventories fell by 3.8 MMbbls or 2.7% to 139.2 MMbbls on January 5–12, 2018. The inventories fell by 29.9 MMbbls or 18% from a year ago.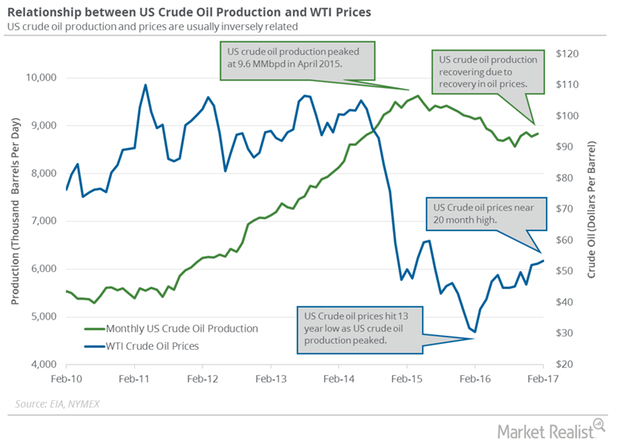
Monthly US Crude Oil Production Hit May 2016 High
The EIA reported that monthly US crude oil production rose by 60,000 bpd (barrels per day) to 8.8 MMbpd in January 2017—compared to the previous month.
Will OPEC and Russia Announce Deeper Production Cuts?
The OPEC and non-OPEC monitoring committee meeting will be held on July 24, 2017, in Russia. The meeting will discuss production cut deal compliance.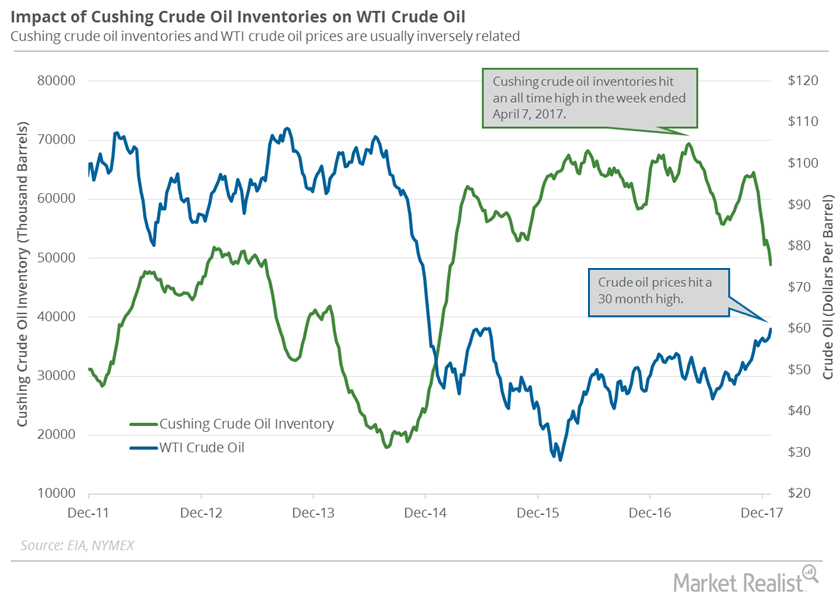
Cushing Inventories Hit February 2015 Low
A Bloomberg survey estimated that the crude oil inventories at Cushing could have fallen by 1.5 MMbbls between December 29, 2017, and January 5, 2018.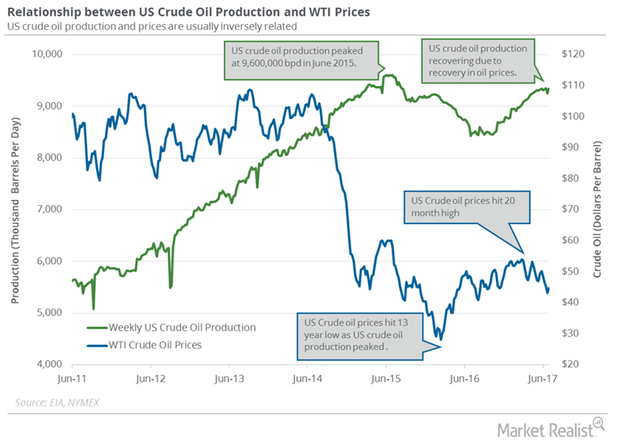
OPEC, Russia, and the US Could Pressure Crude Oil Futures
US crude oil (RYE) (VDE) (SCO) futures contracts for August delivery fell 2.8% and settled at $44.23 per barrel on July 7. Prices are near a ten-month low.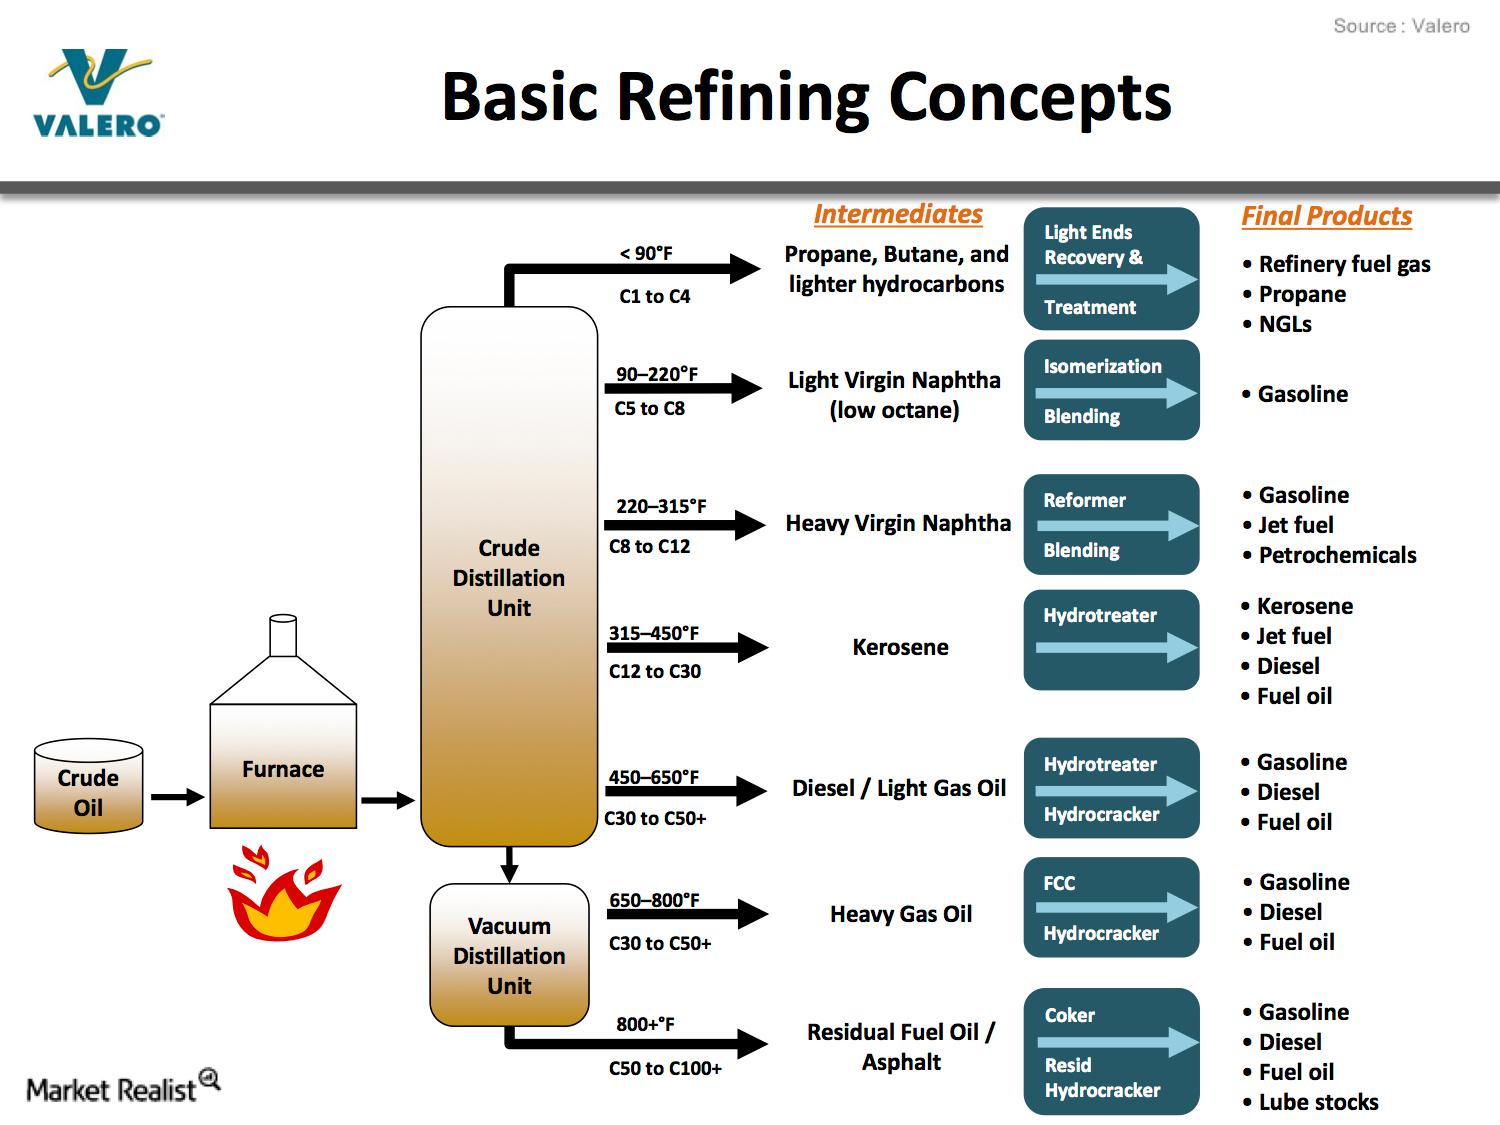
What Is Crude Oil Refining and How Does It Work?
This series will provide you a complete overview of the refining industry as well as a quick snapshot of downstream sector stocks in the US.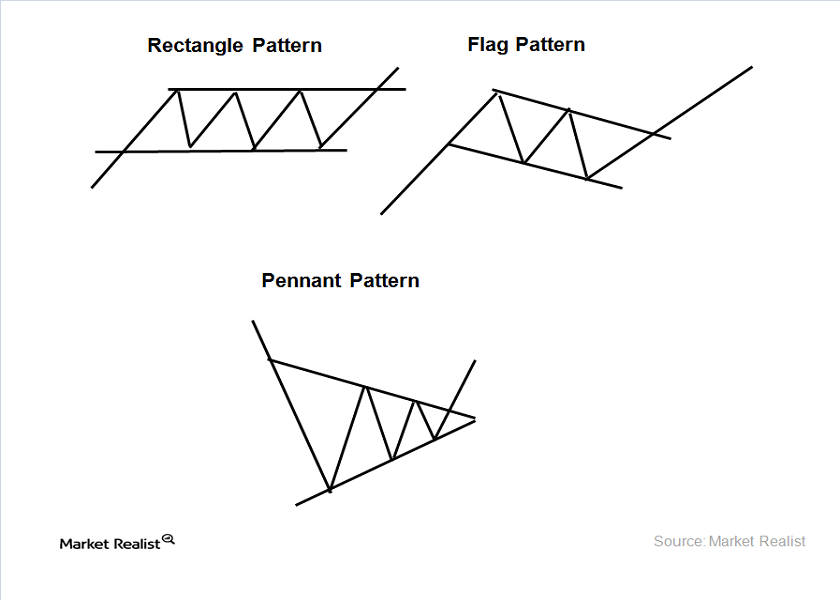
Technical analysis—the rectangle, flag, and pennant patterns
In the rectangle pattern, it’s advisable to buy stock at support and sell at resistance. This pattern is formed in the uptrend and downtrend.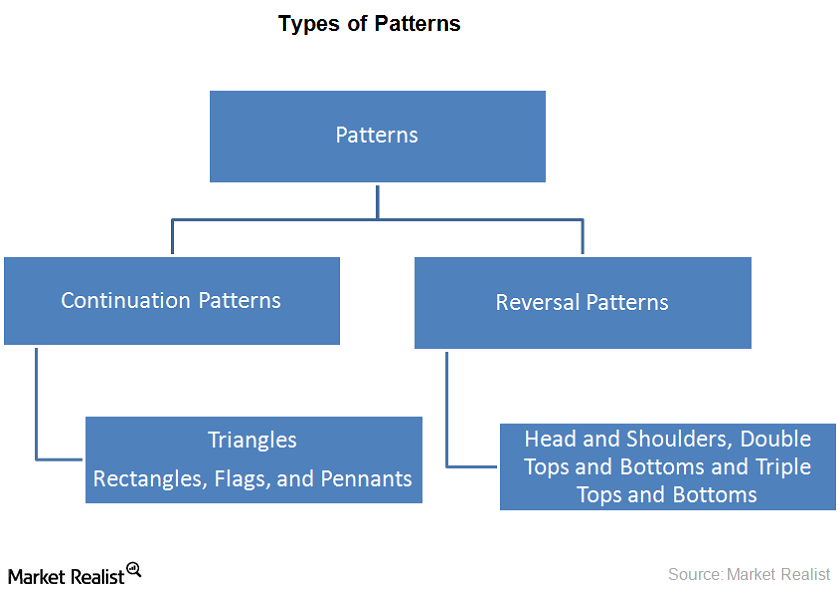
Why technical analysis uses price patterns
Price patterns are trends that occur in stock charts. The charts are used in technical analysis. The pattern forms recognizable shapes. Price patterns are used to forecast the prices.
Must-know: An overview of Chevron Corporation
CVX is headquartered in San Ramon, California. It’s an energy company that engages in oil and gas exploration, production, refining, marketing, and transportation of oil and gas.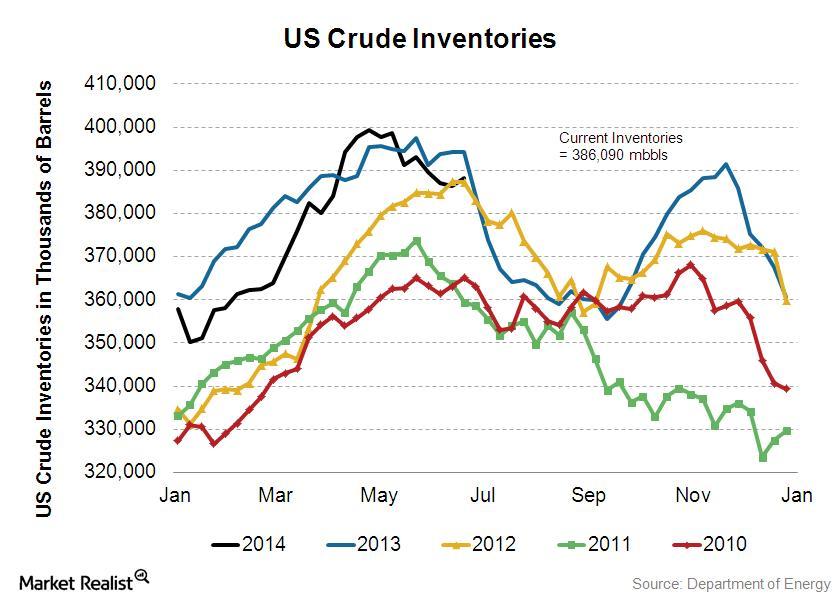
Must-know: Why crude oil inventories can affect prices
Every week, the U.S. Energy Information Administration (or EIA) reports figures on crude inventories, or the amount of crude oil stored in facilities across the United States.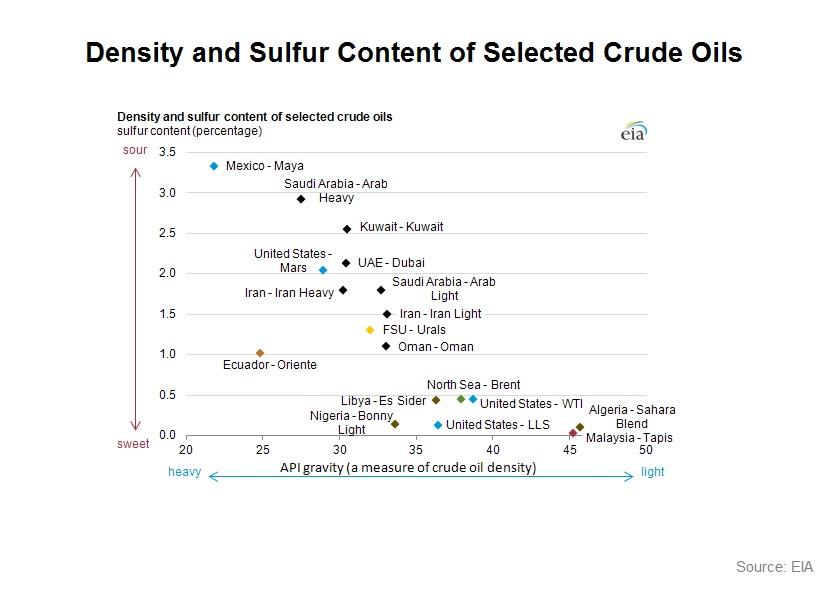
All oil is not created equal – why differences in crude matter (part II)
Differences in crude’s density, sulfur content, and production location can vastly affect the price which it commands on the market.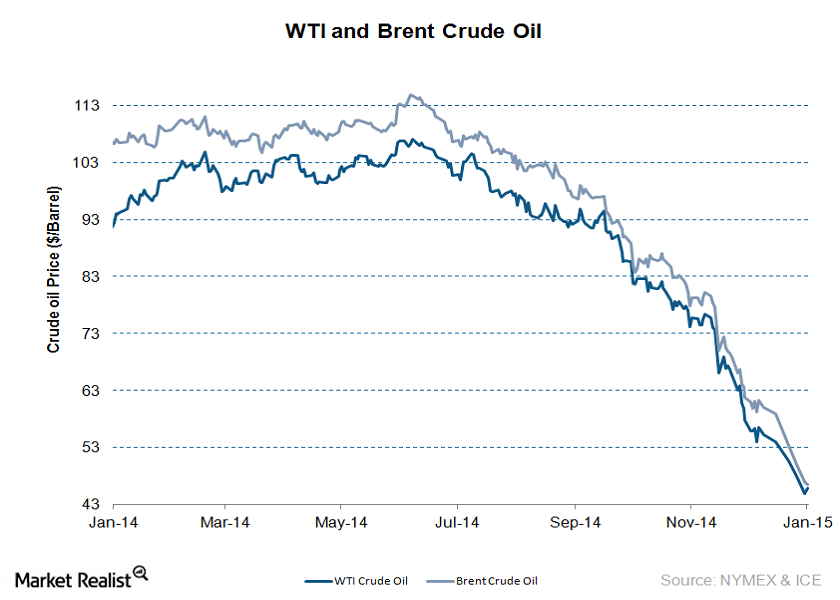
The crude oil market: An overview
Crude oil prices have been on a roller coaster ride in 2014. This series will help crude oil investors recognize key factors that are impacting oil prices.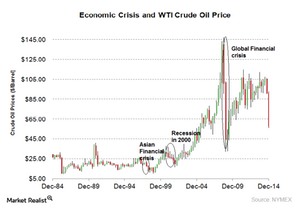
How an economic crisis affects the price of crude oil
The common factor during an economic crisis is that economic growth slows down. Demand declines, which has a negative impact on oil prices.Energy & Utilities Southwestern is among the largest US oil and natural gas producers
Headquartered in Houston, Texas, Southwestern Energy Corporation (SWN) is one of the largest independent natural gas and oil producers in the United States.
Will US Oil Production Pressure Crude Oil Futures?
February WTI crude oil futures contracts fell 0.9% to $63.73 per barrel on January 16. Brent oil futures fell 1.6% to $69.15 per barrel on the same day.
US Natural Gas Futures Could Continue to Fall
Hedge funds’ net long positions in US natural gas futures (UGAZ) (UNG) and options contracts were at 5,318 for the week ending January 2, 2018.