Vanguard Energy ETF
Latest Vanguard Energy ETF News and Updates
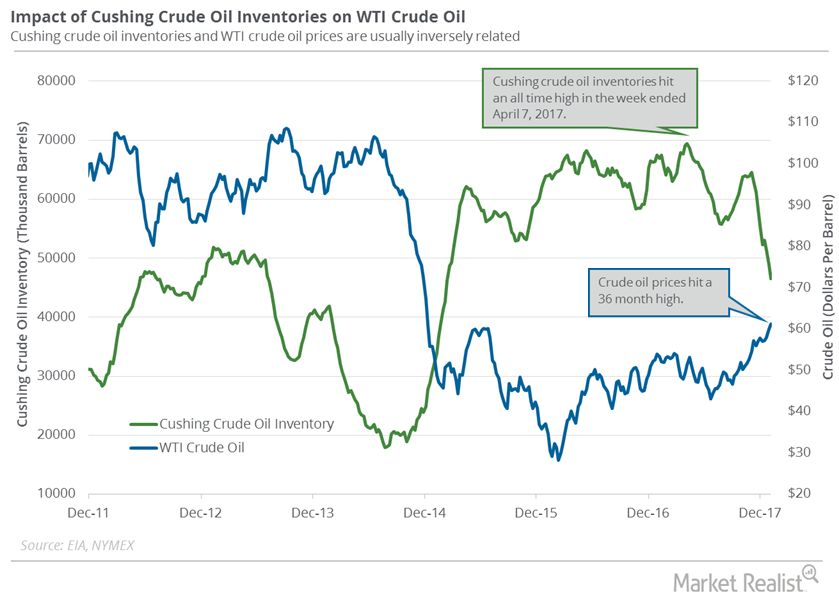
Cushing Inventories Fell 33% from the Peak
Analysts expect that Cushing crude oil inventories could have declined on January 5–12, 2018. A fall in Cushing inventories is bullish for oil prices.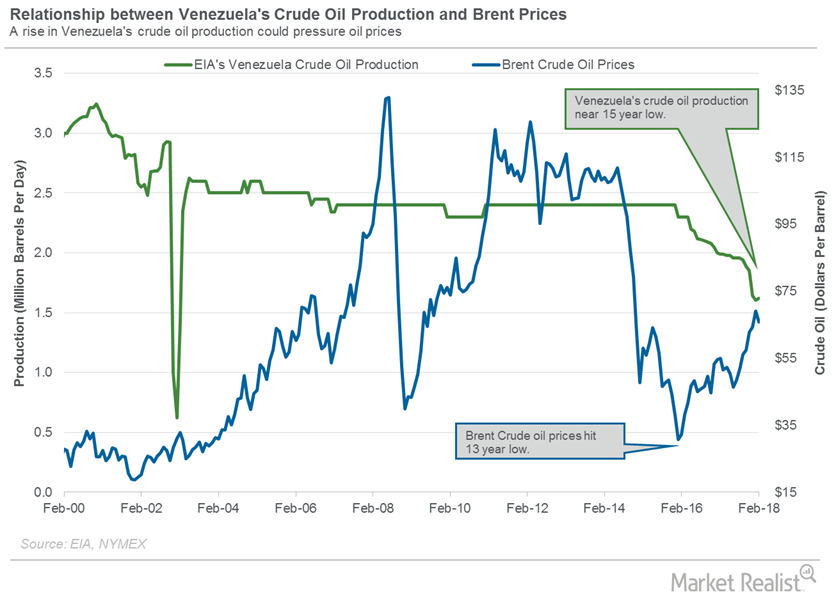
Crude Oil Traders Track Venezuela’s Oil Production
The EIA estimates that Venezuela’s crude oil production increased by 15,000 bpd to 1,620,000 bpd in February 2018—compared to January 2018.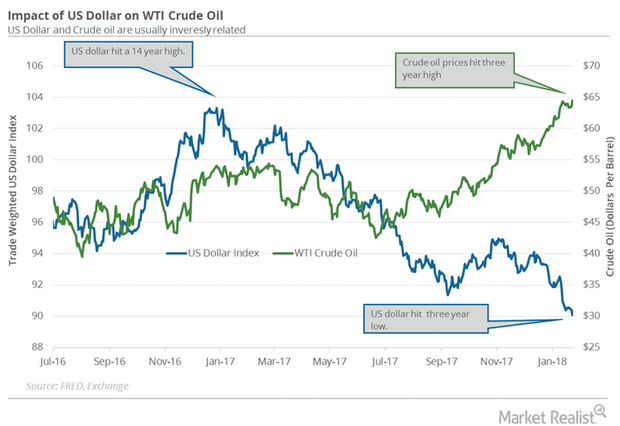
US Dollar Hit a 3-Year Low: Is It Bullish for Crude Oil?
The US Dollar Index (UUP) fell 0.34% to 90.09 on January 23—the lowest level since December 2014. The fall supported crude oil prices on January 23, 2018.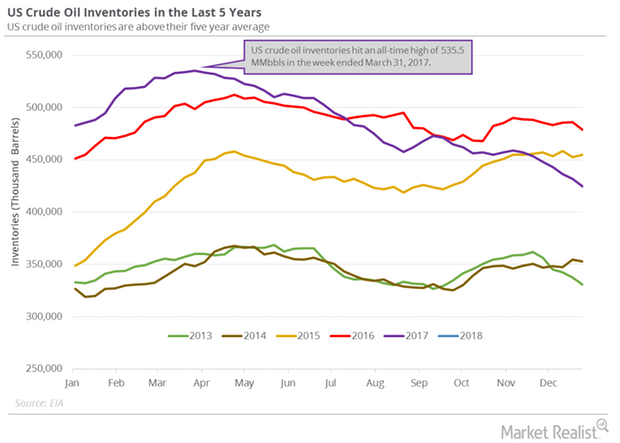
Massive Fall in Crude Oil Inventories Pushed Oil Prices Higher
US crude oil inventories fell by 4.9 MMbbls (million barrels) to 419.5 MMbbls between December 29, 2017, and January 5, 2018.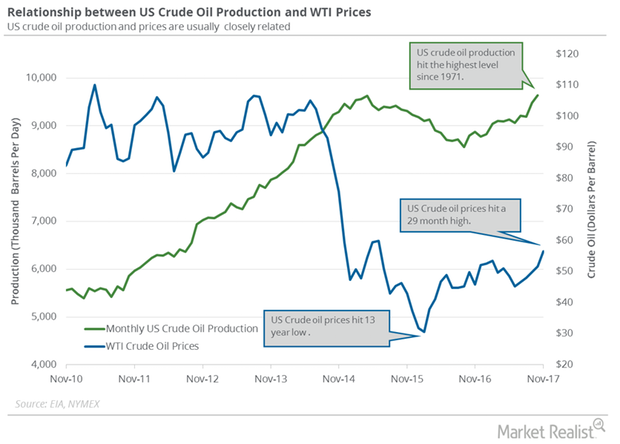
US Crude Oil Output Hit the Highest Level since May 1971
US crude output increased by 167,000 bpd to 9.64 MMbpd in October 2017—compared to the previous month. It was the highest level since May 1971.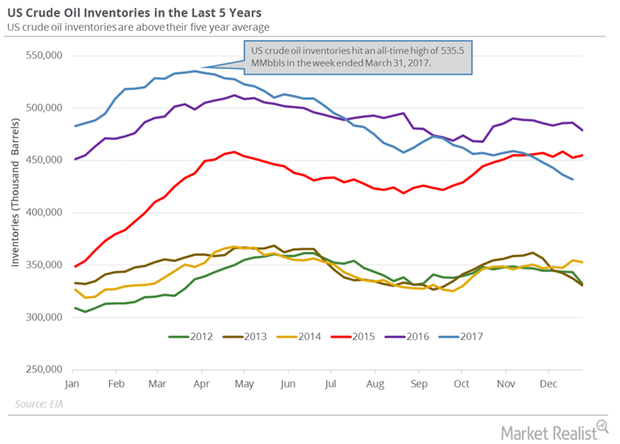
US Crude Oil Inventories Have Fallen ~10.6% in 2017
February WTI crude oil futures (DWT)(SCO) contracts rose 0.8% to $60.3 per barrel at 12:45 AM EST on December 29, 2017—the highest level since June 2015.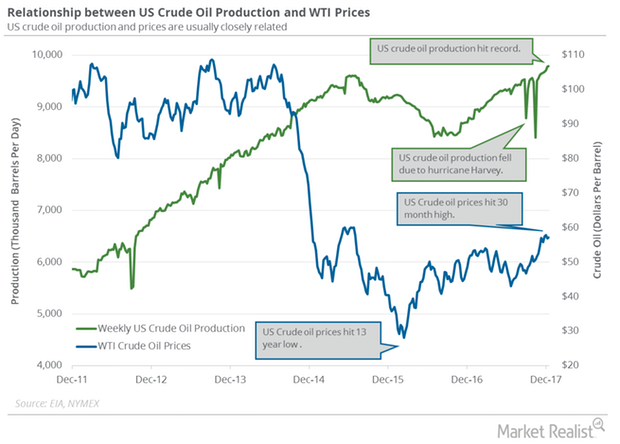
Crude Oil Prices: Which Factor Could Change the Trend?
The EIA estimated that US crude oil production rose by 9,000 bpd (barrels per day) to 9,789,000 bpd on December 8–15, 2017.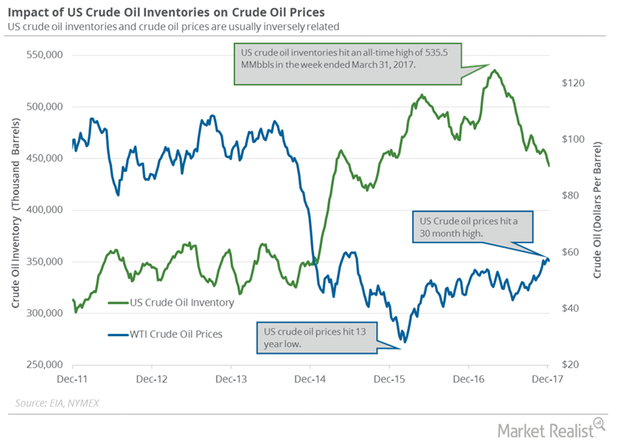
Will US Crude Oil Inventories Push Crude Oil Prices Higher?
US crude oil inventories fell 17.3% from their peak. So far, they have fallen 8.3% in 2017. Similarly, oil (DWT) (UCO) prices have risen ~9% in 2017.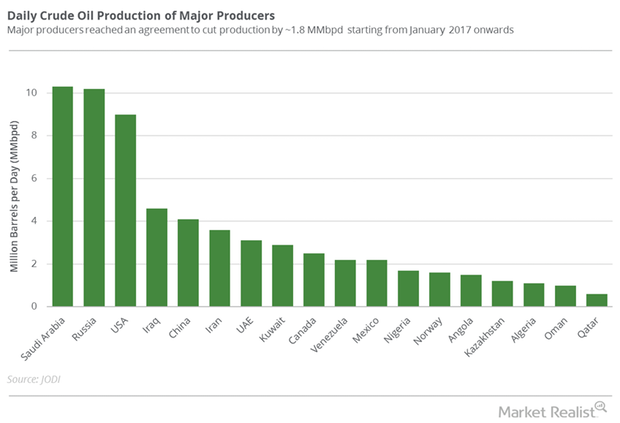
Will OPEC’s Meeting Help Crude Oil Bulls or Bears?
OPEC’s meeting will be held on November 30, 2017. Reuters said that OPEC might extend the production cuts for nine more months.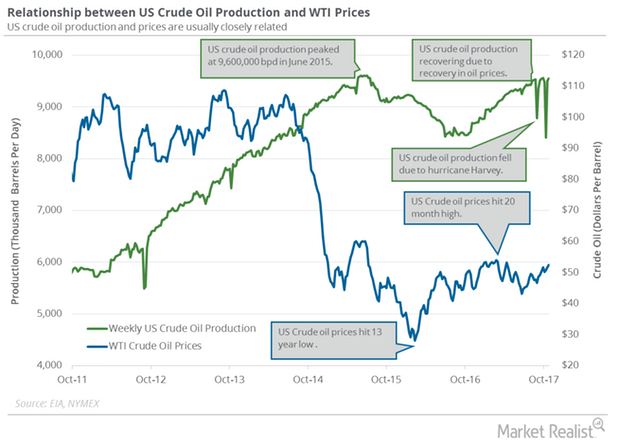
Will Non-OPEC and US Crude Oil Production Impact Oil Prices?
The EIA (U.S. Energy Information Administration) estimates that US crude oil production rose by 46,000 bpd to 9,553,000 bpd on October 20–27, 2017.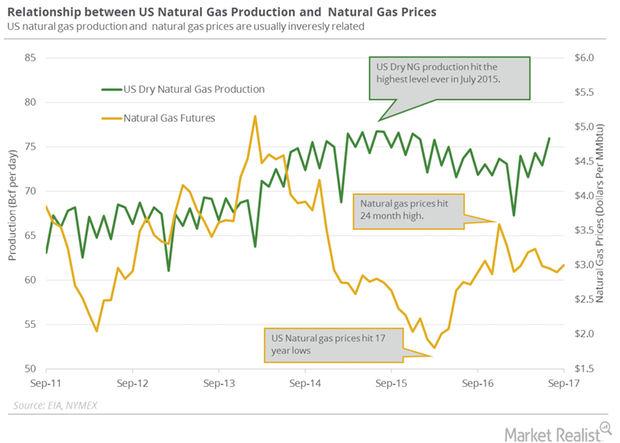
Is US Natural Gas Production Bearish for Natural Gas?
US dry natural gas production will likely average ~73.6 Bcf/d in 2017. It will likely rise by 4.9 Bcf/d or 6.6% to 78.5 Bcf/d in 2018.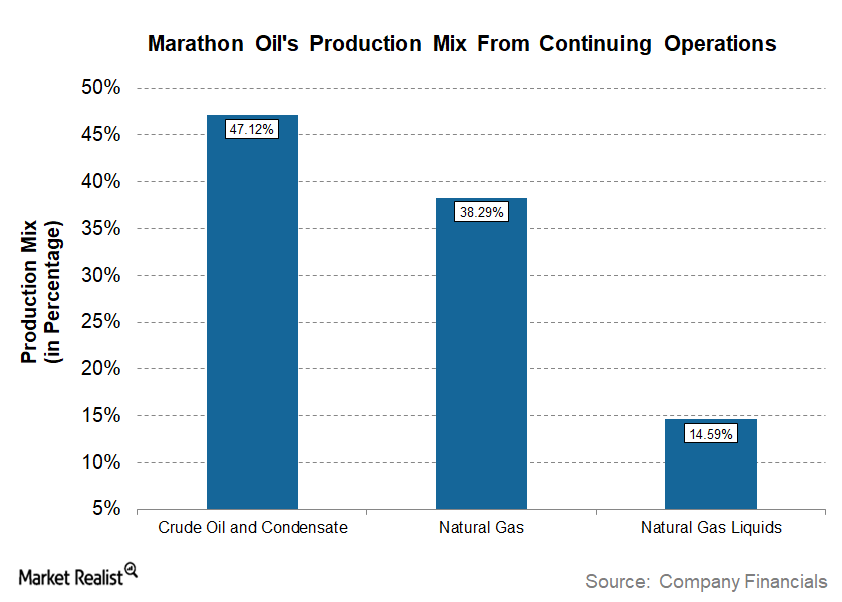
How Marathon Oil’s Divestiture Affected Its Production Mix
In 2Q17, Marathon Oil’s (MRO) production mix from continuing operations was ~47.0% crude oil and condensate, ~15.0% natural gas liquids, and ~38.0% natural gas.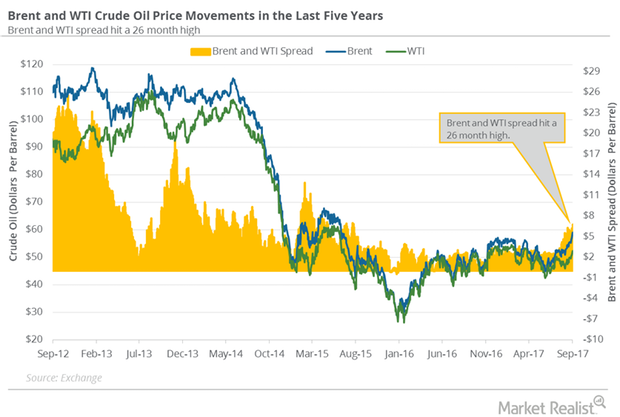
Why the Brent and WTI Crude Oil Spread Hit a 26-Month High
November WTI (West Texas Intermediate) crude oil (UWT)(DWT)(DBO) futures contracts fell 0.2% and were trading at $52.12 per barrel in electronic trading at 2:20 AM EST on September 26.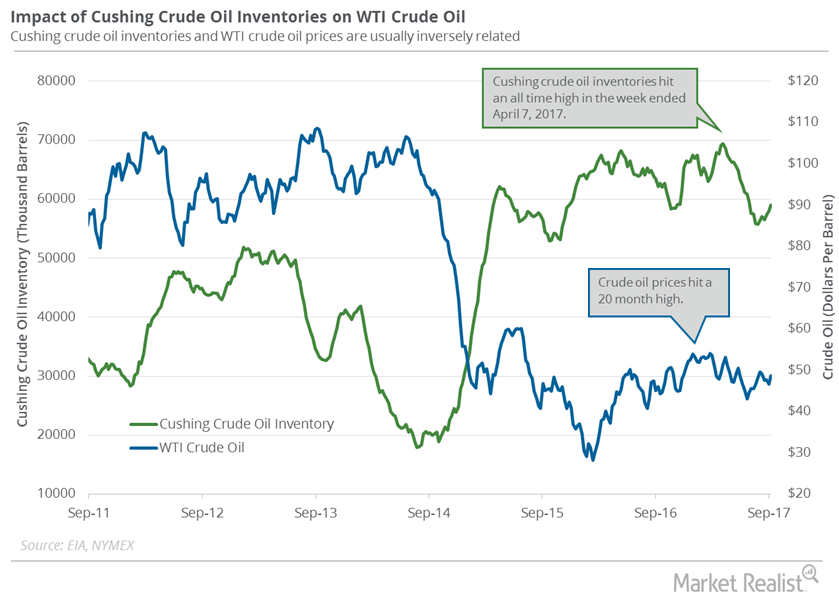
Cushing Inventories: Bullish or Bearish for Crude Oil Prices?
A market survey estimates that Cushing crude oil inventories has risen between September 8 and September 15.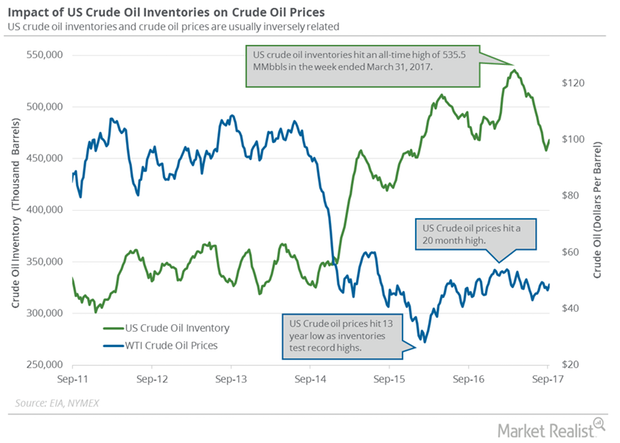
Are US Crude Oil Supply and Demand Tightening?
WTI (West Texas Intermediate) crude oil (XLE)(XOP)(USO) futures contracts for October delivery rose 2.2% to $49.3 per barrel on September 13.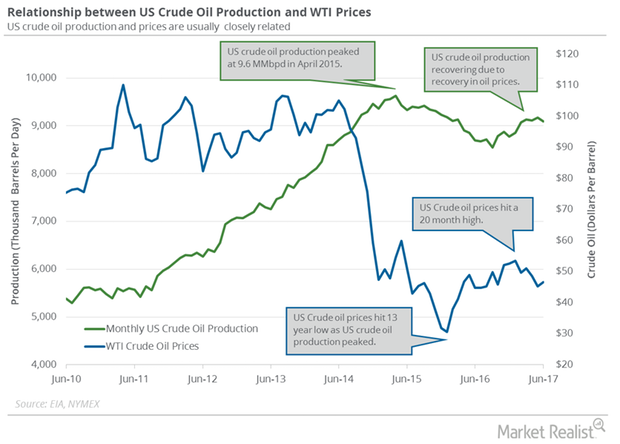
US Crude Oil Production Hit a 5-Month Low
US crude oil production hit a five-month low due to slowing crude oil rigs and lower crude oil (XLE) (USO) (UCO) prices in the past few months.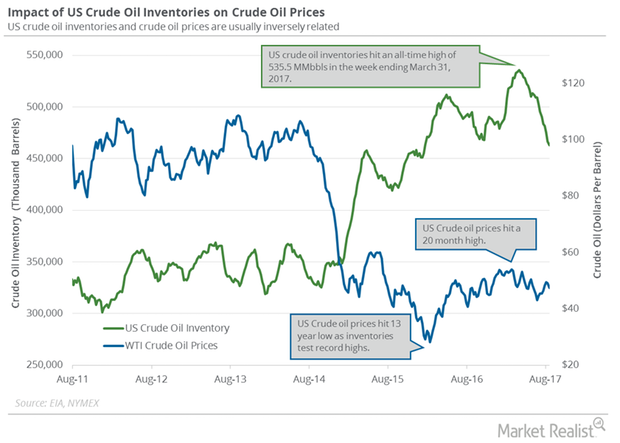
Harvey and API Crude Oil Inventories: The Impact on Crude Futures
US crude oil futures contracts for October delivery fell 0.3% to $46.44 per barrel on August 29, 2017.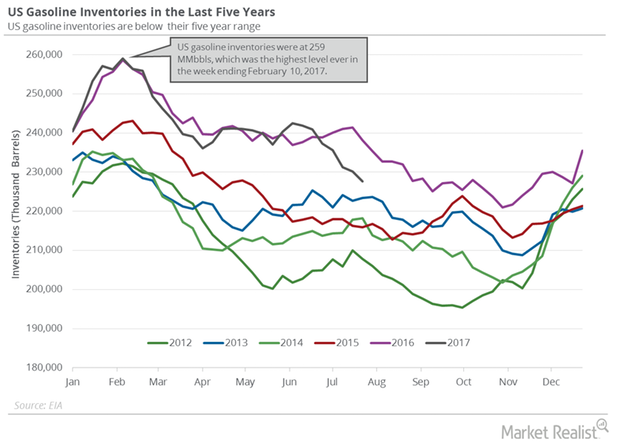
US Gasoline Inventories Limit the Upside for Crude Oil Futures
US gasoline inventories rose by 3.4 MMbbls to 231.1 MMbbls on July 28–August 4, 2017. Inventories rose for the third time in the last ten weeks.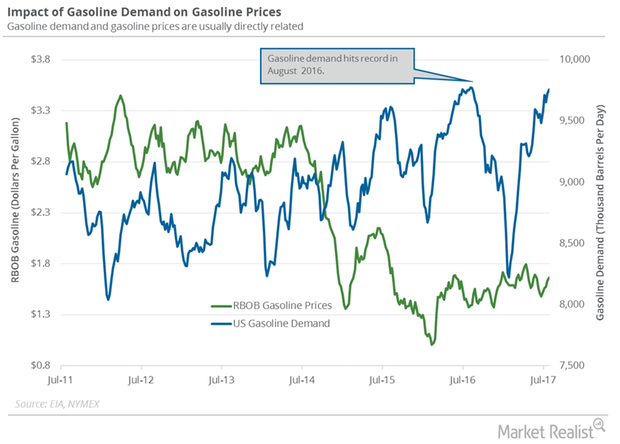
US Gasoline Demand Hit a Record: What’s Next?
The EIA estimates that weekly US gasoline demand rose by 21,000 bpd (barrels per day) to 9,842,000 bpd on July 21–28, 2017. It’s the highest level ever.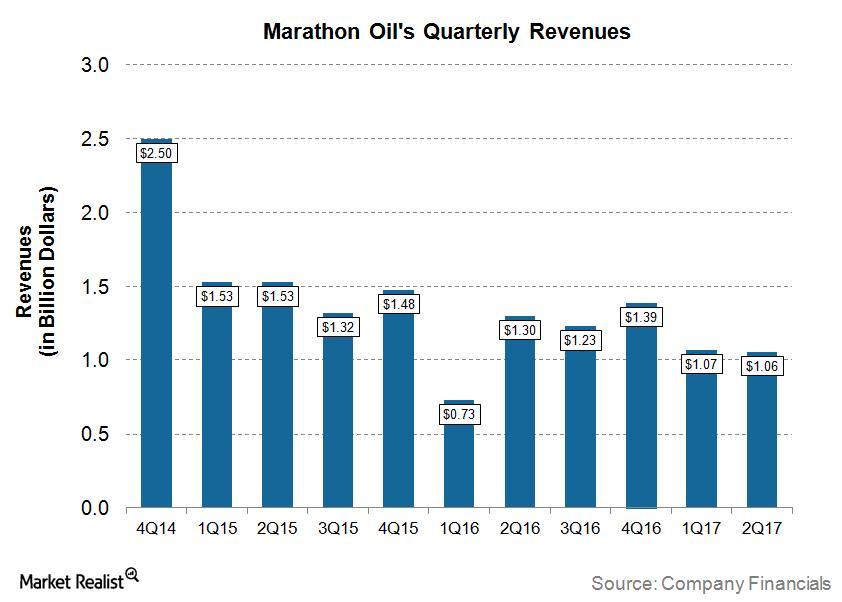
Analyzing Marathon Oil’s 2Q17 Revenues
For 2Q17, Marathon Oil (MRO) reported revenues of ~$1.06 billion, which was higher than Wall Street analysts’ consensus for revenues of ~$1.02 billion.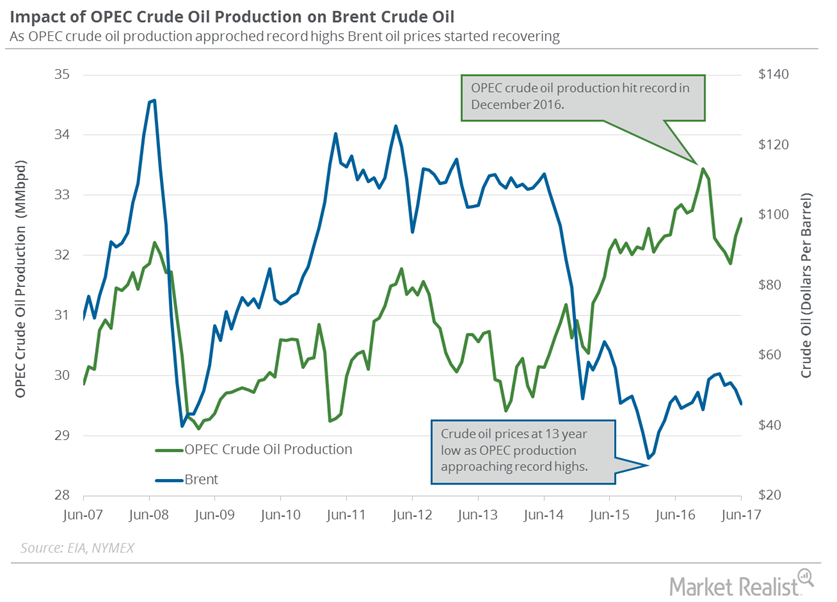
Problems for Crude Oil Bulls as OPEC Production Hits 2017 High
September US crude oil futures contracts rose 0.20% and were trading at $50.29 per barrel in electronic trading at 1:35 AM EST on August 1, 2017.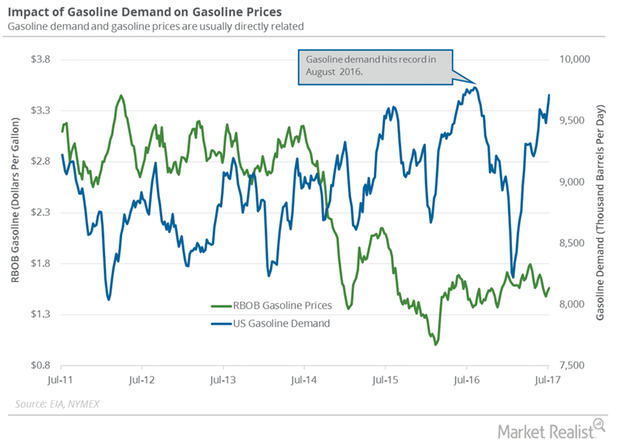
Near Record US Gasoline Demand: Are the Bulls Taking Control?
The EIA estimates that the four-week average for US gasoline demand rose 129,000 bpd (barrels per day) to 9.7 MMbpd (million barrels per day) from July 7 to 14, 2017.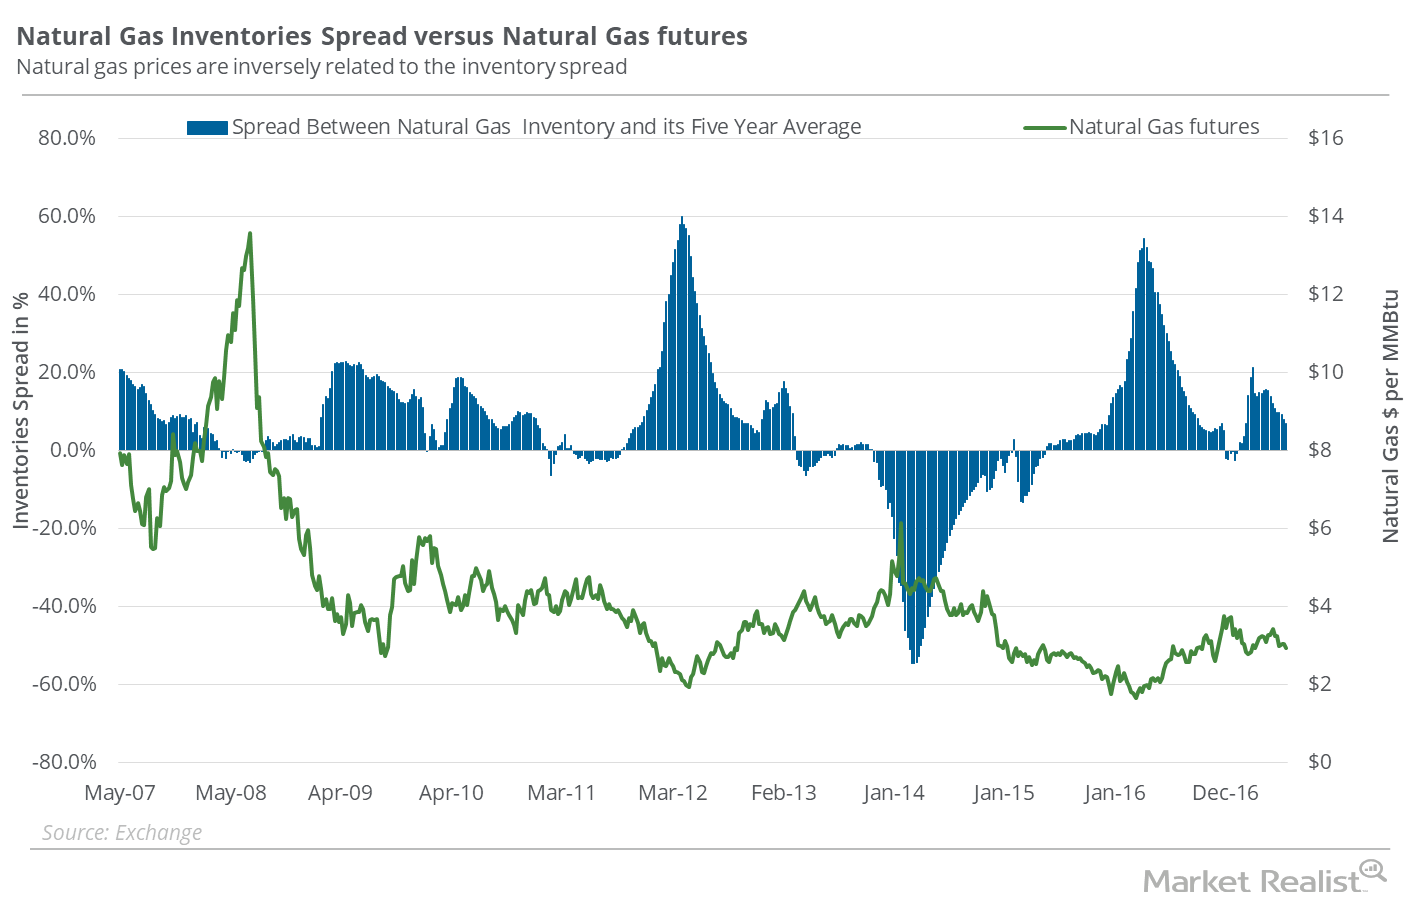
Can the Natural Gas Inventories Spread Rescue Natural Gas Bulls?
In the week ended June 23, 2017, natural gas inventories were at 2,816 Bcf (billion cubic feet)—46 Bcf more compared to the week earlier.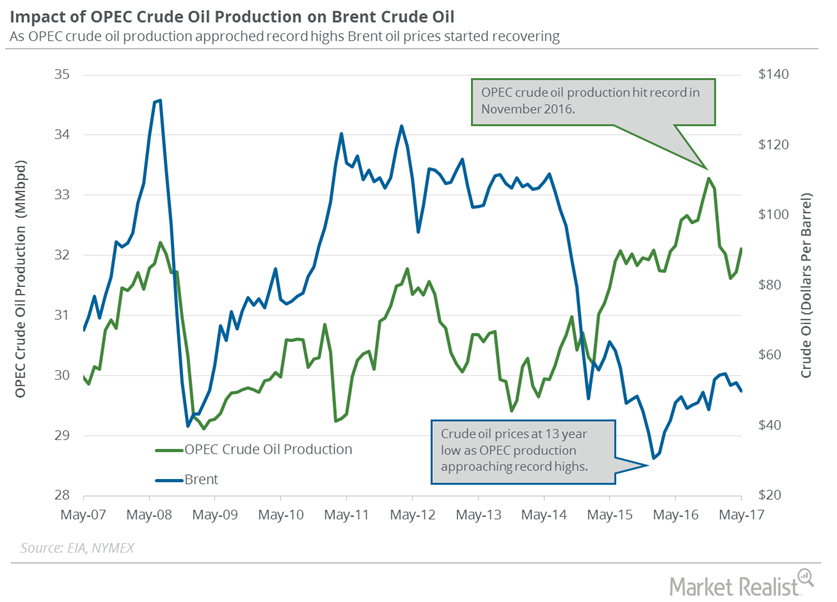
OPEC’s Crude Oil Production Hit a 2017 High
OPEC’s production cut compliance was at 92% in June 2017. Lower compliance from OPEC members and Russia could pressure crude oil prices.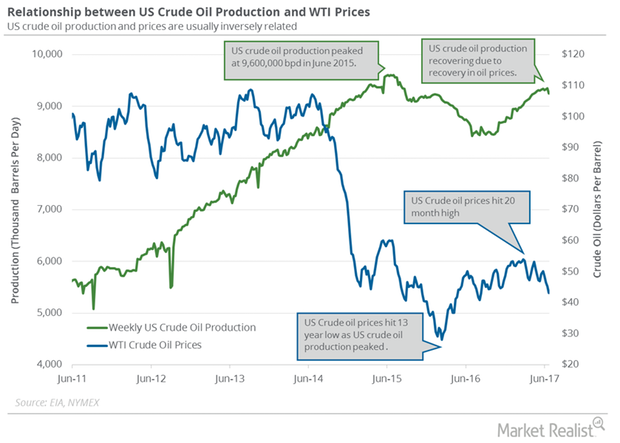
Will Libya and Iran Swing Crude Oil Prices?
Market surveys project that Libya’s crude oil production is near 1 MMbpd—the highest level in three years. High production could pressure crude oil prices.
Why the Natural Gas Inventory Spread Supports Its Recent Recovery
In the week ended June 16, 2017, natural gas inventories rose 61 Bcf (billion cubic feet) to 2,770 Bcf based on EIA data released on June 22, 2017.
US Crude Oil Prices Could Be Range Bound Next Week
August WTI (West Texas Intermediate) crude oil (XOP) (VDE) (RYE) futures contracts rose 0.5% and closed at $42.74 per barrel on June 22, 2017.
Natural Gas Inventories Spread: Savior for Natural Gas Bulls?
The EIA reported that natural gas inventories rose by 78 Bcf (billion cubic feet) to 2,709 Bcf in the week ending June 9, 2017.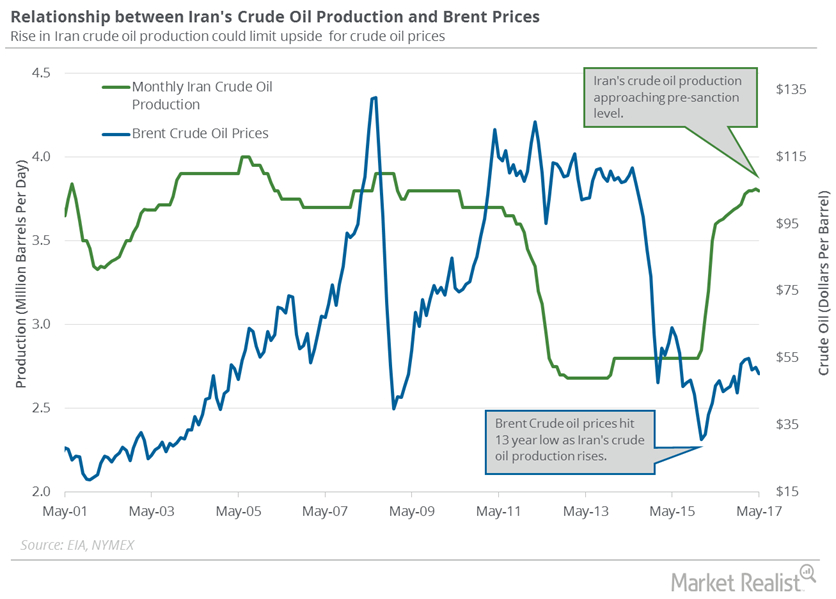
Analyzing Iran’s Crude Oil Production and Export Plans
Iran’s crude oil production is at a seven-year high. Iran was able to scale up production after the US lifted sanctions on the country in January 2016.
What’s in the Natural Gas Inventory Spread—Bears?
In the week ended June 2, 2017, natural gas inventories rose by 106 Bcf.
Chart in Focus: The Natural Gas Inventory Spread
Between January 27–June 7, 2017, natural gas active futures fell 10.9%. Natural gas inventories moved above their five-year average in the week ended January 27, 2017.
Why the Inventory Spread Could Make Natural Gas Bulls Happy
On a week-over-week basis, natural gas inventories rose by 75 Bcf (billion cubic feet) and were at 2,444 Bcf for the week ended May 19, 2017.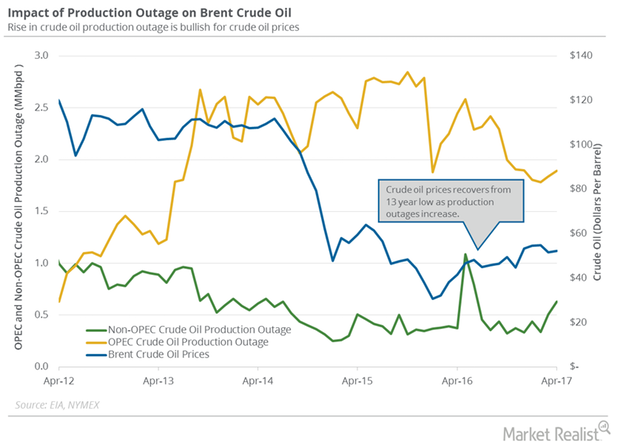
Global Crude Oil Supply Outages Could Help Crude Oil Bulls
The EIA estimated that global crude oil supply outages rose by 181,000 bpd (barrels per day) to 2.52 MMbpd in April 2017—compared to March 2017.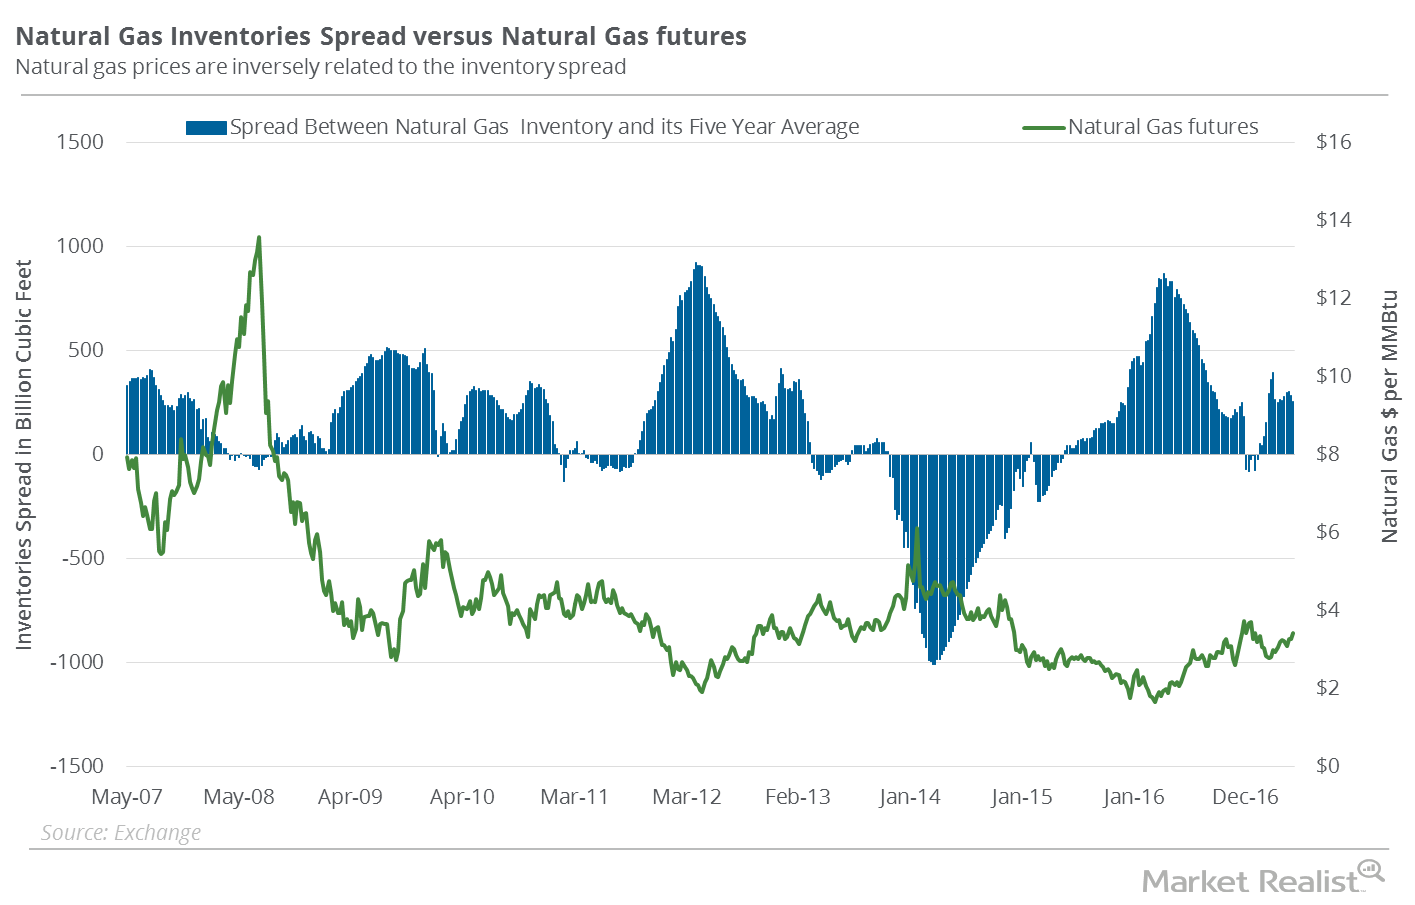
Natural Gas Inventory Spread Is Falling: Will Gas Prices Soar?
According to EIA data announced on May 18, there was an addition of 68 Bcf to natural gas (GASX) (FCG) (GASL) inventories for the week ending May 12, 2017.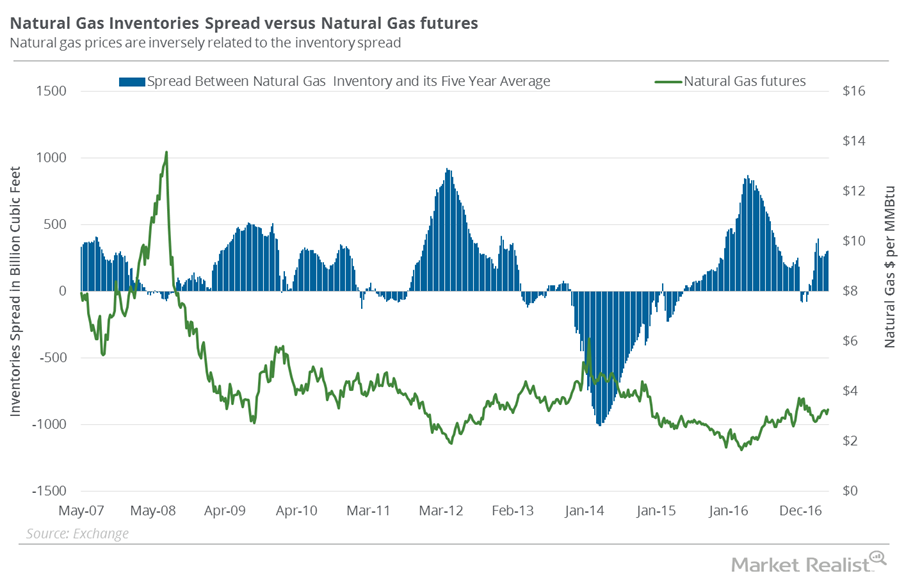
Is the Natural Gas Inventory Spread Optimistic?
According to data from the EIA on May 4, natural gas (GASX) (FCG) (GASL) inventories rose by 67 Bcf (billion cubic feet) during the week ending April 28.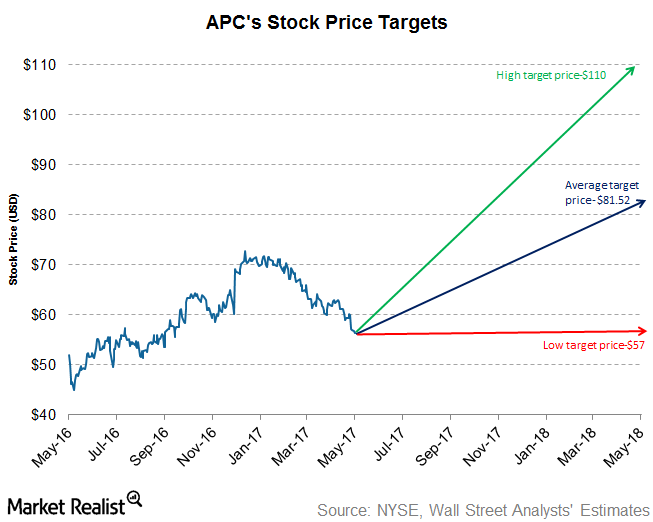
Analyst Recommendations for Anadarko Petroleum after 1Q17
Approximately 83.0% of analysts have rated Anadarko Petroleum (APC) a “buy.” The average broker target price is $81.52.
The Natural Gas Inventory Spread: Another Bearish Indicator?
According to data from the EIA released on April 27, 2017, natural gas inventories rose 74 Bcf (billion cubic feet) during the week ended April 21, 2017.
Natural Gas Inventories Spread: What Investors Should Know
According to data from the EIA released on April 20, 2017, natural gas (GASX) (FCG) (GASL) inventories rose by 54 Bcf during the week ending April 14, 2017.
Inventories Spread: Why Natural Gas Uptrend Could Be at Risk
According to data from the EIA (U.S. Energy Information Administration) released on March 30, 2017, natural gas inventories fell by 43 Bcf (billion cubic feet) during the week ending March 24, 2017.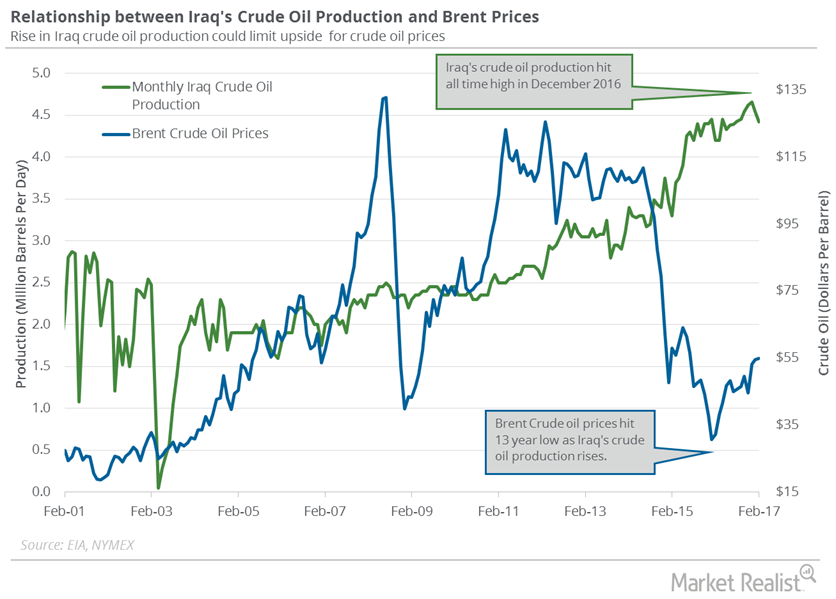
Iraq’s Crude Oil Production: More Pain for Crude Oil Bears
The EIA estimates that Iraq’s crude oil production fell by 115,000 bpd (barrels per day) to 4.42 MMbpd in February 2017—compared to the previous month.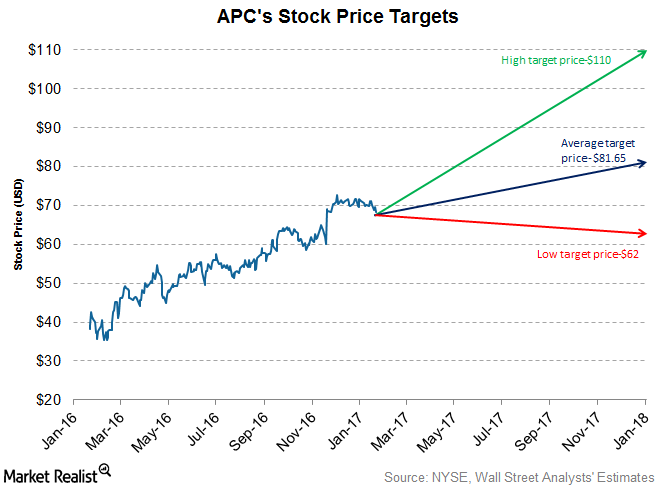
What Analysts Recommend for Anadarko after Its 4Q16 Earnings
The average broker target price of $81.65 for Anadarko Petroleum implies a potential return of ~19.4% for the stock in the next 12 months.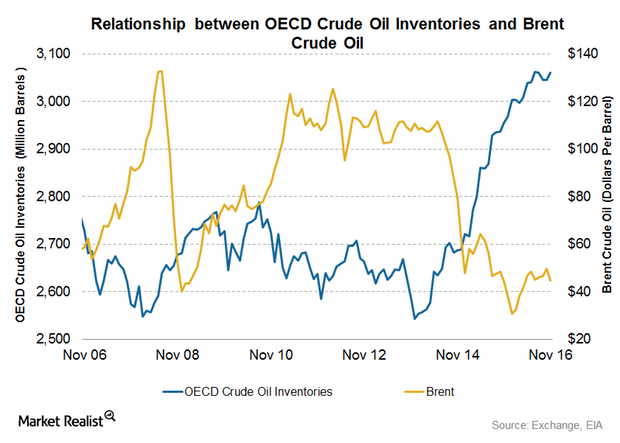
Will OECD Crude Oil Inventories Impact Crude Oil Prices in 2017?
The EIA estimates that OECD crude oil inventories rose by 15.9 MMbbls to 3,061 MMbbls in November 2016—compared to the previous month.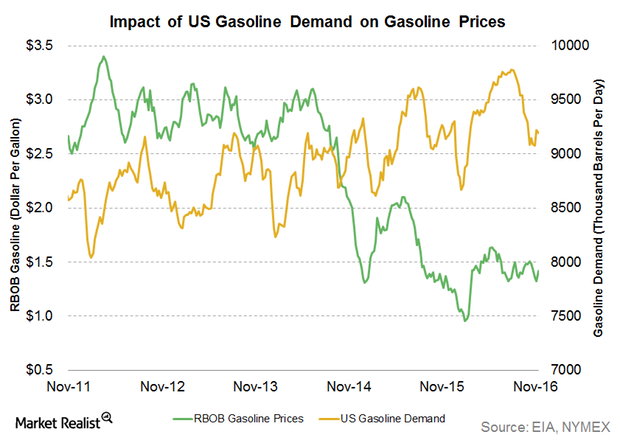
Gasoline Demand Impacts Crude Oil and Gasoline Prices
US gasoline prices hit $1.14 per gallon on February 8, 2016—the lowest in 12 years. As of November 29, 2016, prices rose 21.1% from their lows in February.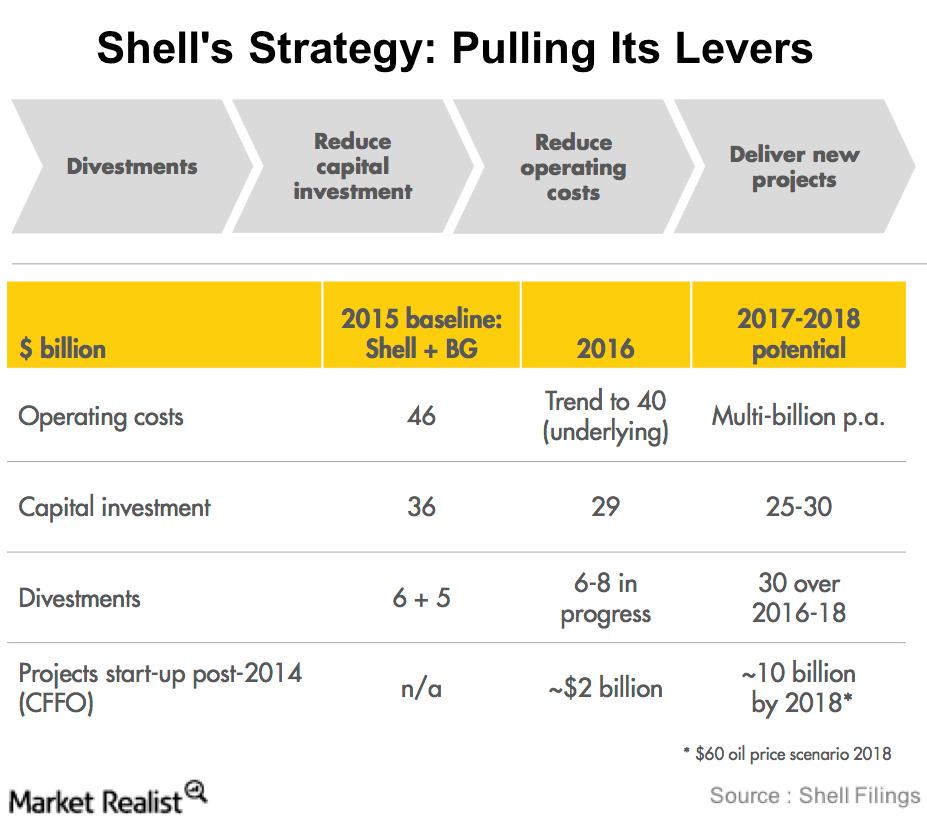
Shell’s Strategy: Pulling Its Levers
Shell plans to restructure itself to become more resilient to lower oil prices and more focused in terms of assets. To do this, it plans to use four levers.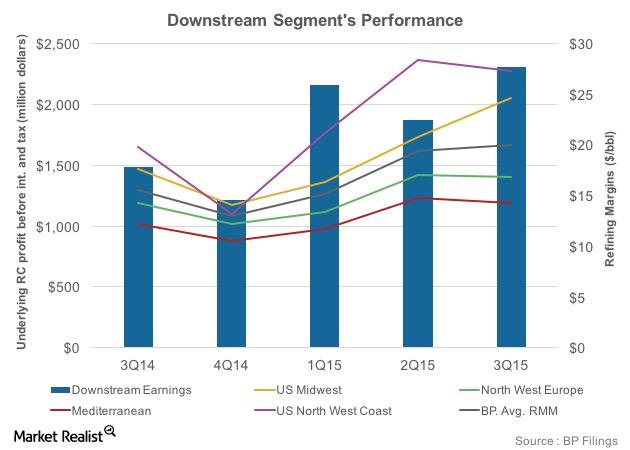
Overview of BP’s Refining Segment and Margins
BP’s refining segment has 2.0 million barrels per day of refining capacity worldwide. In the United States, it has around 0.74 MMbpd of refining capacity.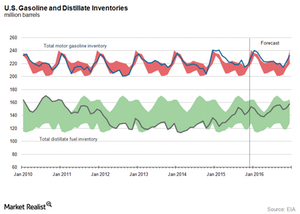
Will the Gasoline and Distillate Inventory Pressure Crude Oil Prices?
The API (American Petroleum Institute) published its weekly crude oil, gasoline, and distillate inventory report on January 12, 2016.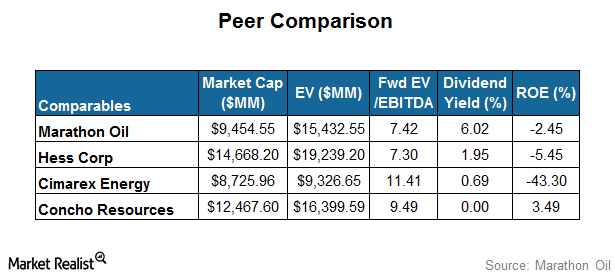
Marathon Oil’s Relative Valuation: A Comparison with Its Peers
In this part of the series, we’ll look at Marathon Oil’s (MRO) relative valuation against its peers’ multiples.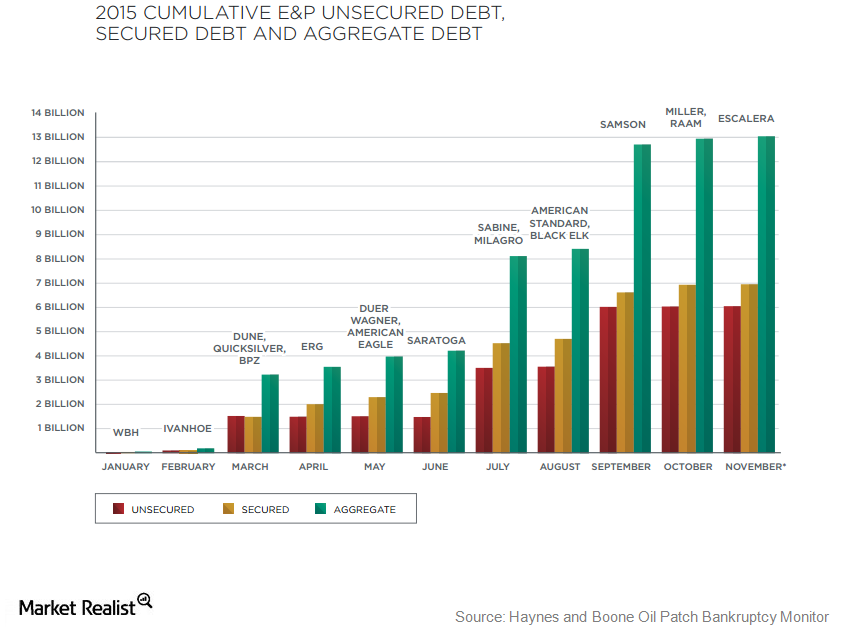
US Oil and Gas Companies’ Debt Exceeds $200 Billion
US oil and gas exploration and production companies are under severe pressure.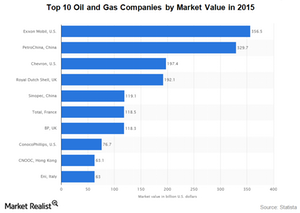
Bearish Crude Oil Market Has Put $5 Trillion at Risk
The depressed energy market has erased just over $1 trillion of market capitalization from oil and gas companies around the globe.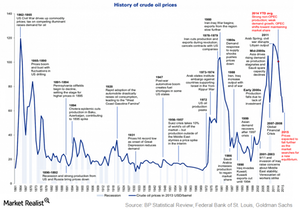
Why Roller Coaster Crude Oil Prices Are Nothing New
Crude oil prices like any other commodity are subject to changes based on the supply and demand dynamics.