Skechers USA Inc
Latest Skechers USA Inc News and Updates
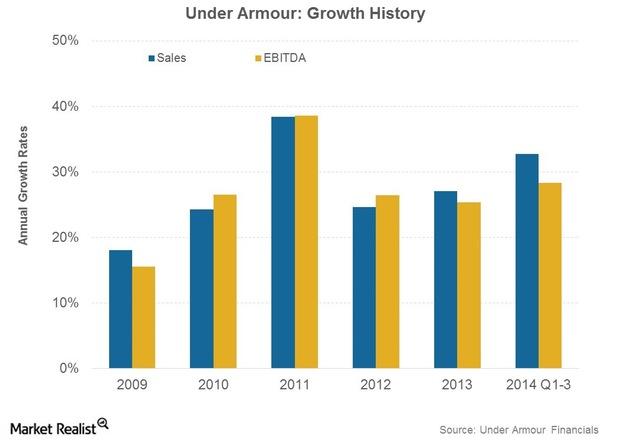
Where NIKE And Under Armour Win In The Market Share Stakes
Under Armour’s share of the apparel market rose from 14% to 16%, year-over-year, in the first nine months of 2014.
Why Skechers Is Thriving in a Competitive Footwear Market
Skechers grabbed the number two spot in the US footwear market last year. The company’s brands were also ranked number one in walking and work footwear.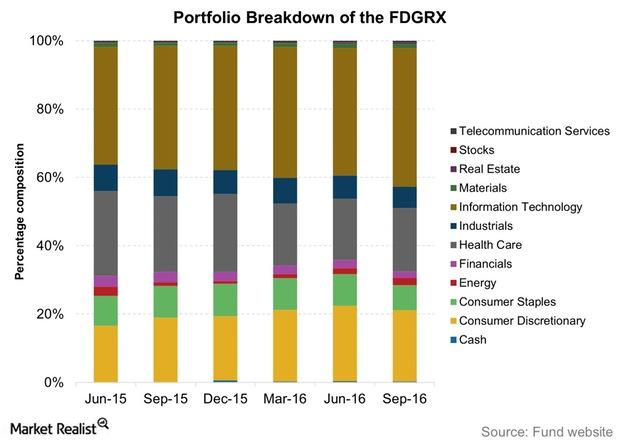
Inside the Fidelity Growth Company Fund Portfolio
FDGRX’s core sectors are information technology, consumer discretionary, and healthcare. The first two sectors make up a little over 60% of the portfolio.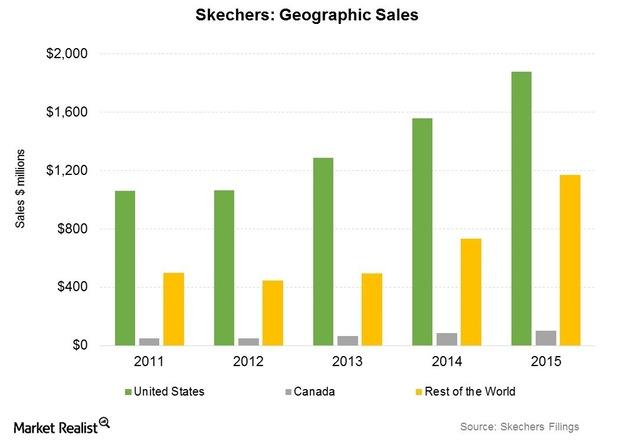
Skechers’ China Sales Rise: What’s the Growth Outlook?
China has been an important element in Skechers’ success in international markets. Sales from China rose to $220 million in 2015 from $86 million in 2014.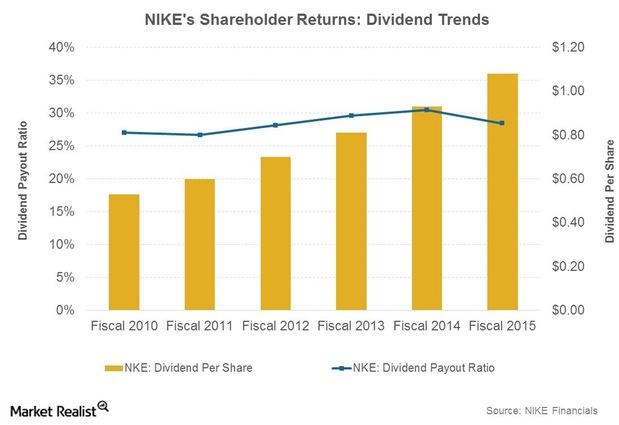
Nike: 5-Year Returns Targets for Shareholders
At its 2015 Investor Day held on September 14, Nike briefed the financial community on its targets for generating value for shareholders.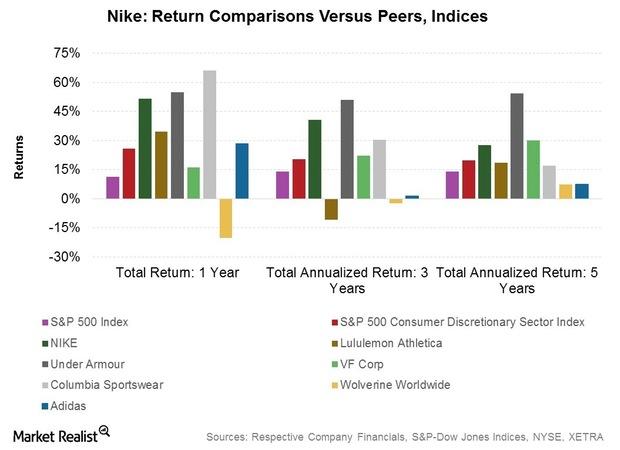
Analysis: Nike’s 5-Year Roadmap to Grow Sales
Nike holds the top position in athletic footwear and athletic apparel. It’s apparel and footwear sales were $8.6 billion and $18.3 billion, respectively, in fiscal 2015.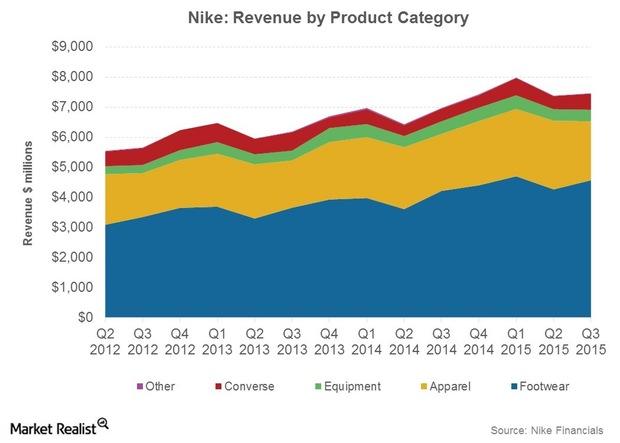
Nike Still Dominates Athletic Footwear in 1Q15
US dollar sales of athletic footwear rose 8% in the first quarter of 2015. Nike was the most dominant brand by far with a market share of 62%.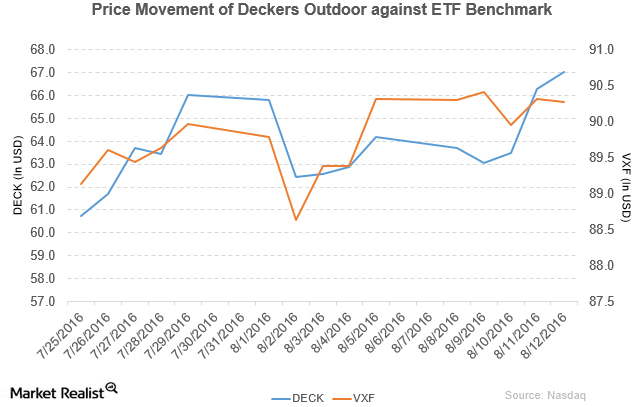
Susquehanna Rates Deckers Outdoor as ‘Neutral’
Deckers Outdoor (DECK) has a market cap of $2.1 billion. It rose by 1.1% to close at $67.01 per share on August 12, 2016.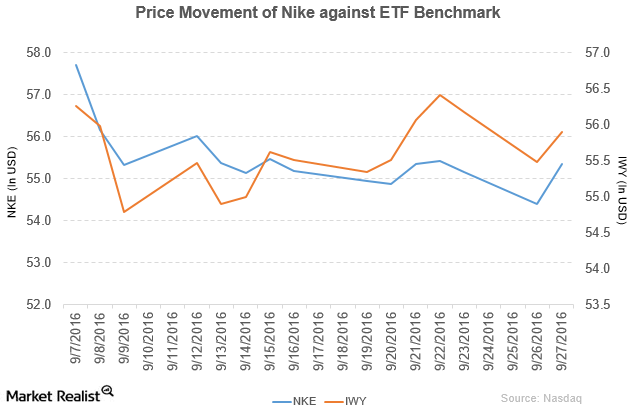
How Did Nike Perform in 1Q17?
Nike (NKE) has a market cap of $92.9 billion. It rose 1.7% to close at $55.34 per share on September 27, 2016.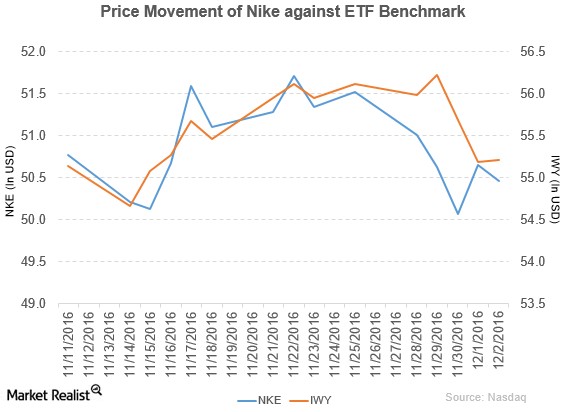
Nike Announces the Launch of New Products
Nike (NKE) fell 1.7% to close at $50.46 per share during the fifth week of November 2016.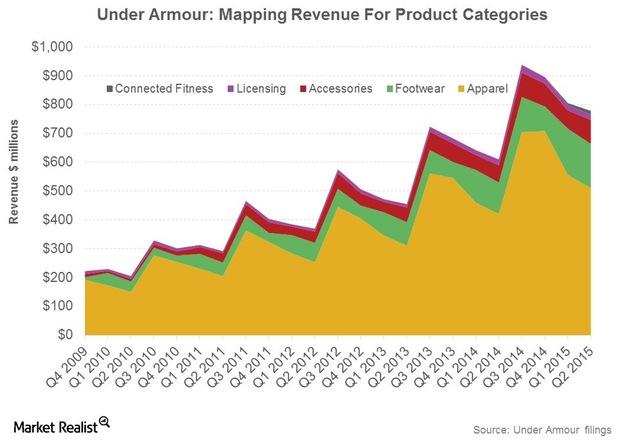
Under Armour’s Footwear Business versus Skechers and New Balance
Primarily an apparel player, Under Armour (UA) has stepped up its pace in entering new footwear categories.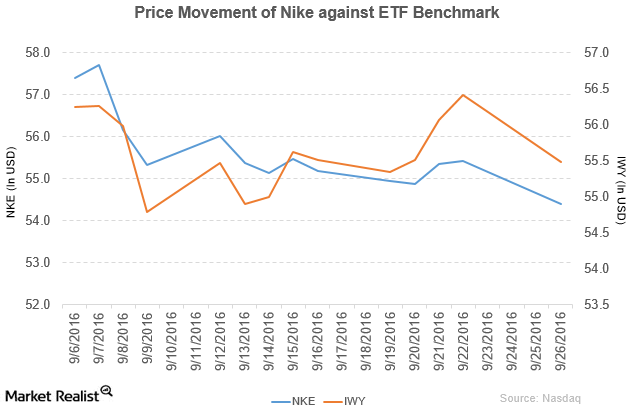
Why Did Nike Stock Fall on September 26?
Nike (NKE) has a market cap of $91.3 billion. It fell 1.4% to close at $54.40 per share on September 26.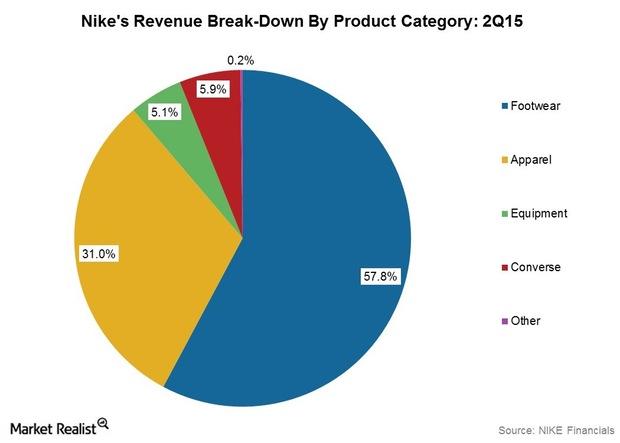
Market Share Gain Spurs NIKE’s North American Footwear Revenues
In the US, in 2014 year-to-date, NIKE, Converse, and the Jordan brands combined accounted for over 60% of market share in athletic footwear.
What to Expect from Skechers’ Q1 Earnings
Skechers will likely release its first-quarter results after the financial markets close on Thursday. The company withdrew its Q1 guidance on March 18.
Why Is Under Armour Stock Facing Pressure?
J.P. Morgan expects Under Armour’s fiscal 2020 revenues to mark 3.8% growth. J.P. Morgan’s growth forecast is well below analysts’ consensus estimate.
Lululemon Stock: What’s behind Its Exceptional Growth?
Lululemon stock is beating the broader markets by a wide margin. Barclays has initiated coverage on LULU with an “overweight” rating.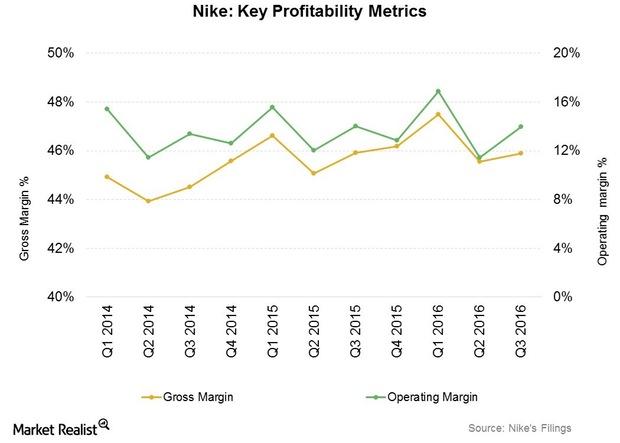
How Nike Has Sustained Profitability despite Headwinds
Nike’s profitability in fiscal 3Q16 was helped by better-than-average performance in North America and Greater China, two of its most profitable segments.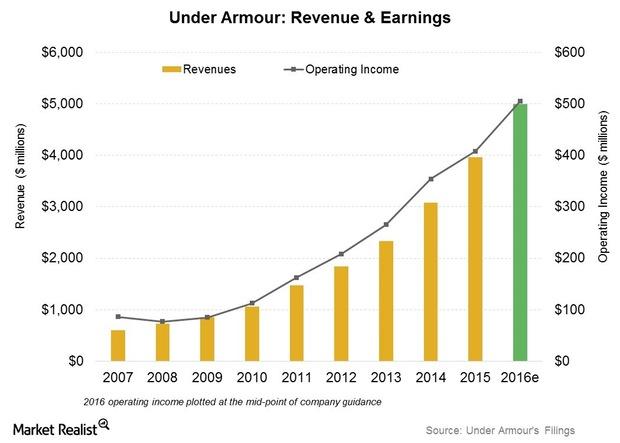
How Much Has Under Armour Increased Revenue Guidance?
Under Armour raised the higher end of its 2016 operating income estimate to $503 million–$507 million, implying a growth rate of 23.1%–24.1% over 2015.
Skechers: Achieving Growth through Diverse Product Development
Since the launch of its first line in 1992, Skechers has diversified into several new lines, targeting different demographics and different activities.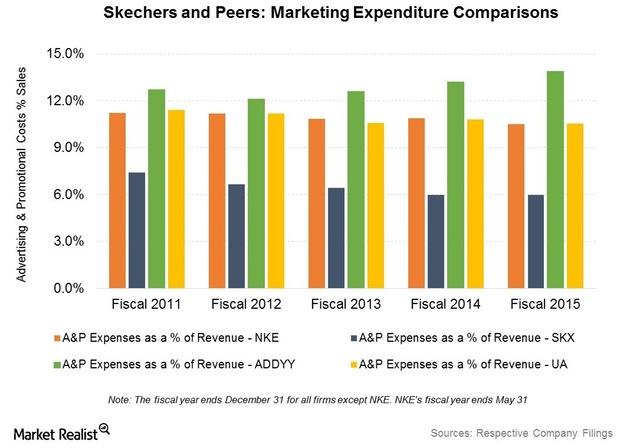
Marketing and Branding: How Skechers Sells Its Footwear Products
To maintain its market share and drive sales, Skechers spends considerable time and effort in marketing activities to promote its footwear globally.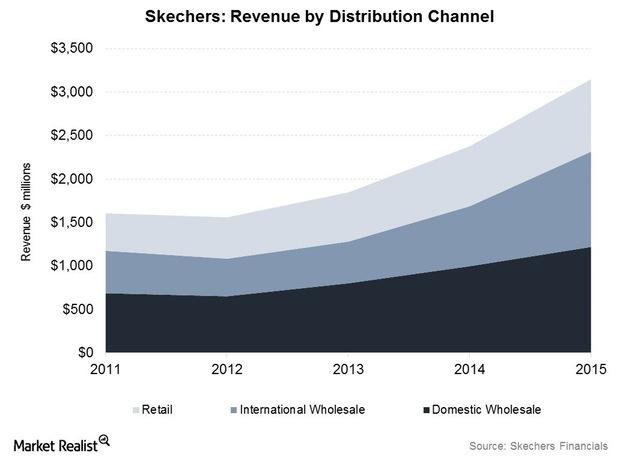
How Skechers Sells Its Products to Its Customers
In 2015, Skechers became the second-largest footwear company in the United States, trailing global market leader Nike (NKE).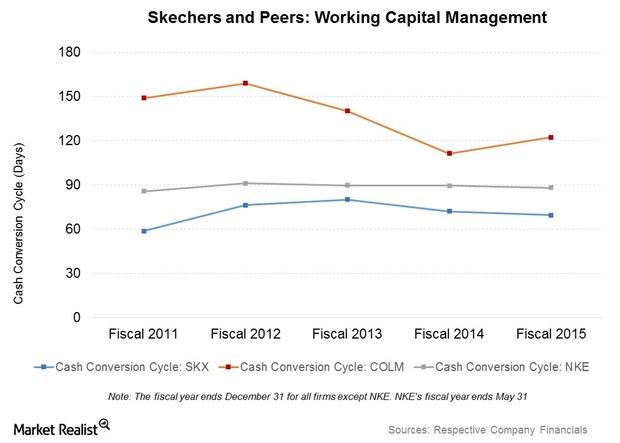
Skechers Footwear: Design, Sourcing, and Manufacturing Overview
Skechers designs footwear with its own in-house design team. However, it doesn’t own or operate any factories in which to conduct its manufacturing.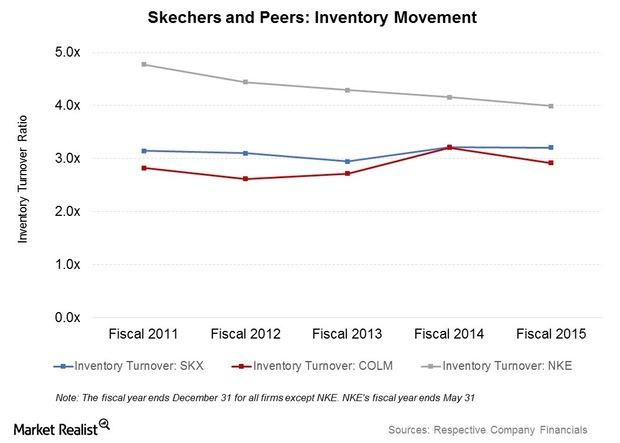
How Does Skechers Manage Its Inventory and Distribution?
In recent years, Skechers has reported improved working capital metrics. The company’s inventory turnover (or ITR) rose from 2.9x in 2013 to 3.2x in 2015.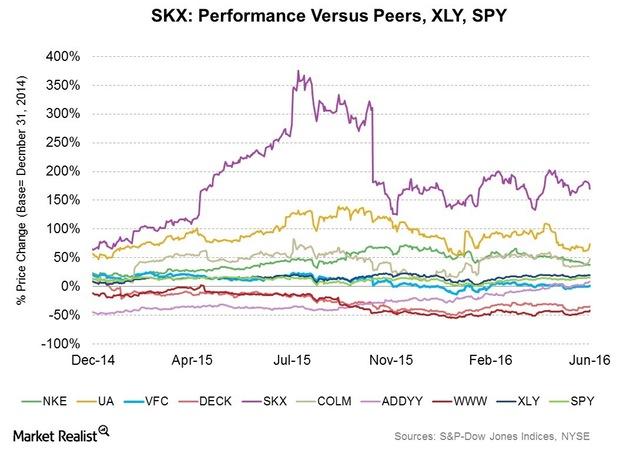
Comparing Skechers’ Strengths and Weaknesses
Skechers is quickly establishing its presence in international markets. It made $3.1 billion in sales in 2015, of which 40.4% stemmed from overseas markets.
Skechers Stock Falls on Mixed Third-Quarter Results
Skechers (SKX) stock was down 4.2% today in reaction to the footwear maker’s mixed third-quarter results. Find out what went wrong for the company.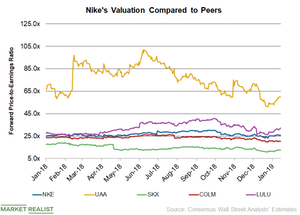
Comparing Nike’s PE Ratio with Its Peers
On January 14, Nike’s 12-month forward PE ratio was 25.8x. For fiscal 2019, analysts expect Nike’s adjusted EPS to increase 10.9% YoY to $2.65.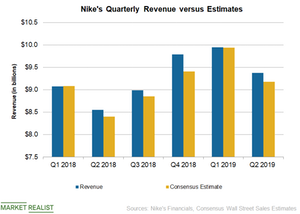
What Drove Nike’s Fiscal 2019 Second-Quarter Revenue
In the second quarter of fiscal 2019, Nike’s (NKE) revenue rose ~10% YoY (year-over-year) to $9.37 billion.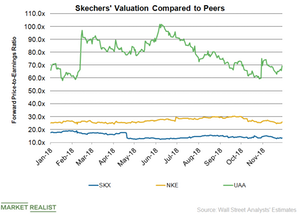
Skechers’ Valuation Compared to Its Peers
As of November 28, Skechers (SKX) was trading at a 12-month forward PE multiple of 13.6x.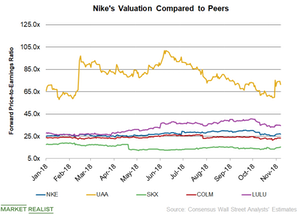
How Nike’s Valuation Compares to Those of Its Peers
In fiscal 2019, analysts expect Nike’s sales to rise 7.6% to $39.2 billion and its EPS to surge ~11.0% to $2.65.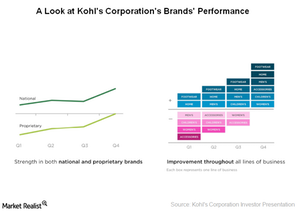
What Are Kohl’s Other Growth Strategies?
Under its Greatness Agenda strategy, Kohl’s is revamping its merchandise offerings, emphasizing the omnichannel experience, and optimizing its marketing spending.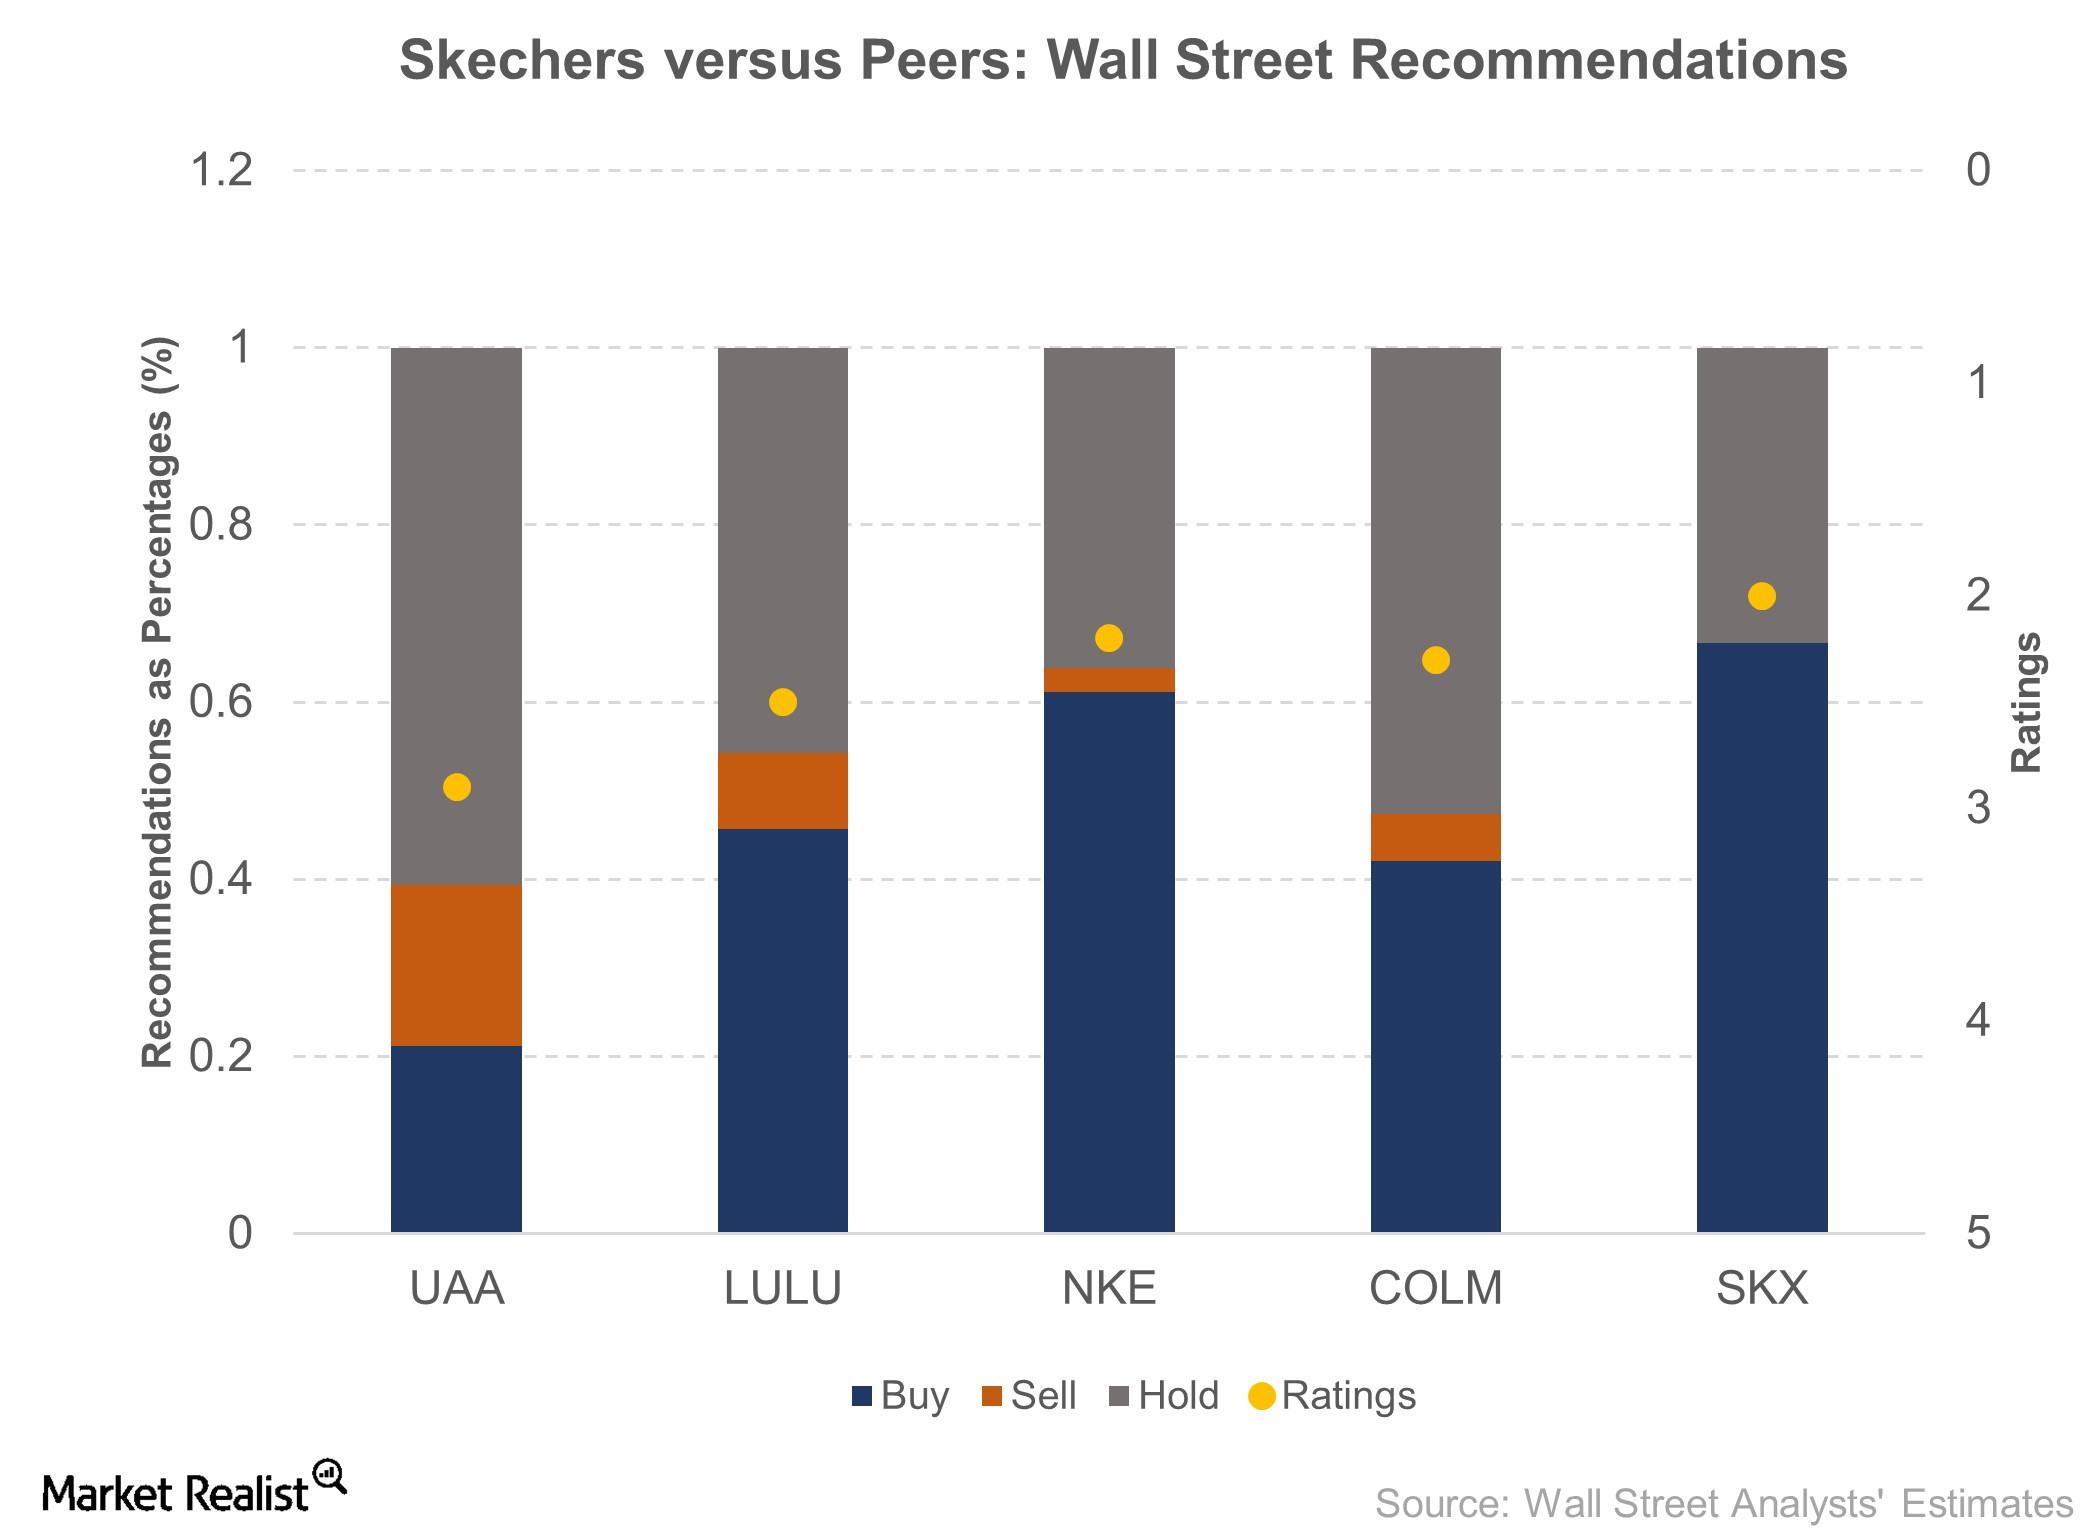
Discussing Wall Street’s View on Skechers
Skechers (SKX) is covered by 12 Wall Street analysts who jointly rate the company as a 2 on a scale of 1 (“strong buy”) to 5 (“sell”).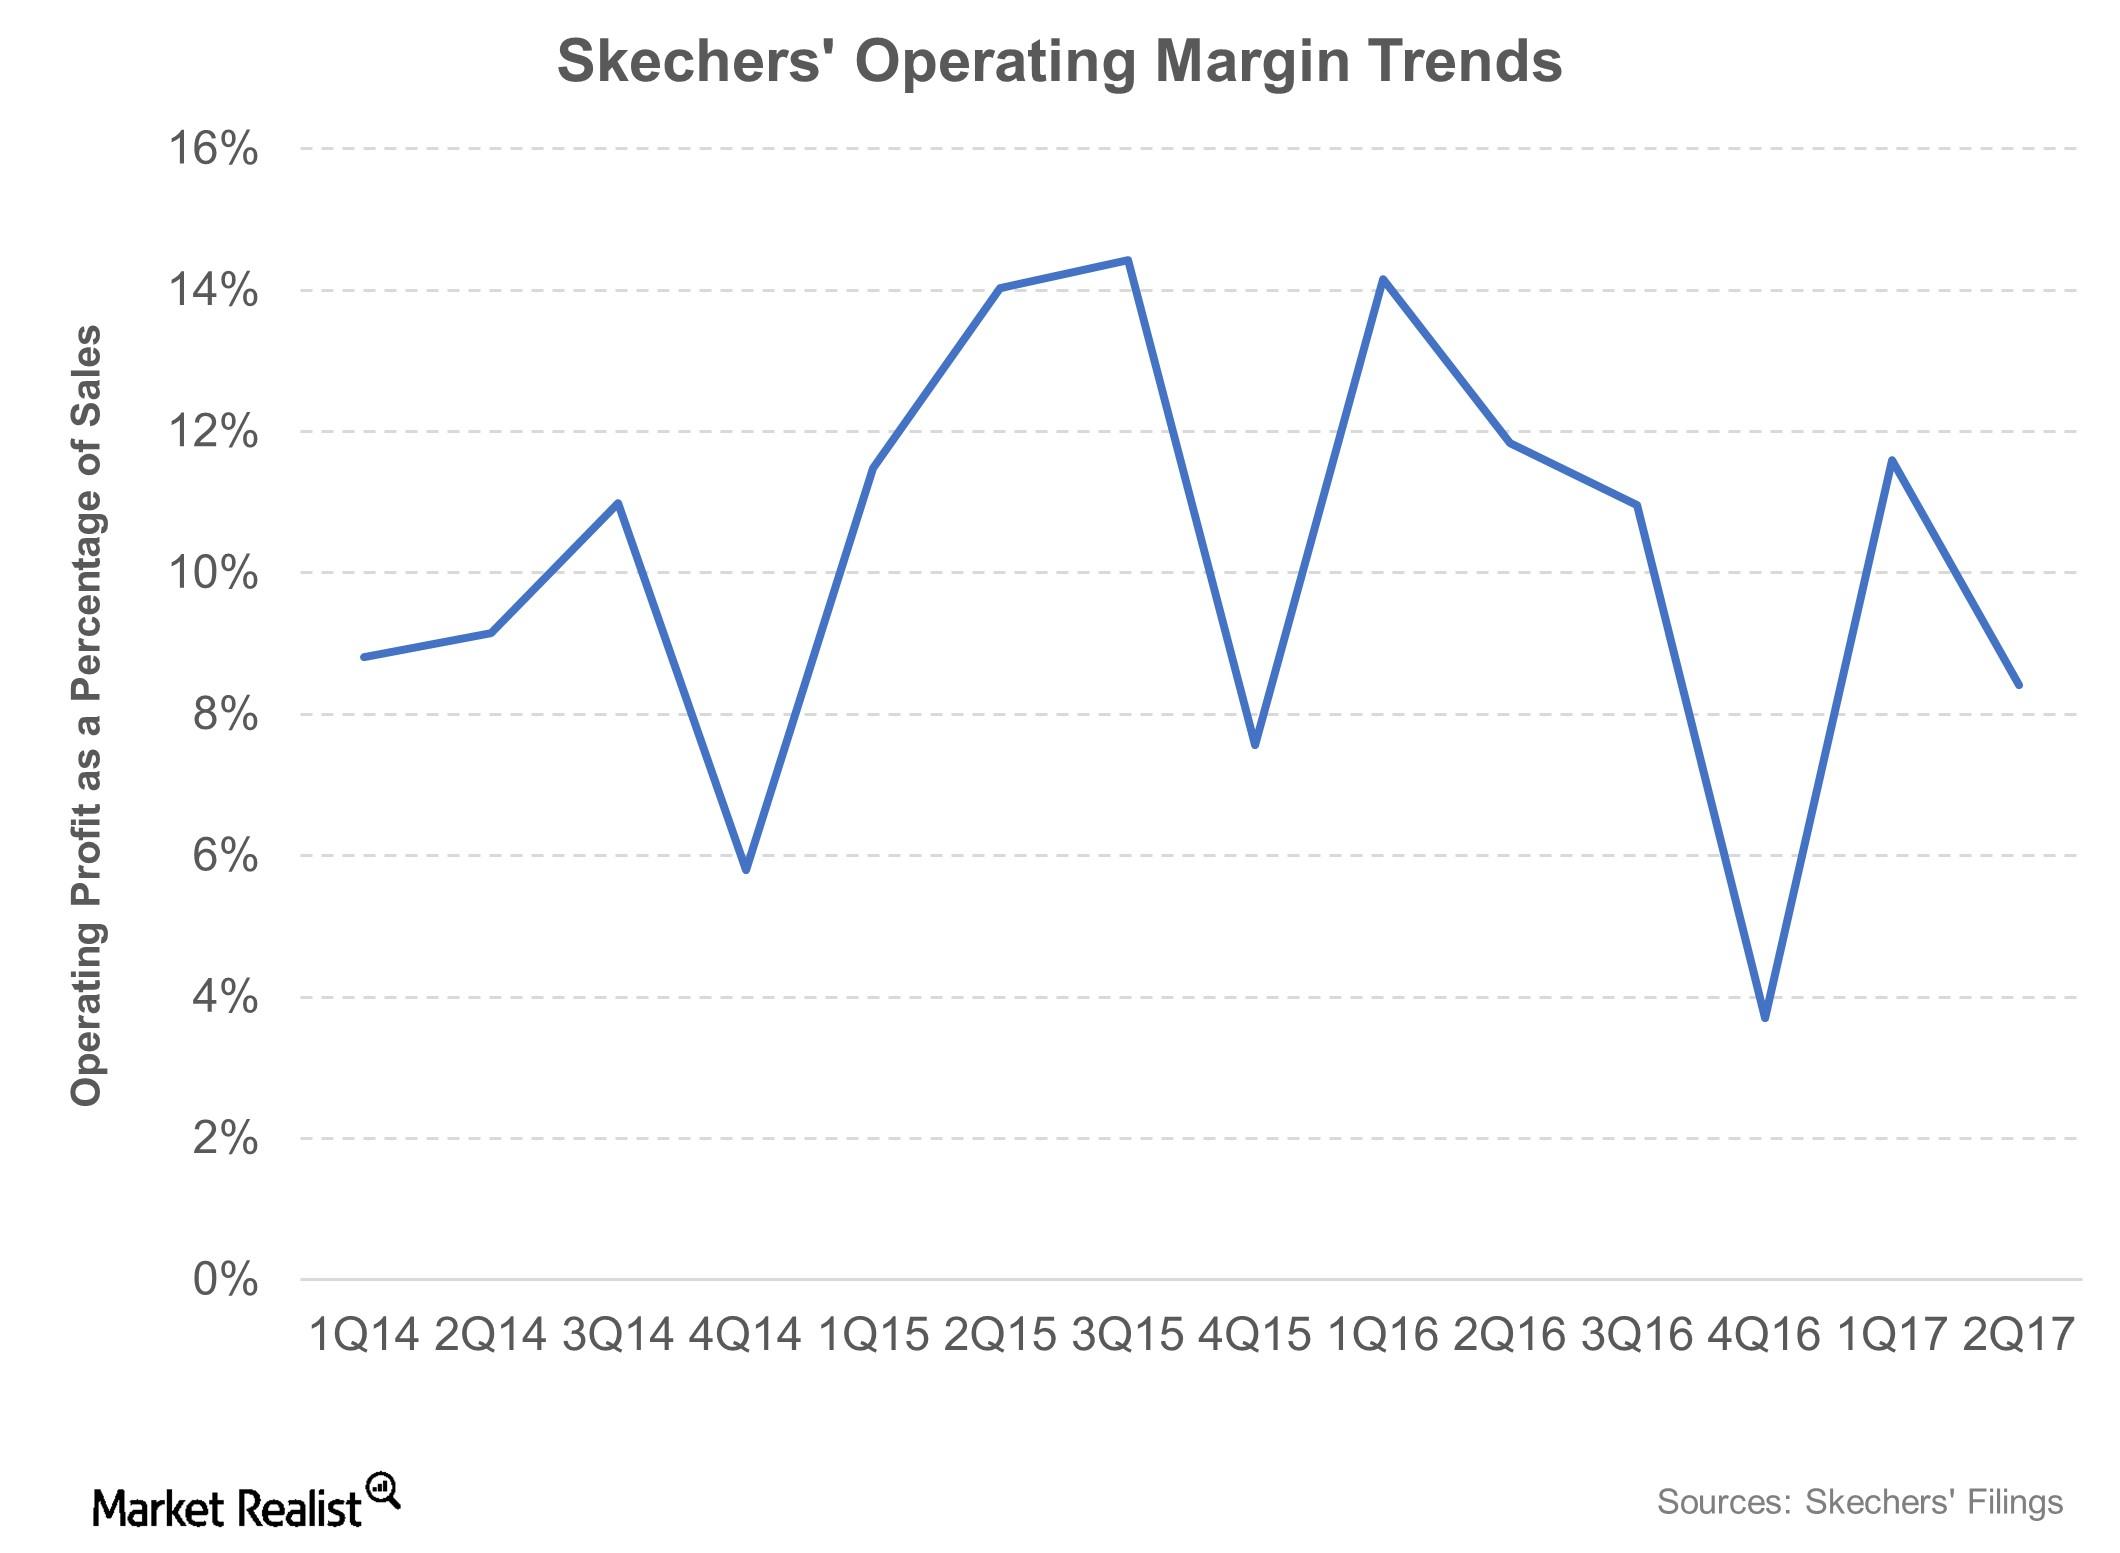
Skechers Reports Its Fifth Straight Fall in Earnings in 2Q17
Skechers, which released its 2Q17 results on July 20, 2017, reported earnings per share of $0.38. The company missed analysts’ consensus expectation by a margin of $0.06.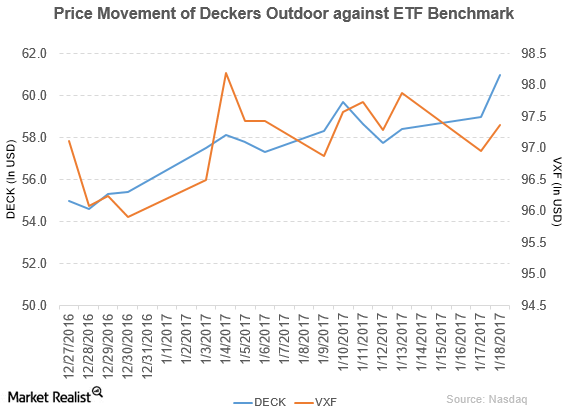
Buckingham Research Upgrades Deckers Outdoor to a ‘Buy’
Deckers Outdoor (DECK) reported fiscal 2Q17 net sales of $485.9 million, a fall of 0.21% from the net sales of $486.9 million in fiscal 2Q16.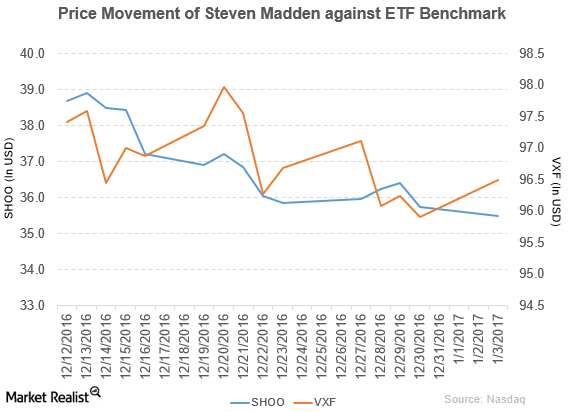
Jefferies Downgrades Steven Madden to ‘Hold’
On January 3, 2017, Jefferies downgraded Steven Madden’s rating from “buy” to “hold” and set the stock’s price target at $37.00 per share.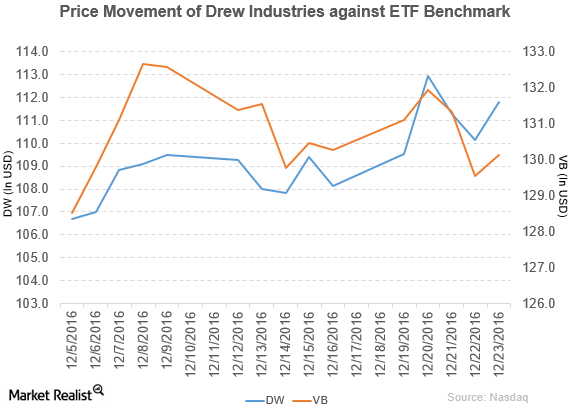
Drew Industries Announces Change of Name and Ticker Symbol
Drew Industries (DW) rose 3.4% to close at $111.80 per share during the third week of December 2016.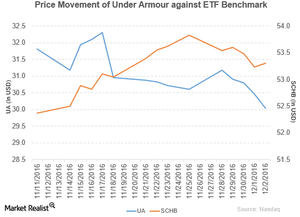
Under Armour Announces a Change in Its Ticker Symbols
Under Armour (UA) fell 1.9% to close at $30.03 per share during the fifth week of November 2016.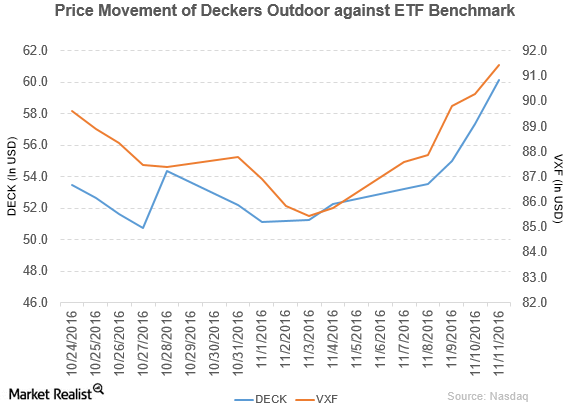
Stifel Upgrades Deckers Outdoor to a ‘Buy’
Price movement Deckers Outdoor (DECK) has a market cap of $1.9 billion. It rose 4.9% to close at $60.17 per share on November 11, 2016. The stock’s weekly, monthly, and year-to-date (or YTD) price movements were 15.2%, 5.7%, and 27.5%, respectively, on the same day. DECK is trading 11.7% above its 20-day moving average, 3.8% […]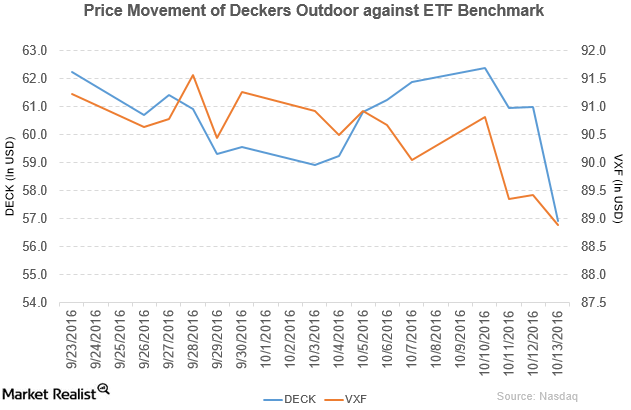
Why Susquehanna Downgraded Deckers Outdoor to ‘Negative’
Deckers Outdoor (DECK) has a market cap of $1.8 billion. It fell 6.7% to close at $56.92 per share on October 13, 2016.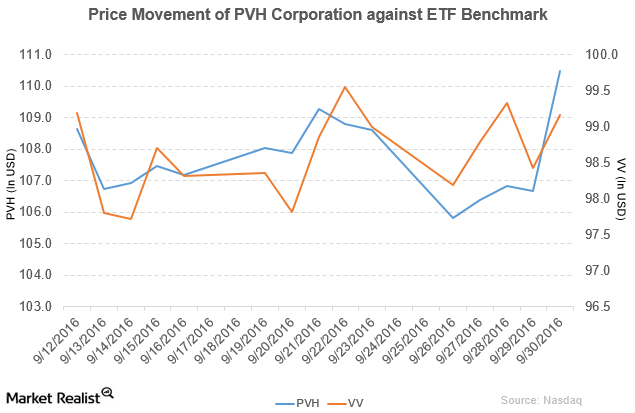
Guggenheim Has Rated PVH Corporation a ‘Buy’
PVH Corporation (PVH) has a market cap of $8.9 billion. It rose 3.6% to close at $110.50 per share on September 30, 2016.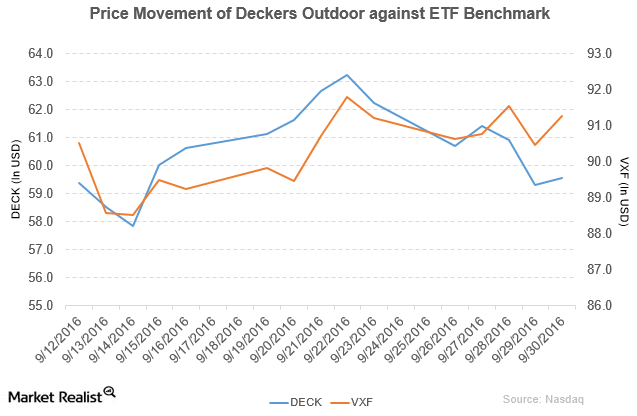
Guggenheim Has Given Deckers Outdoor a ‘Neutral’ Rating
Deckers Outdoor (DECK) has a market cap of $1.9 billion. It rose 0.42% to close at $59.55 per share on September 30, 2016.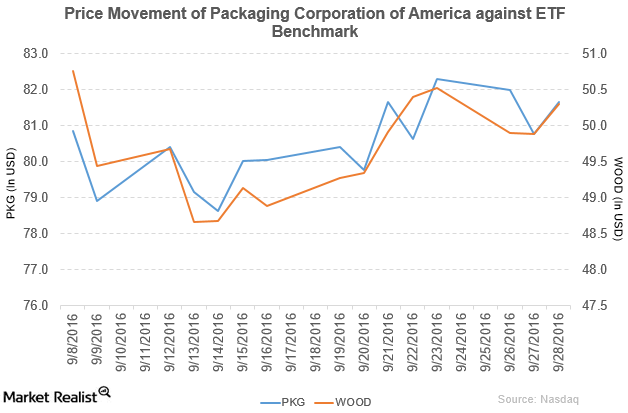
Why Is Andrews & Springer Investigating Packaging Corporation of America?
PKG rose 1.1% to close at $81.66 per share on September 28. Its weekly, monthly, and YTD price movements were 0.0%, 4.3%, and 32.9%.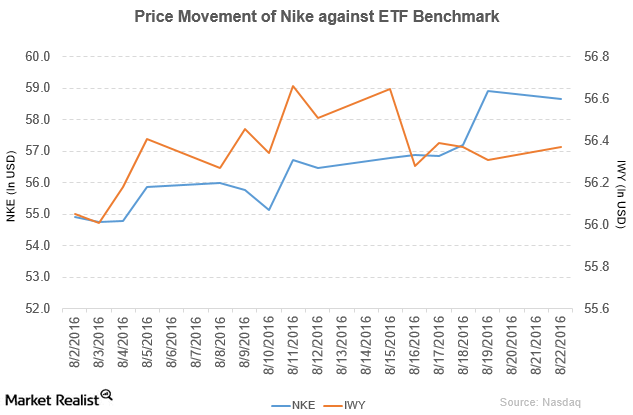
Why Did Nike Update Its Nike+ Run Club App?
In fiscal 2016, Nike reported revenue of $32.4 billion—a rise of 5.9% year-over-year. The company’s gross profit margin rose by 0.43% in fiscal 2016.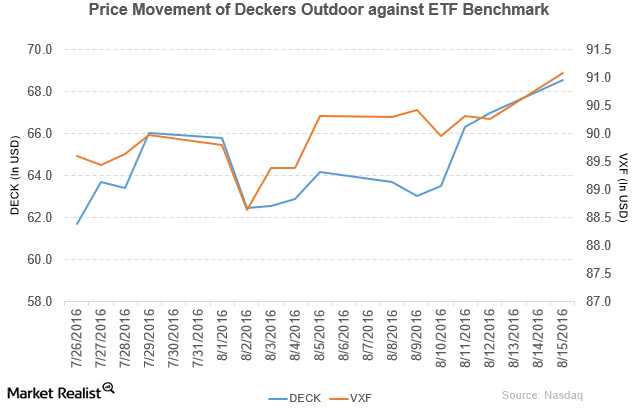
Telsey Advisory Upgrades Deckers Outdoor to ‘Outperform’
Deckers Outdoor rose by 2.3% and closed at $68.55 per share on August 15. Its weekly, monthly, and YTD price movements were 7.6%, 10.2%, and 45.2%.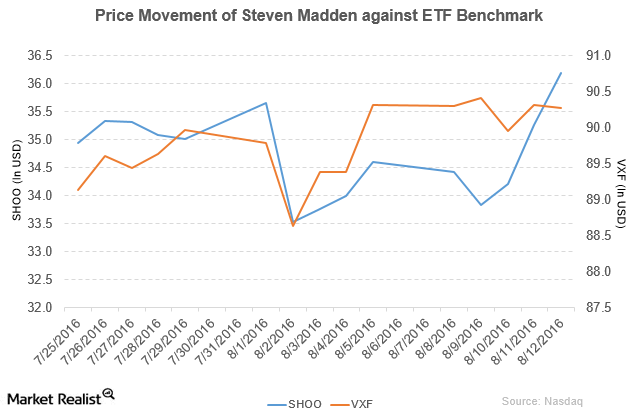
Susquehanna Rates Steve Madden as ‘Positive’
Steve Madden (SHOO) has a market cap of $2.2 billion. It rose by 2.6% to close at $36.20 per share on August 12, 2016.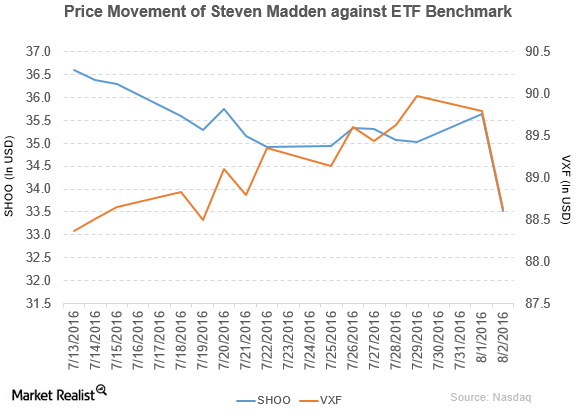
A Look at Steven Madden’s Financial Footprint in 2Q16
Steven Madden (SHOO) has a market cap of $2.1 billion. It fell by 6.0% to close at $33.52 per share on August 2, 2016.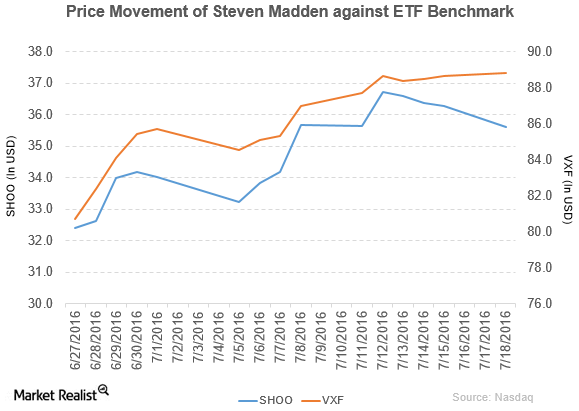
Buckingham Research Downgrades Steven Madden to ‘Neutral’
Steven Madden (SHOO) has a market cap of $2.2 billion. It fell by 1.9% to close at $35.60 per share on July 18, 2016.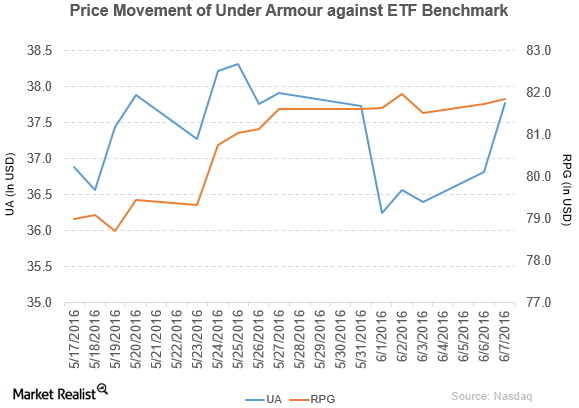
What Boosted Under Armour on June 7?
Under Armour rose by 2.6% to close at $37.77 per share on June 7. Its weekly, monthly, and YTD price movements were 0.11%, -2.4%, and -6.3%, respectively.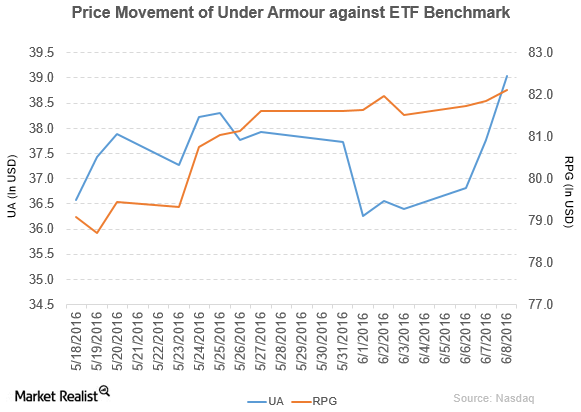
What Drove Under Armour’s Rise on June 8?
Under Armour (UA) has a market cap of $7.1 billion. It rose by 3.4% to close at $39.04 per share on June 8, 2016.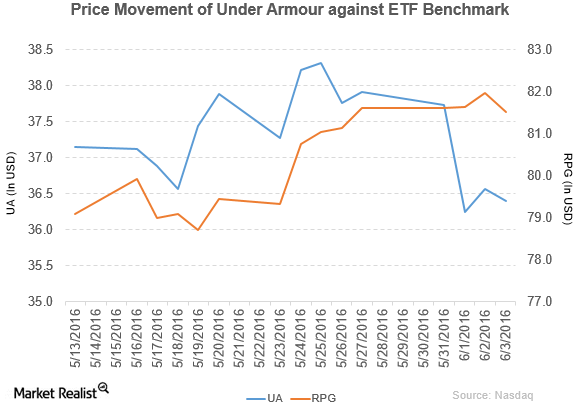
Under Armour Has Declared a Dividend for Its Class C Stock
Under Armour (UA) has a market cap of $6.7 billion. It fell by 0.44% to close at $36.40 per share on June 3, 2016.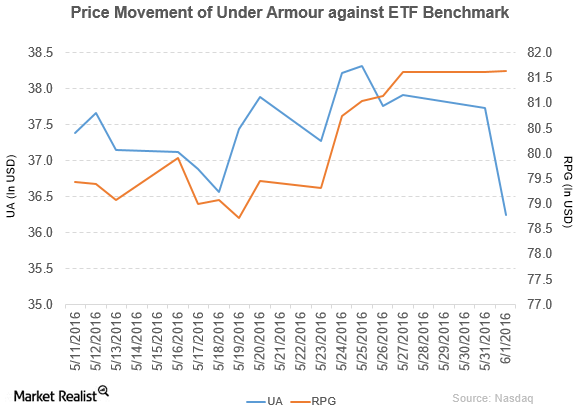
Under Armour Saw Its Price Target after Its Revised Outlook
Under Armour (UA) has a market cap of $6.6 billion. It fell by 3.9% to close at $36.25 per share on June 1, 2016.