Stifel Upgrades Deckers Outdoor to a ‘Buy’
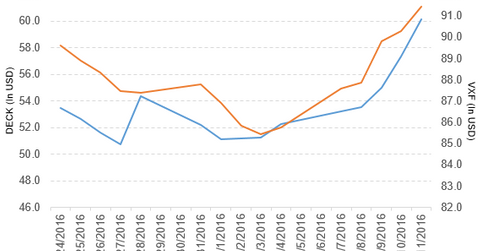
Price movement Deckers Outdoor (DECK) has a market cap of $1.9 billion. It rose 4.9% to close at $60.17 per share on November 11, 2016. The stock’s weekly, monthly, and year-to-date (or YTD) price movements were 15.2%, 5.7%, and 27.5%, respectively, on the same day. DECK is trading 11.7% above its 20-day moving average, 3.8% […]
Nov. 15 2016, Updated 8:05 a.m. ET

Price movement
Deckers Outdoor (DECK) has a market cap of $1.9 billion. It rose 4.9% to close at $60.17 per share on November 11, 2016. The stock’s weekly, monthly, and year-to-date (or YTD) price movements were 15.2%, 5.7%, and 27.5%, respectively, on the same day. DECK is trading 11.7% above its 20-day moving average, 3.8% above its 50-day moving average, and 4.3% above its 200-day moving average.
Related ETF and peers
The Vanguard Extended Market ETF (VXF) invests 0.05% of its holdings in Deckers Outdoor. The ETF tracks a market-cap-weighted version of the S&P Total Market Index, excluding S&P 500 stocks. The YTD price movement of VXF was 10.2% on November 11. The market caps of Deckers Outdoor’s competitors are as follows:
Deckers Outdoor’s rating
On November 11, 2016, Stifel upgraded Deckers Outdoor’s rating to “buy” from “hold.” It increased the stock’s price target to $68 from $60 per share.
Performance of Deckers Outdoor in fiscal 2Q17
Deckers Outdoor reported fiscal 2Q17 net sales of $485.9 million, a fall of 0.21% from the net sales of $486.9 million in fiscal 2Q16. The company’s gross profit margin and income from operations as a percentage of net sales expanded by 50 basis points and 60 basis points, respectively, between fiscal 2Q16 and fiscal 2Q17.
Its net income and EPS (earnings per share) rose to $37.6 million and $1.21, respectively, in fiscal 2Q17, compared with $36.3 million and $1.11, respectively, in fiscal 2Q16. It reported non-GAAP (generally accepted accounting principles) EPS of $1.23 in fiscal 2Q17.
DECK’s cash and cash equivalents fell 55.3%, and its inventories rose 92.7% between fiscal 4Q16 and fiscal 2Q17. Its current ratio fell to 2.0x, and its debt-to-equity ratio rose to 0.64x in fiscal 2Q17, compared with 3.3x and 0.32, respectively, in fiscal 4Q16.
Projections
Deckers Outdoor has made the following projections for fiscal 2017:
- net sales growth of -3% to -1.5%
- gross margin of 47.0% to 47.5%
- EPS of $4.05 to $4.25
The company expects net sales growth in the range of -2% to flat for fiscal 3Q17. Next, we’ll discuss Carter’s (CRI).
