Analyzing the Relationship between the US Dollar and Natural Gas
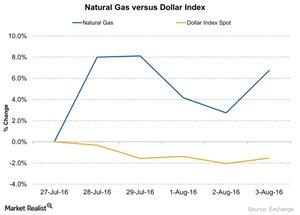
Between July 27 and August 3, 2016, natural gas futures rose by ~6.7%, and the US Dollar Index fell by ~1.5%.
Nov. 20 2020, Updated 1:47 p.m. ET

Natural gas and the US Dollar Index
Between July 27 and August 3, 2016, natural gas (UNG) (FCG) (BOIL) (GASL) (GASX) (UGAZ) (DGAZ) futures rose by ~6.7%, and the US Dollar Index (UUP) fell by ~1.5%. The US Dollar Index fell by ~1.3% on July 29, 2016, after weak GDP data were released.
In the last five trading sessions, natural gas futures and the US Dollar Index moved in opposite directions in three instances. The correlation between the two over the last five trading sessions was 0.13%. This means that movements in natural gas are influenced more by fundamental news than by the US Dollar Index. This is similar to the relationship between the US dollar and crude oil in the five trading sessions ending on July 26.
Natural gas price movements
On May 2, 2016, the US Dollar Index closed at 92.6—its lowest level year-to-date. Between May 2 and August 3, the US Dollar Index rose by ~3.1%, while natural gas futures rallied by 39%.
Between May 2 and August 3, the US Dollar Index and natural gas prices moved in opposite directions based on closing price in 32 out of 65 trading sessions. This isn’t enough evidence to point to an inverse relationship between the two, such as the relationship between the US dollar (UUP) and crude oil prices over the long term. A strong dollar makes crude oil expensive for crude oil–importing countries.
This analysis could be important for natural gas–weighted stocks such as Range Resources (RRC), Antero Resources (AR), Rex Energy (REXX), Gulfport Energy (GPOR), EXCO Resources (XCO), Contango Oil & Gas (MCF), and Memorial Resource Development (MRD).
Effect on ETFs
Natural gas prices also impact ETFs such as the Direxion Daily S&P Oil & Gas Exp. & Prod. Bear 3x Shares (DRIP), the SPDR S&P Oil & Gas Exploration & Production ETF (XOP), the Vanguard Energy ETF (VDE), and the Fidelity MSCI Energy Index ETF (FENY).
Range Resources (RRC), Antero Resources (AR), Rex Energy (REXX), Gulfport Energy (GPOR), EXCO Resources (XCO), Contango Oil & Gas (MCF), and Memorial Resource Development (MRD) operate with production mixes of 71.2%, 80.6%, 62.4%, 78.0%, 88.7%, 66.9%, and 78.1%, respectively, in natural gas.
