Direxion Daily Natural Gas Related Bear 3x Shares
Latest Direxion Daily Natural Gas Related Bear 3x Shares News and Updates
How Much Natural Gas Could Fall Next Week
On November 16, 2017, the implied volatility of natural gas was 44%—6.4% above its 15-day average.
Will Natural Gas Prices Fall to $2.8 Next Week?
On November 2, 2017, natural gas’s (GASL) (GASX) implied volatility was 38.2%, 1.8% below its 15-day average.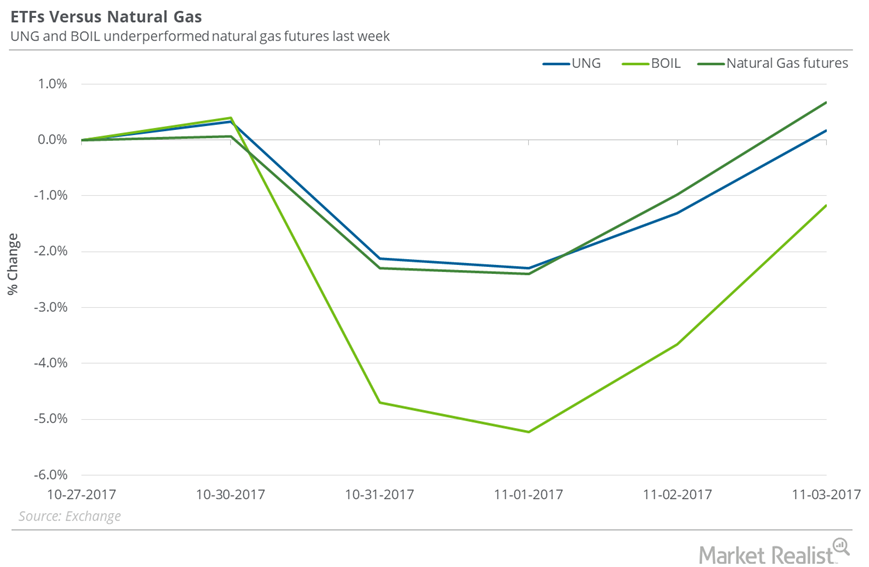
How Natural Gas ETFs Fared Last Week
Between October 27 and November 3, 2017, the United States Natural Gas Fund LP (UNG) rose just 0.2%, and natural gas December futures rose 0.7%.
Where Natural Gas Prices Could Go Next Week
On September 21, 2017, natural gas implied volatility was 35.1%, or 5.1% above the 15-day average.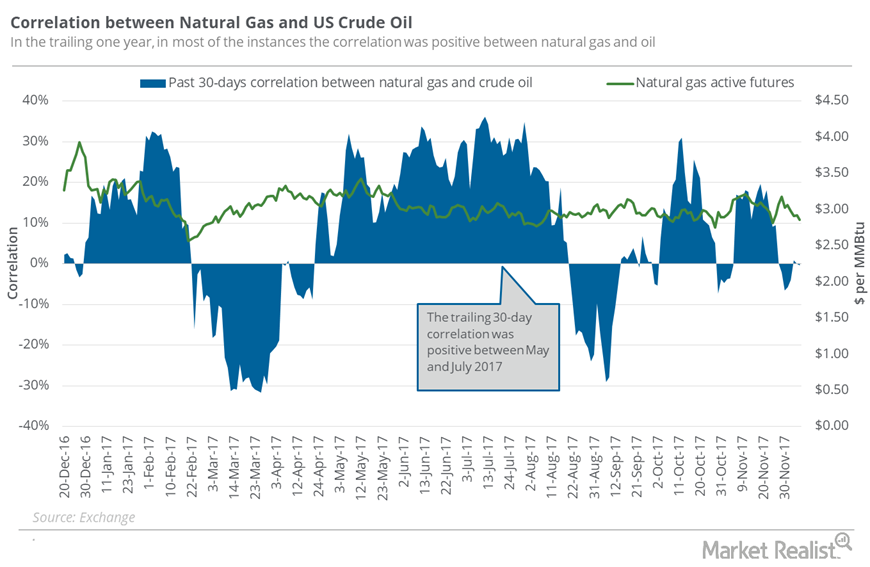
Does the Natural Gas Fall Relate to Oil’s Decline?
Between November 29 and December 6, natural gas (GASL)(GASX)(FCG) January 2018 futures had a correlation of -1.6% with US crude oil January futures.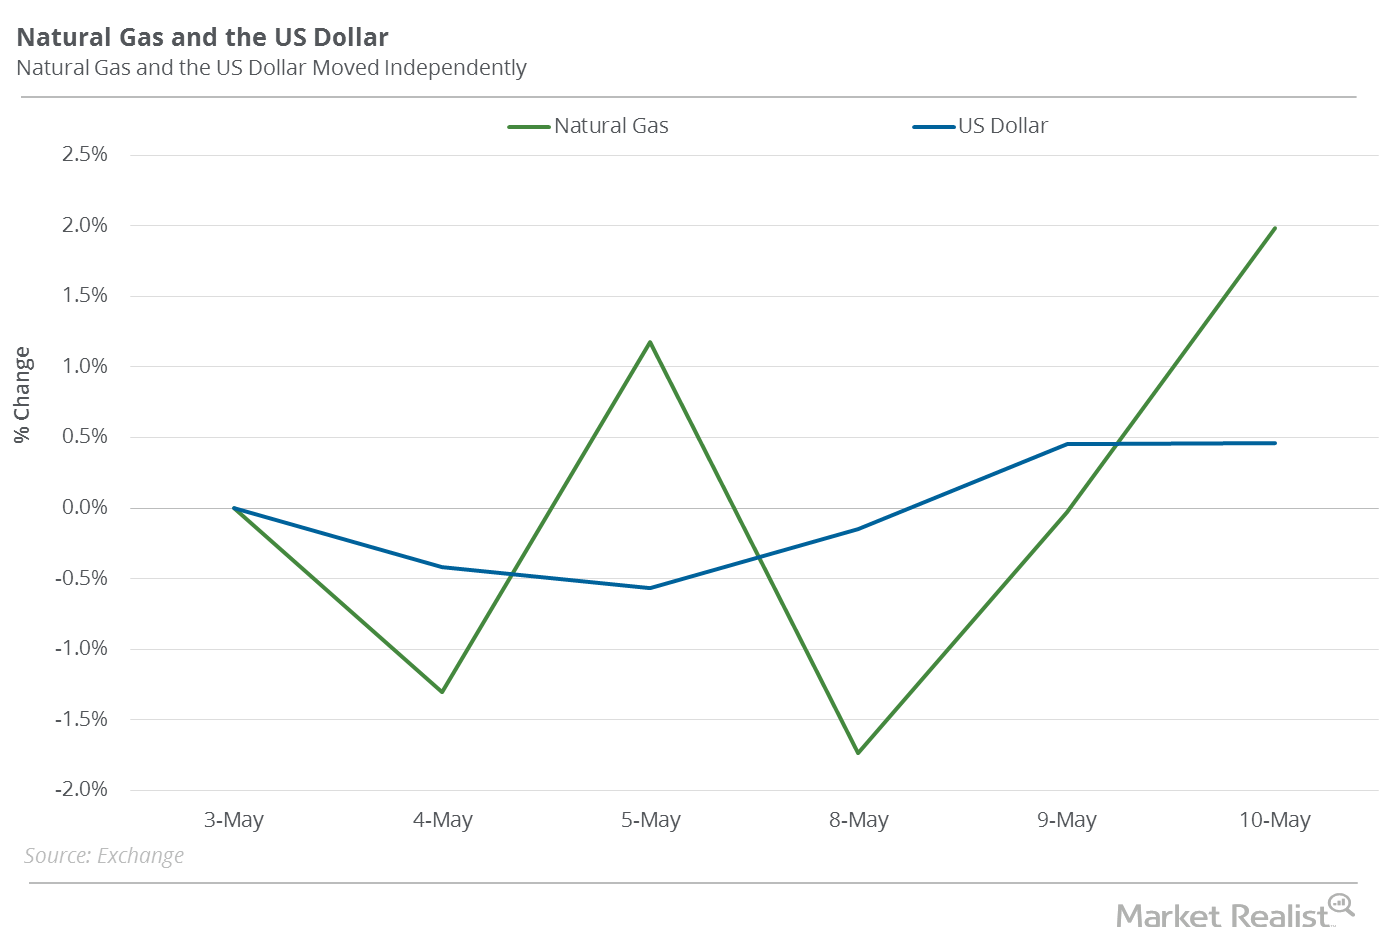
Natural Gas Prices Are Impacted by the US Dollar
Between May 3 and May 10, 2017, natural gas (GASX) (FCG) (GASL) June futures rose 2%. The US dollar (UUP) (UDN) (USDU) rose 0.5% during that period.
Could Natural Gas Reach a New 2017 Low Next Week?
Implied volatility On December 21, 2017, natural gas futures’ implied volatility was 42.4%. In the last trading session, their implied volatility was on par with the 15-day average. Supply-glut concerns pushed natural gas (UNG) (BOIL) futures to a 17-year low on March 3, 2016, with an implied volatility of 53.8%. From this multiyear low, natural gas prices […]
Can Natural Gas Stay above $3 Next Week?
On November 30, 2017, natural gas’s implied volatility was 44.3%, about 1% above its 15-day average.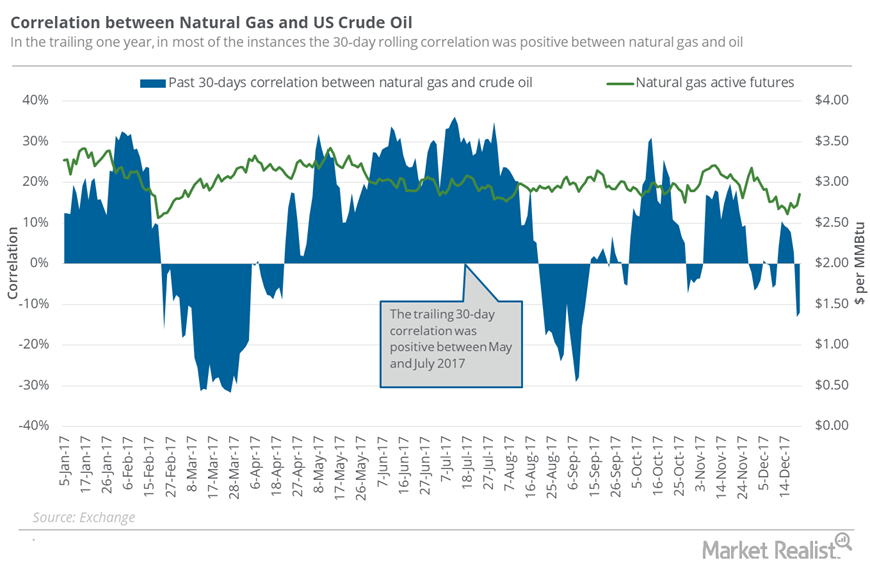
Is Natural Gas Moving with Oil Prices?
The correlation between natural gas (GASL)(GASX)(FCG) active futures with US crude oil active futures was 99.8% between December 12 and December 19.
What to Expect from Natural Gas Next Week
On January 18, 2018, natural gas’s implied volatility was 53.9%, 10.2% above its 15-day average.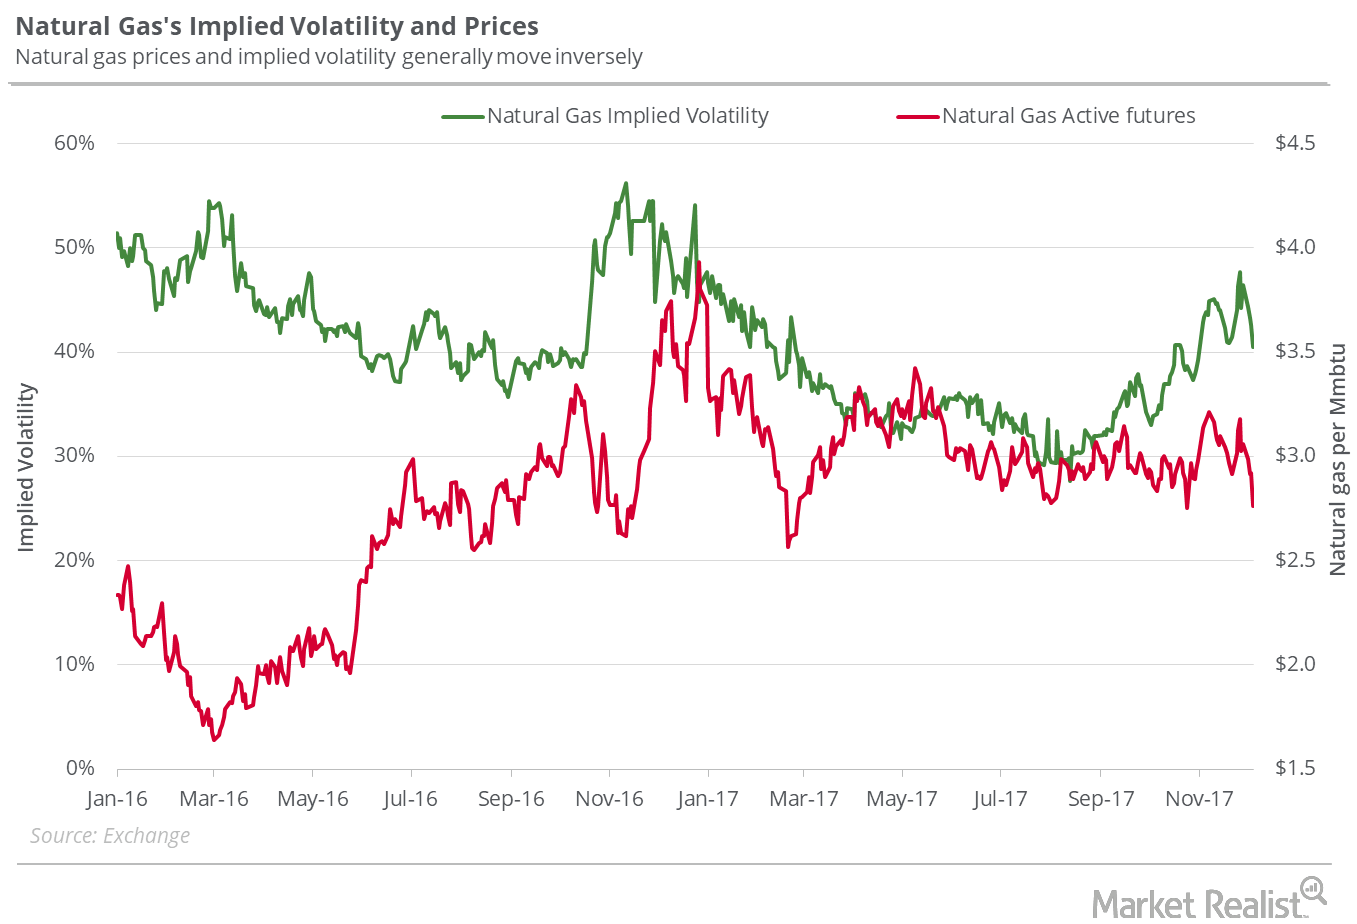
Possibilities for Natural Gas Prices Next Week
On December 7, 2017, natural gas’s implied volatility was 40.5% or ~7.5% less than its 15-day average. On November 29, the implied volatility rose to 47.7%.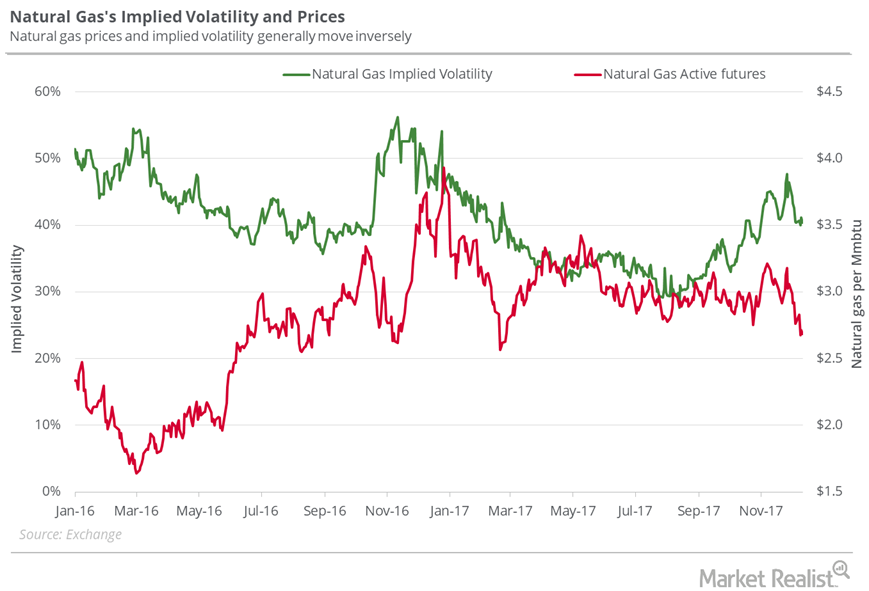
Could Natural Gas Hit a New 2017 Low Next Week?
On December 14, 2017, the implied volatility of natural gas futures was 40.4%. It was ~5.9% below its 15-day average.
Will Natural Gas Reclaim $3 Next Week?
On October 12, 2017, natural gas implied volatility was 35.9%, 1.7% above its 15-day average.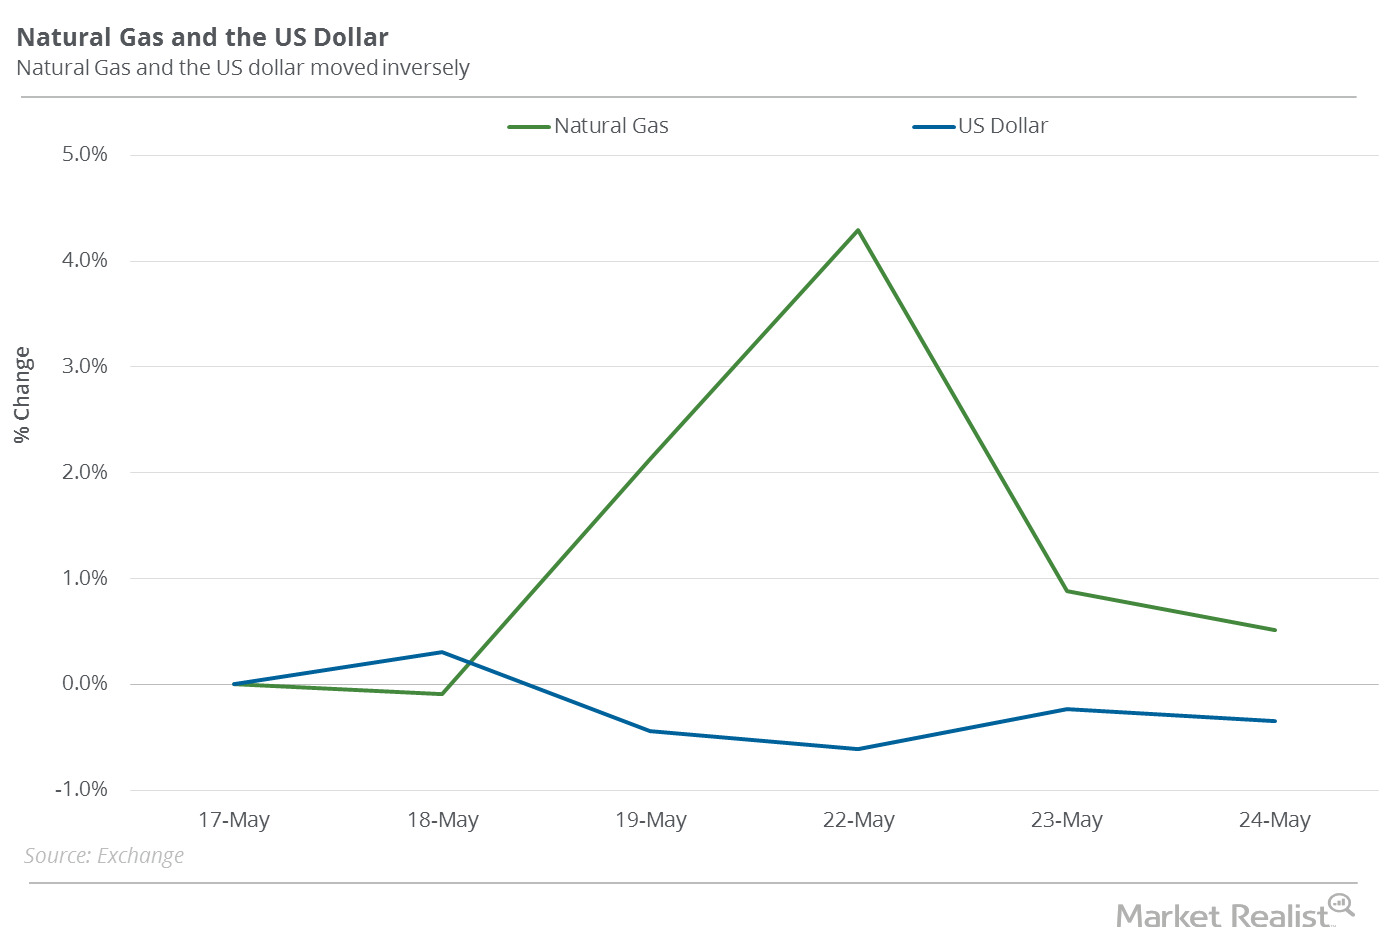
Recent Fall in the US Dollar: Crucial for Natural Gas?
Natural gas (GASX) (FCG) (GASL) July futures rose 0.5% on May 17–May 24, 2017. During this period, the US dollar (UUP) (UDN) (USDU) fell 0.3%.
Analyzing Gas-Heavy Stocks amid Falling Natural Gas Prices
From February 17–27, 2017, natural gas futures contracts for April 2017 delivery fell 8.8%. On March 3, 2016, natural gas futures touched a 17-year low.
Natural Gas Could Reach the $3.4 Mark Next Week
On November 9, 2017, natural gas had an implied volatility of 43.5%—9.4% more than its 15-day average. Natural gas active futures settled at $3.2 per MMBtu.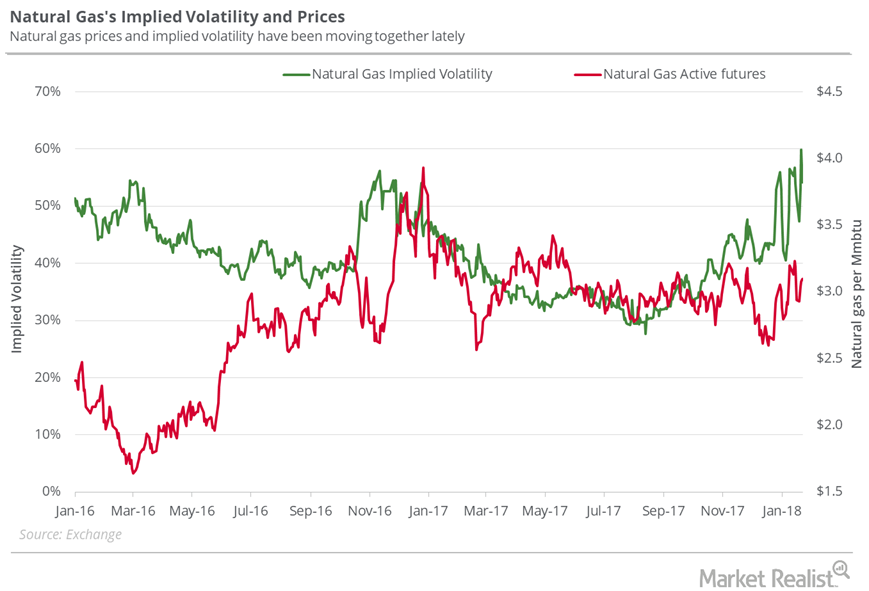
Where Could Natural Gas Prices Close Next Week?
On January 25, 2018, natural gas’s implied volatility was at 54.8%, 8% above its 15-day average.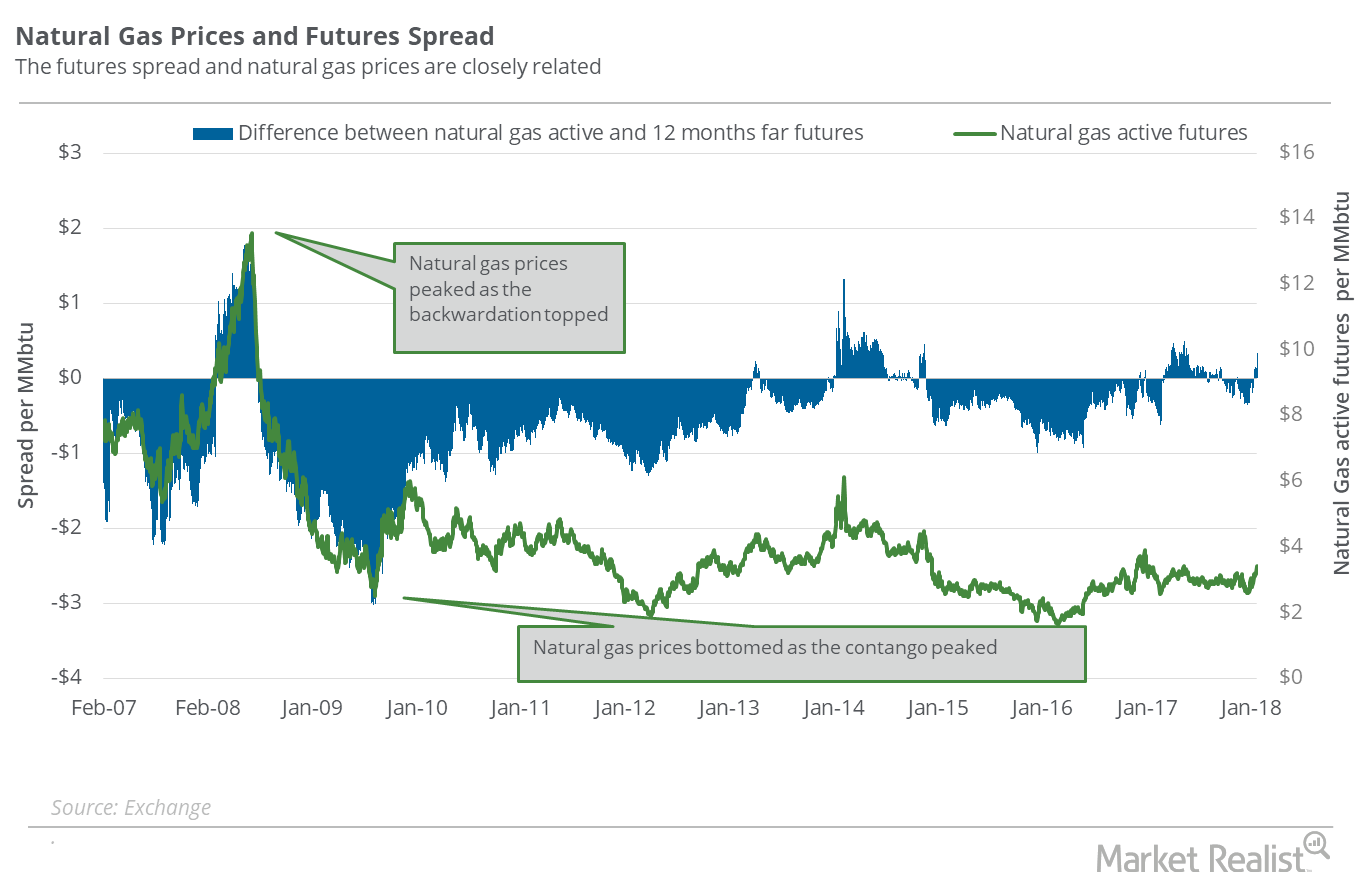
Is Natural Gas Pricing in Colder Weather?
On January 23, 2018, natural gas February 2018 futures settled $0.34 above February 2019 futures.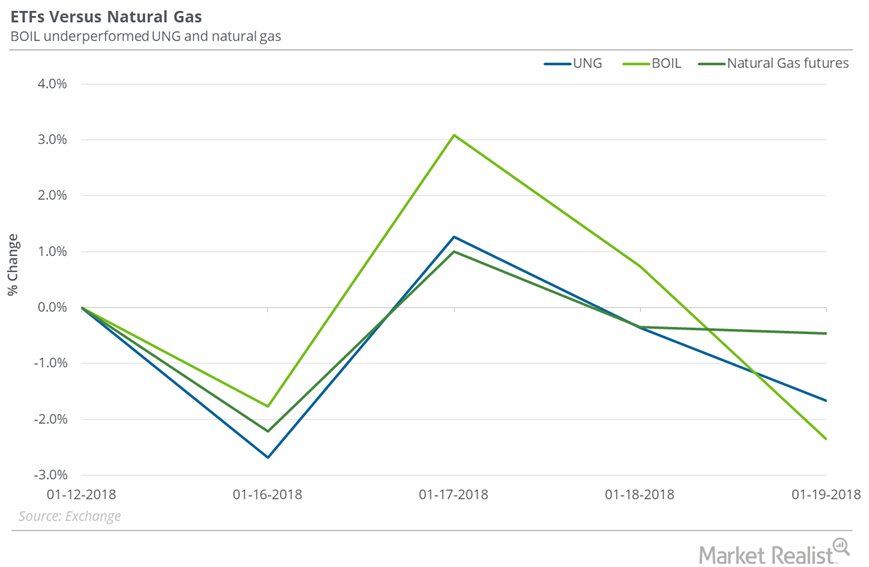
How Natural Gas ETFs Performed Last Week
Between January 12 and January 19, 2018, the United States Natural Gas ETF (UNG), an ETF that has exposure to natural gas futures, fell 1.7%.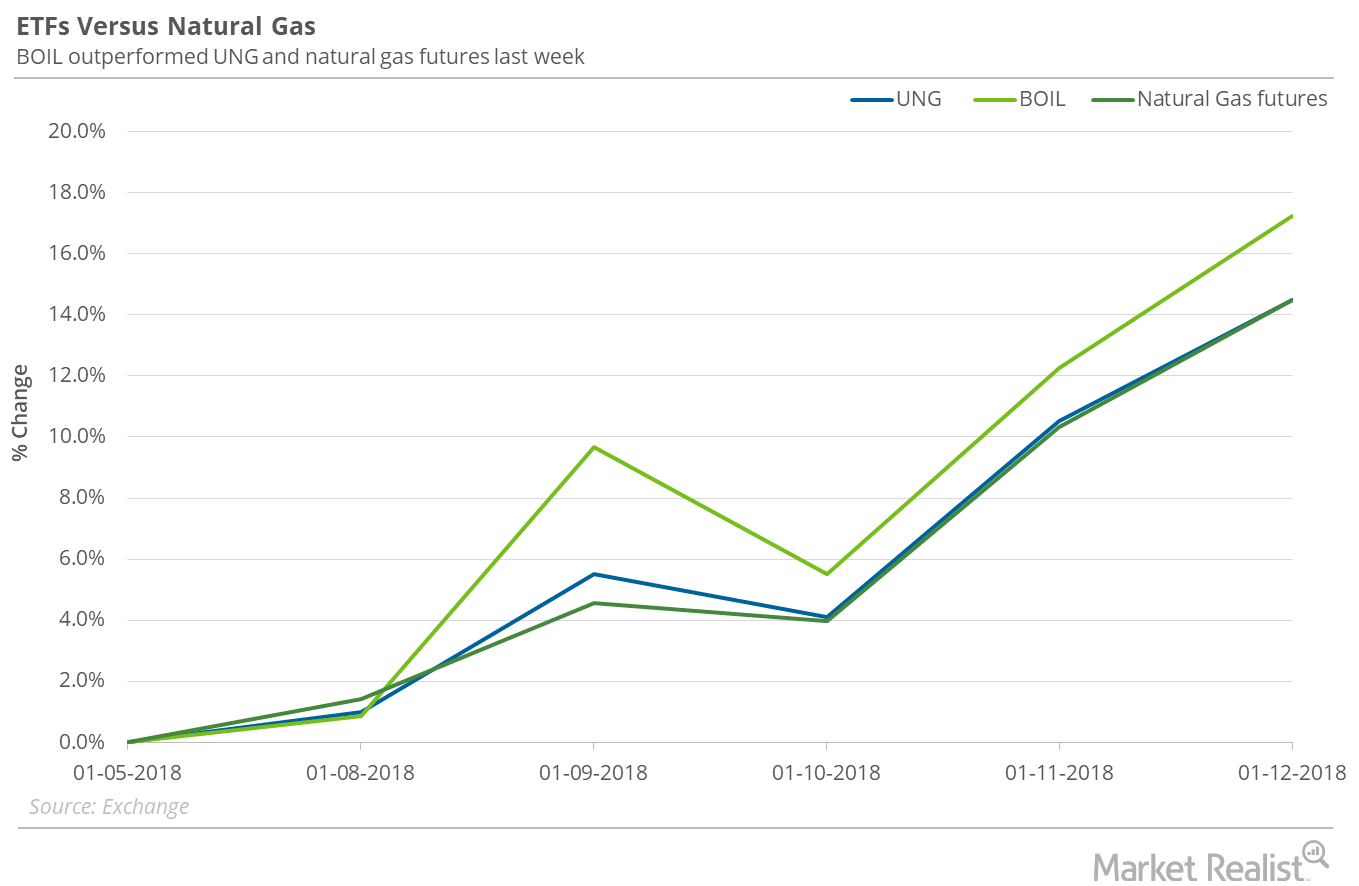
How Natural Gas ETFs Are Reacting to Spike in Natural Gas
Between January 5 and January 12, 2018, the United States Natural Gas ETF (UNG), which holds positions in active natural gas futures, gained 14.5%.
Is $3.30 Possible for Natural Gas Next Week?
On January 11, 2018, natural gas’s implied volatility was 49.1%. That’s 7% above its 15-day average.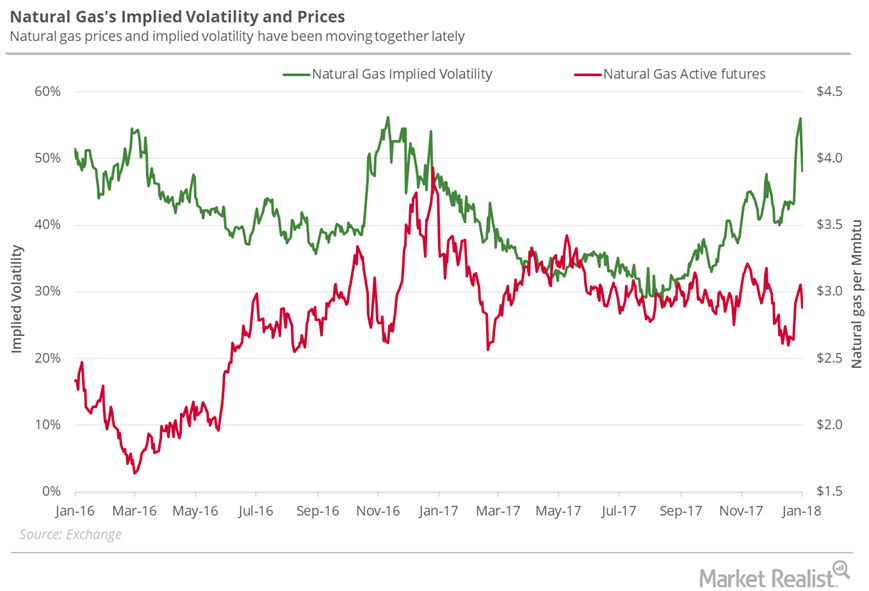
Possible Downside in Natural Gas Next Week
On December 21, 2017, natural gas prices closed at the lowest closing level since February 23, 2017. Since that day, natural gas futures have risen 11.1%.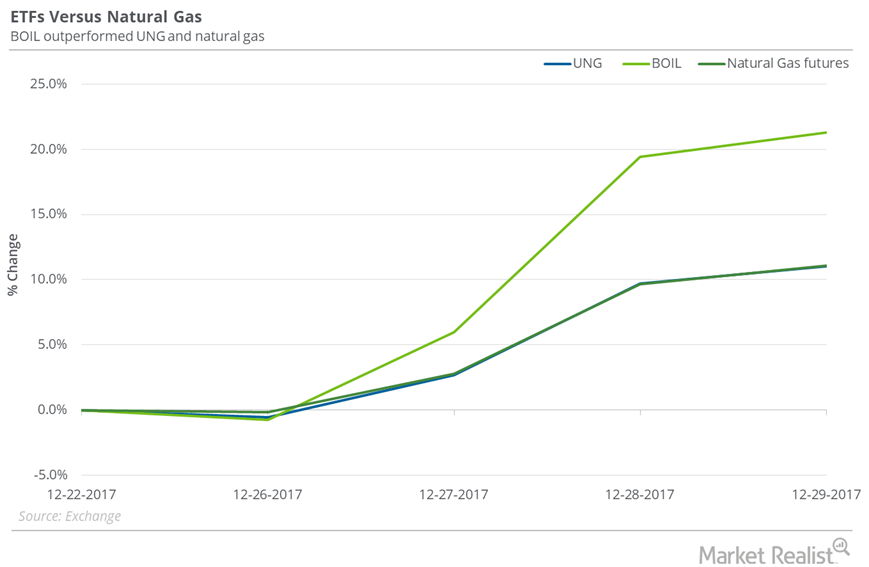
Natural Gas ETFs to Watch in 2018
On December 29, 2017, the closing prices of natural gas futures contracts between March 2018 and May 2018 were progressively lower.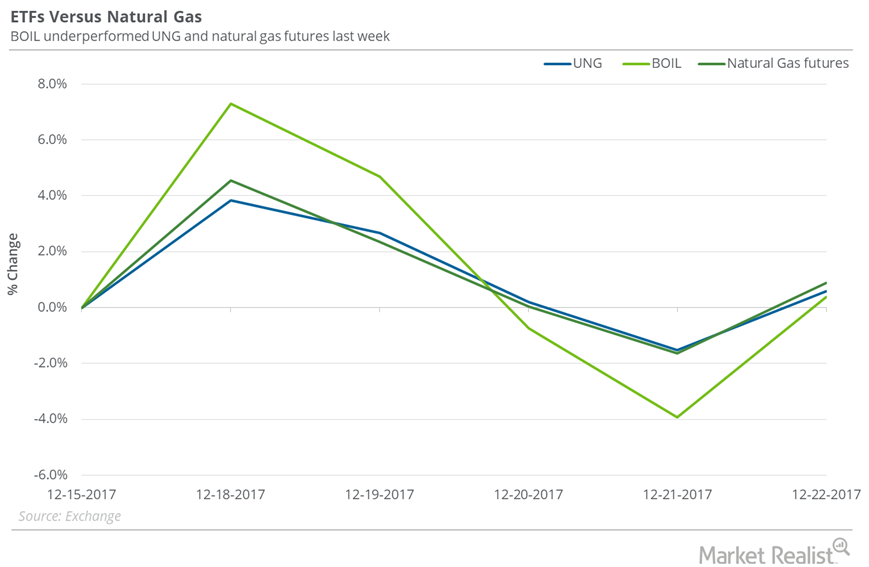
Natural Gas Returns and Natural Gas ETFs
From December 15–22, 2017, the United States Natural Gas Fund (UNG) rose 0.6%.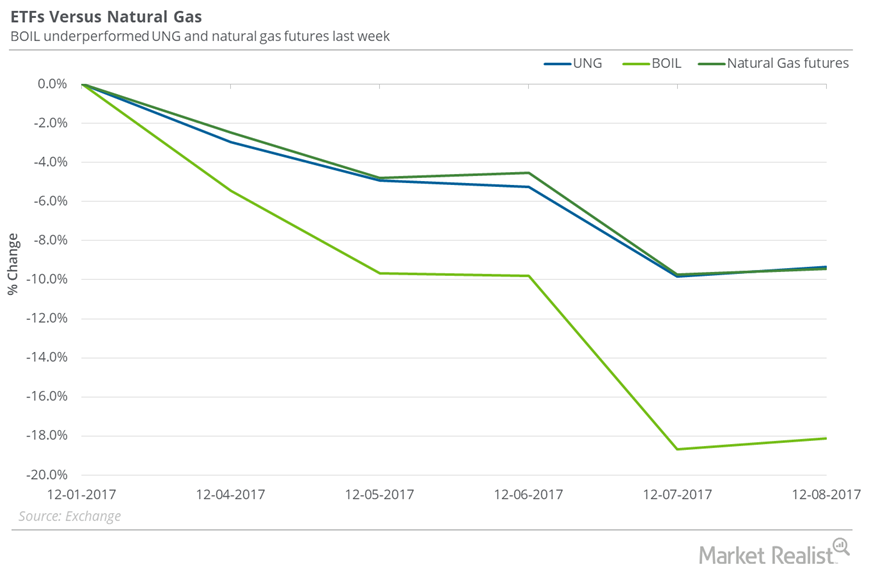
Natural Gas: Fall Impacts Natural Gas ETFs
On December 1–8, 2017, the United States Natural Gas Fund (UNG), which holds near-month natural gas futures contracts, fell 9.3%.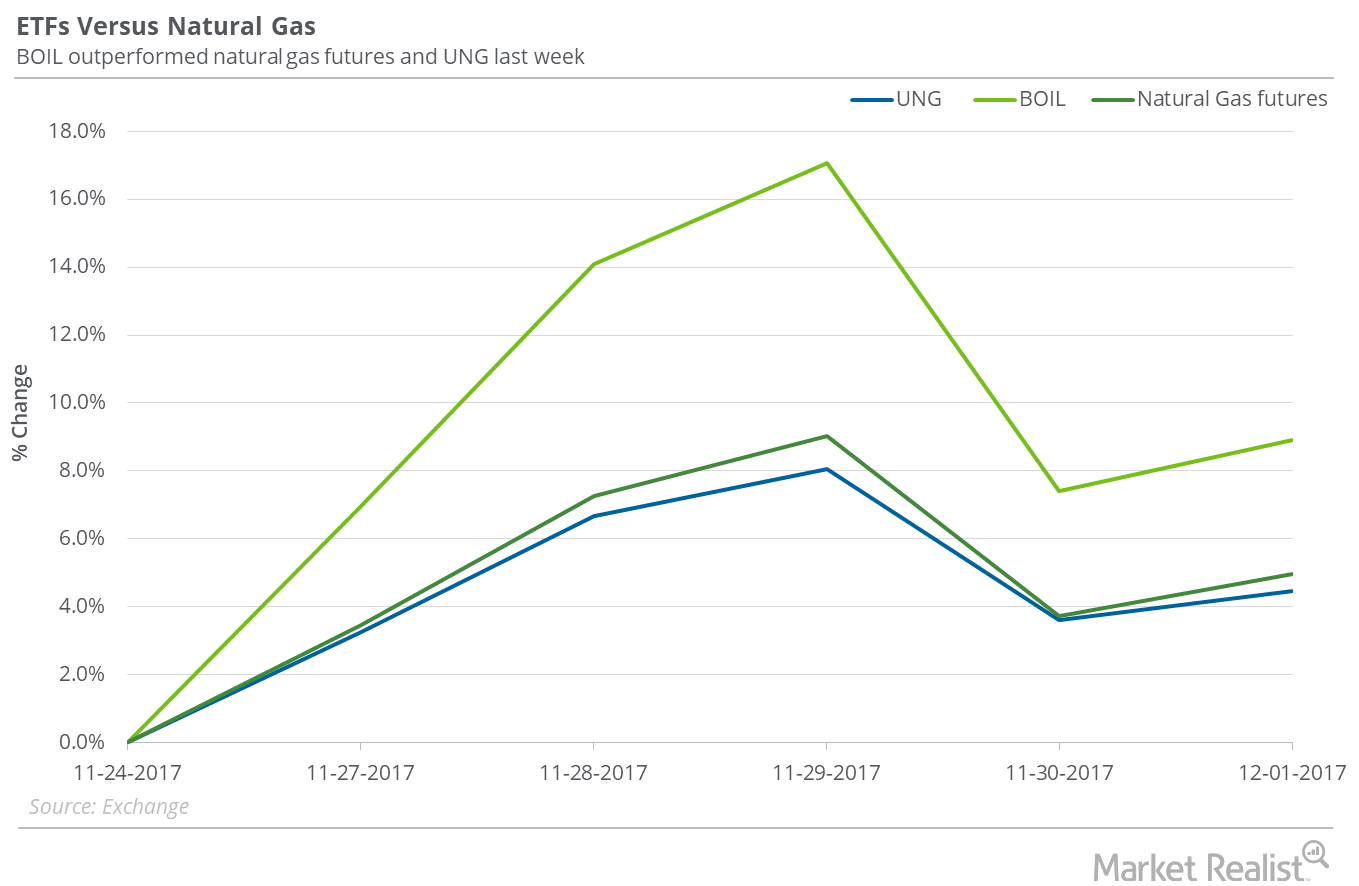
Rise in Natural Gas Impacts Natural Gas ETFs
On November 24–December 1, 2017, the United States Natural Gas Fund (UNG), that follows near-month natural gas futures contracts, rose 4.5%.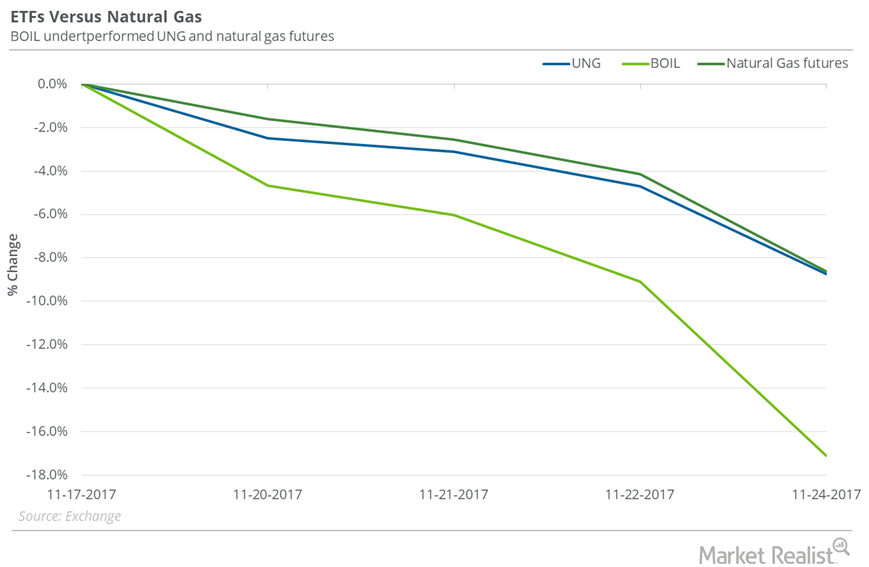
How Are Natural Gas ETFs Adjusting to Fall in Natural Gas Prices?
Between November 17 and November 24, 2017, the United States Natural Gas Fund LP (UNG) fell 8.8%.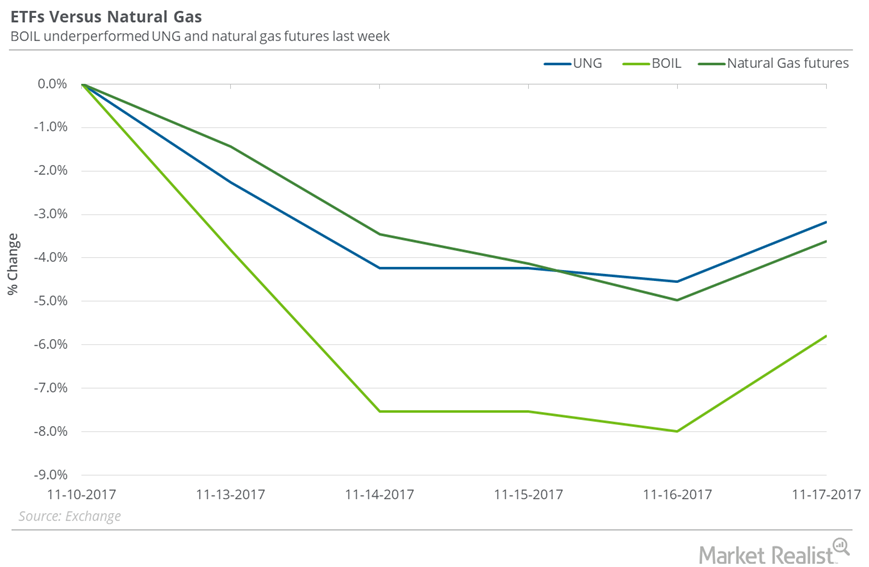
Are Natural Gas ETFs Doing Any Better than Natural Gas?
Between November 10 and November 17, the United States Natural Gas Fund LP (UNG) fell 3.2% while natural gas active futures fell 3.6%.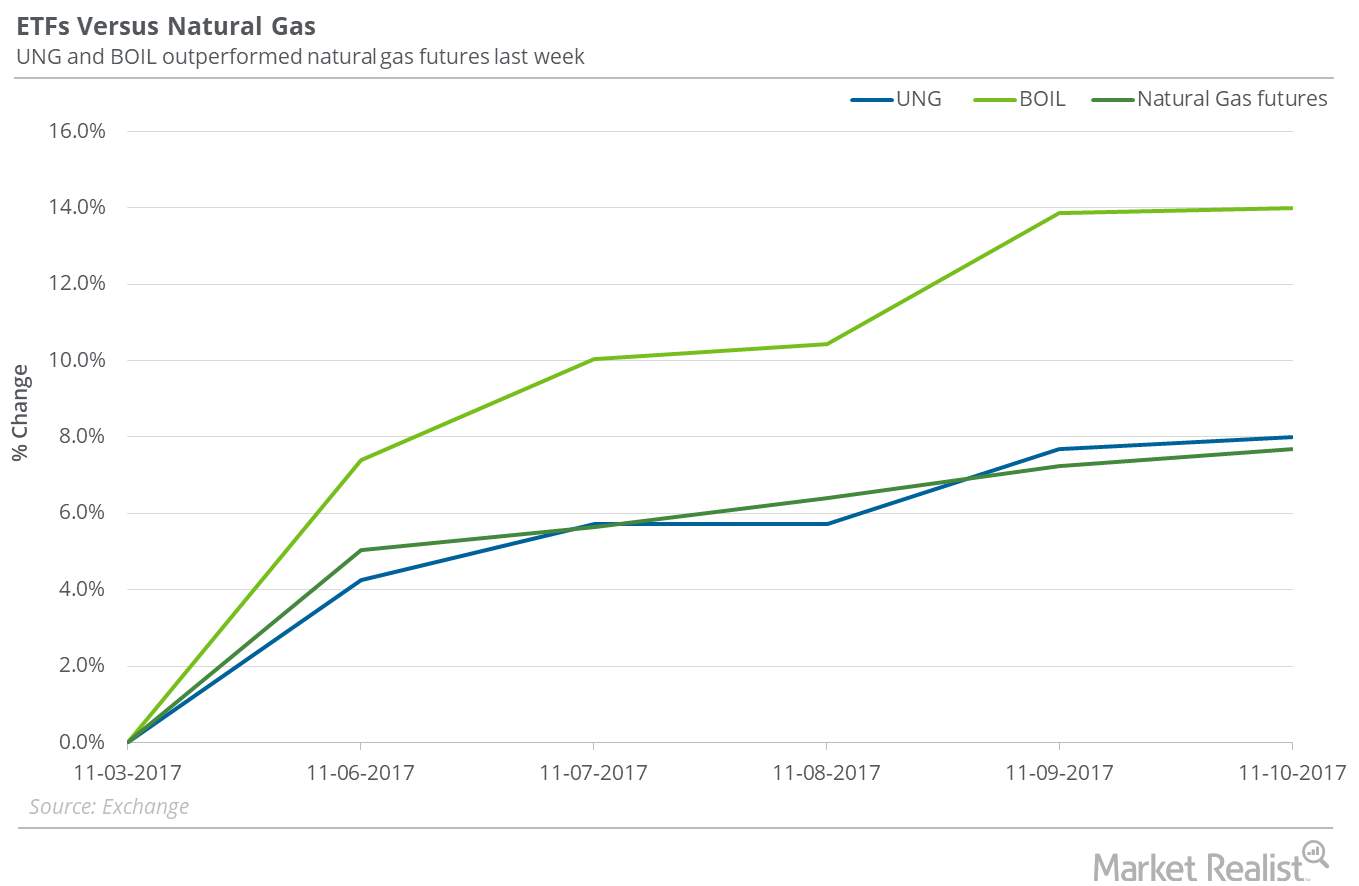
Did Natural Gas ETFs Outperform Natural Gas Last Week?
Between November 3 and November 10, 2017, the United States Natural Gas Fund LP (UNG) rose 8%, only 30 basis points above the gain in natural gas December futures.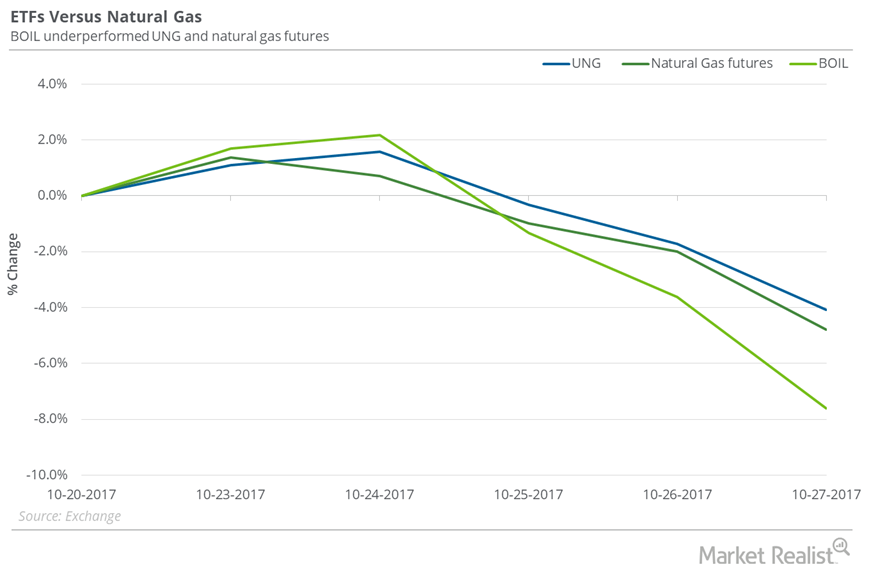
Natural Gas versus Natural Gas ETFs Last Week
On October 20–27, natural gas (FCG) (GASL) (GASX) December futures fell 4.8%. During this period, the United States Natural Gas Fund LP (UNG) fell 4.1%.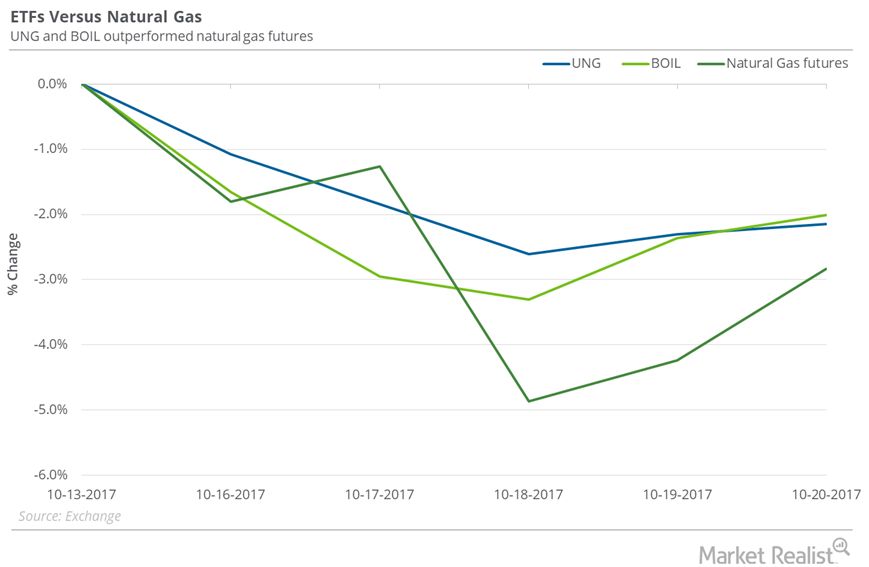
Where Natural Gas ETFs Stood next to Natural Gas Last Week
Between October 13 and October 20, 2017, the United States Natural Gas Fund LP (UNG) fell 2.2%, and natural gas November futures fell 2.8%.
Will Natural Gas Fall to $2.7 Levels Next Week?
On October 19, 2017, natural gas futures’ implied volatility was 38.8%, 9.6% above its 15-day average.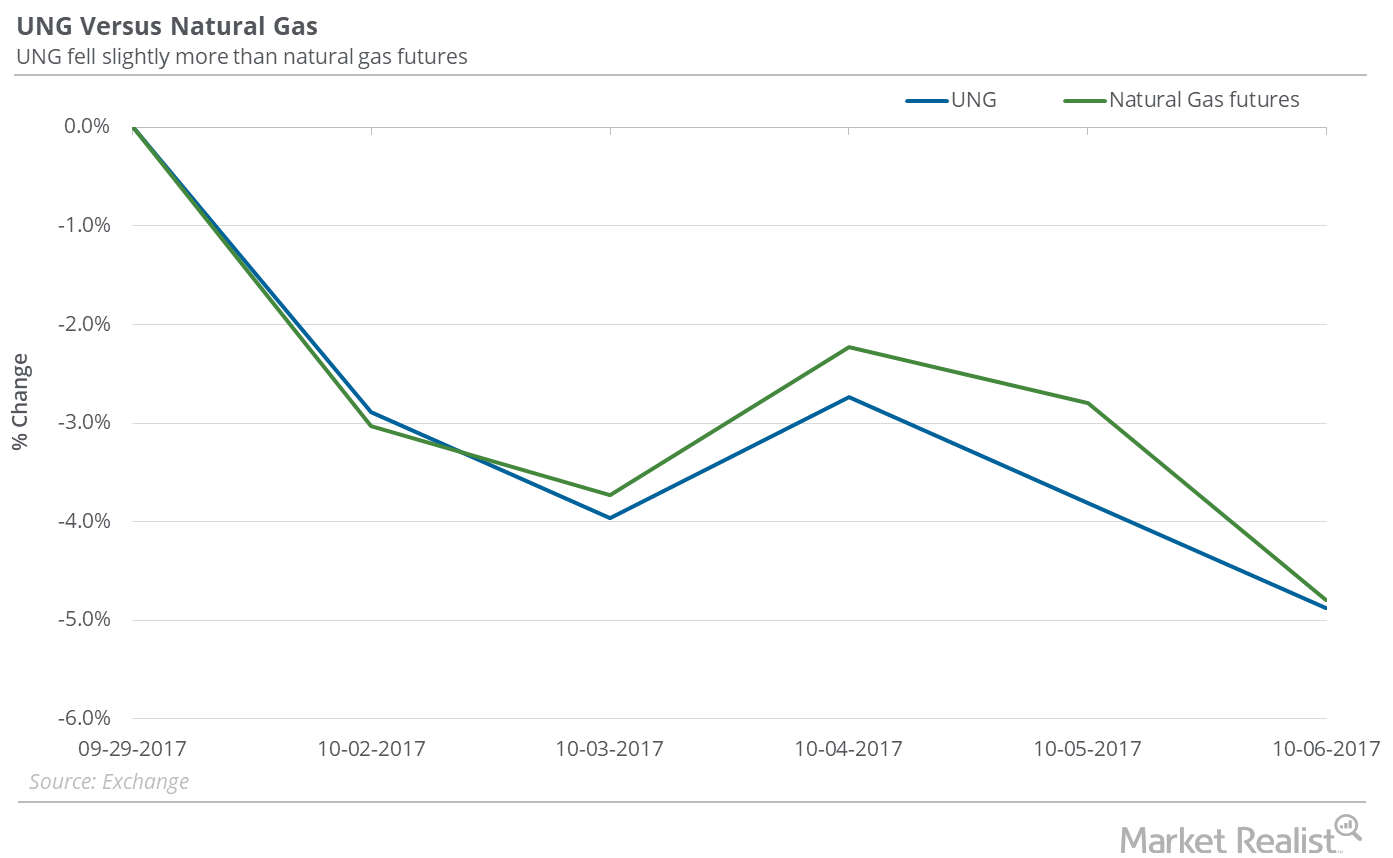
Did UNG Outperform Natural Gas in the Week Ended October 6?
Between September 29 and October 6, 2017, the United States Natural Gas Fund ETF (UNG) fell 4.9%, while natural gas (BOIL) (GASX) November futures fell 4.8%.
Could Natural Gas Fall below the $2.8 Mark Next Week?
On October 5, 2017, the implied volatility of US natural gas active futures was at 33.1%, or 7.3% below the 15-day average.
How UNG Fared Compared to Natural Gas Last Week
On September 22–29, 2017, the United States Natural Gas Fund LP (UNG) rose 0.2%, while natural gas (BOIL) November futures fell 0.5%.
Natural Gas Could Regain the $3 Mark Next Week
In the next seven days, natural gas October futures could close between $2.85 and $3.11 per MMBtu (million British thermal units).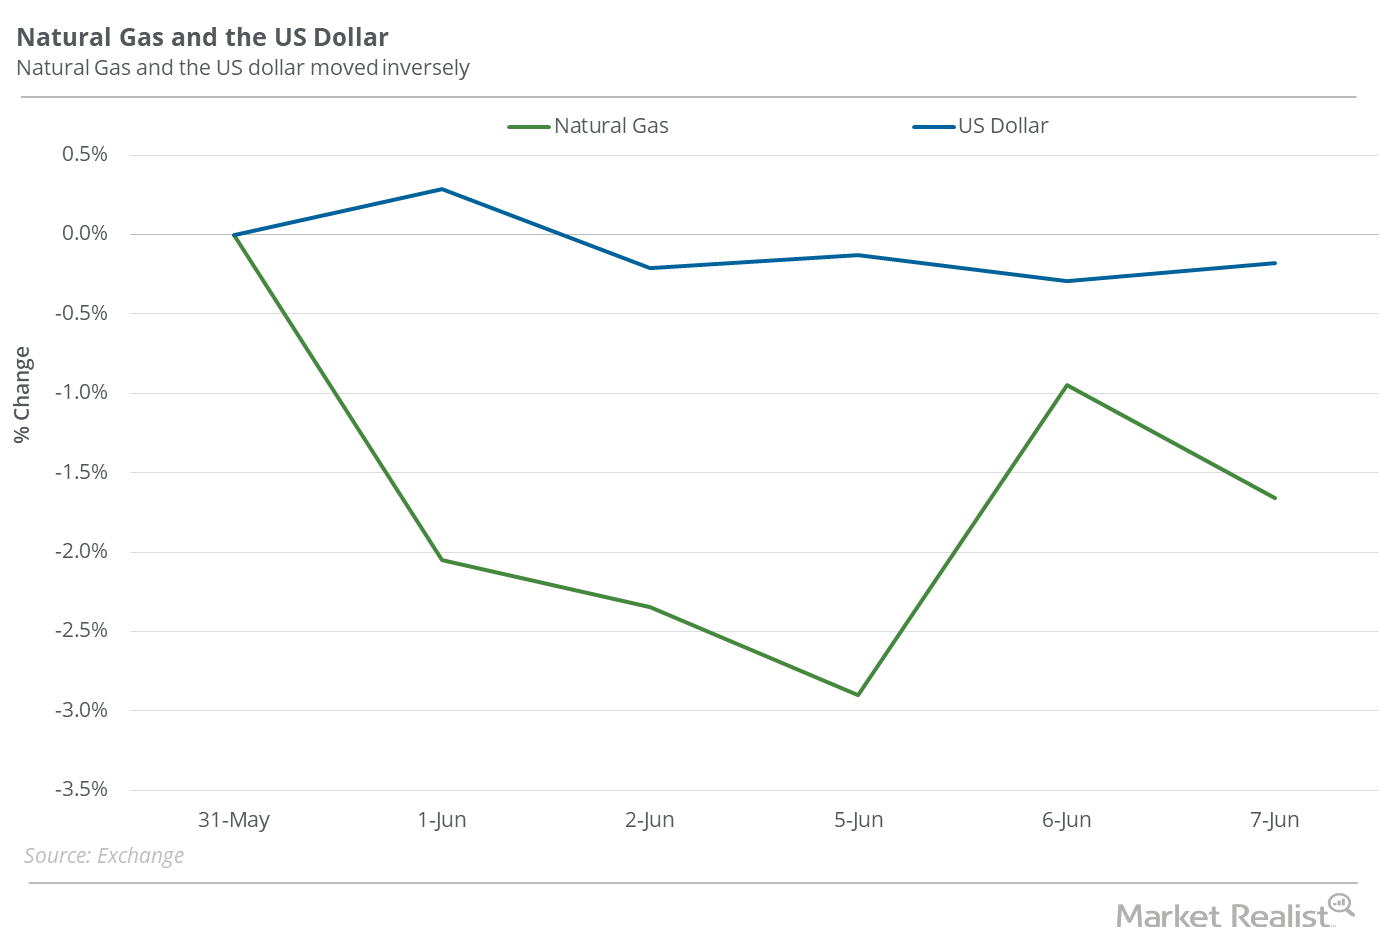
Is Natural Gas Reacting to the US Dollar?
Between March 3, 2016–June 7, 2017, natural gas active futures rose 84.1% while the US dollar fell 0.8%.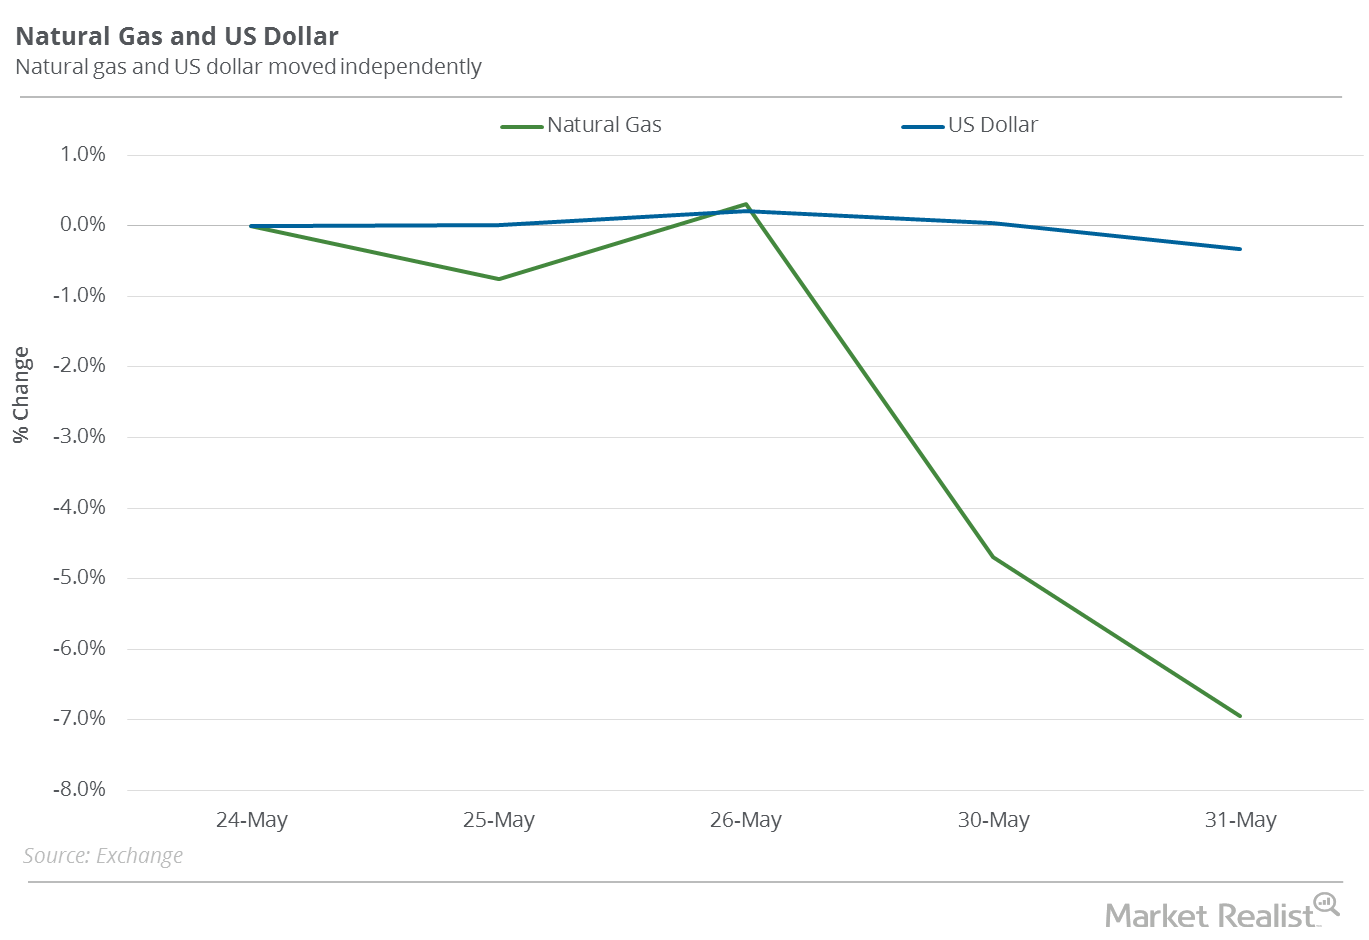
Is the US Dollar a Factor in Natural Gas’s Current Downturn?
The US dollar (UUP) (UDN) (USDU) fell 0.3% between May 24 and May 31, 2017.
Inventories Spread: Will Natural Gas Prices Fall Again?
Natural gas (GASX) (FCG) (GASL) inventories rose by ten Bcf (billion cubic feet) during the week ending April 7, 2017.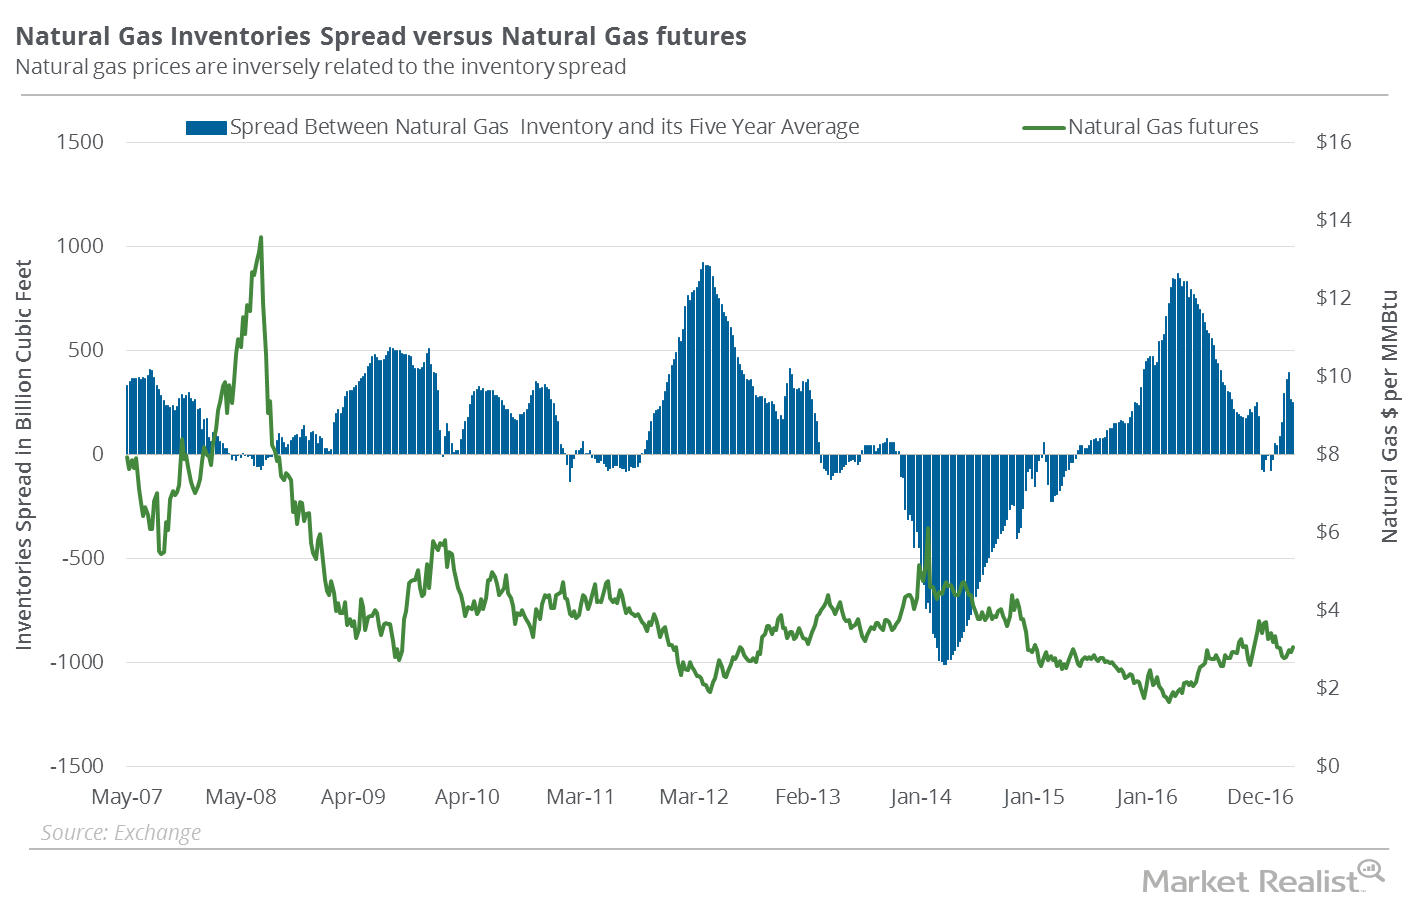
Inventories Spread: Why Natural Gas Uptrend Could Be at Risk
According to data from the EIA (U.S. Energy Information Administration) released on March 30, 2017, natural gas inventories fell by 43 Bcf (billion cubic feet) during the week ending March 24, 2017.