Gulfport Energy Corp
Latest Gulfport Energy Corp News and Updates
Behind the Natural Gas Rig Count: Will Production Rise?
The natural gas rig count rose by four to 187 in the week ended September 8, 2017. On a YoY basis, the natural gas rig count more than doubled that week.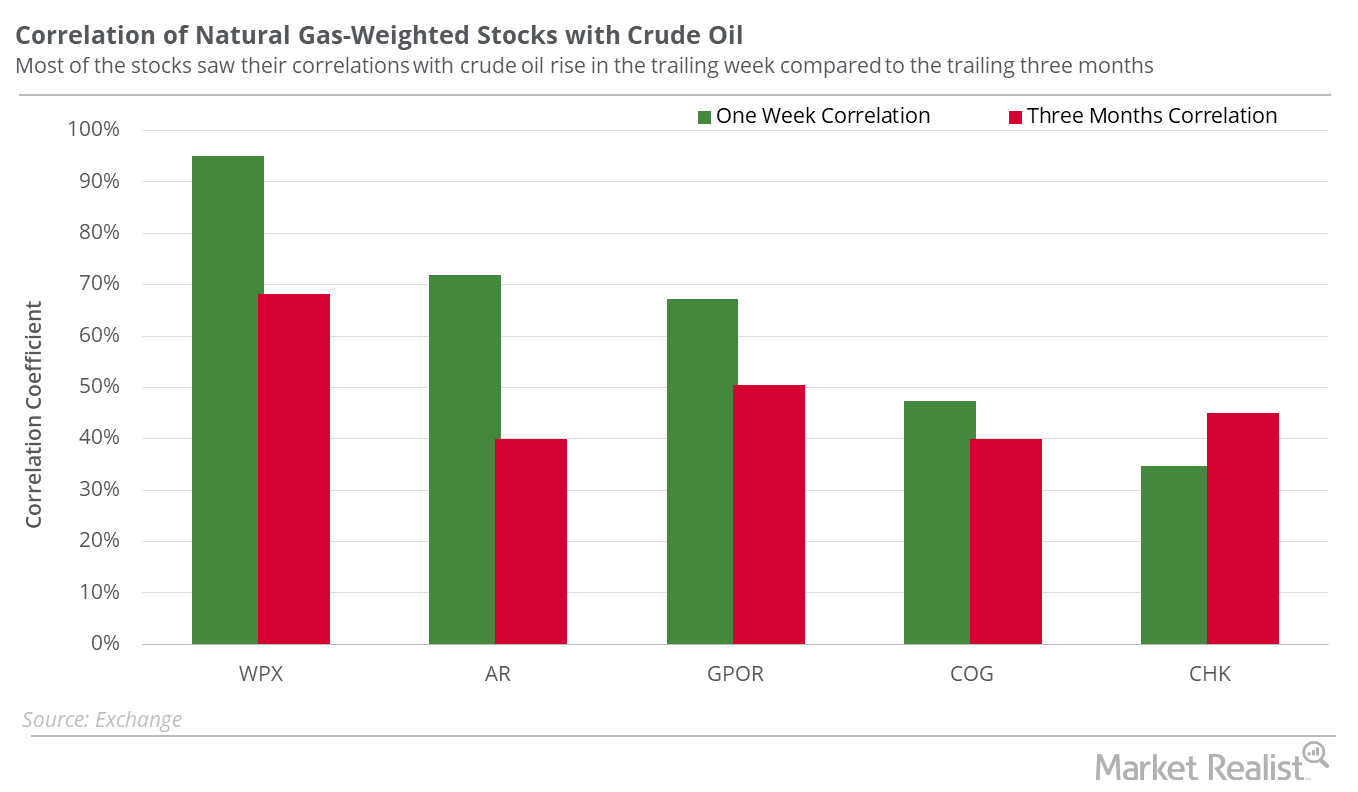
Which Natural Gas–Weighted Stocks Could Follow Oil?
WPX Energy had the lowest correlation with natural gas prices in the past five trading sessions. Southwestern Energy had among the highest correlations.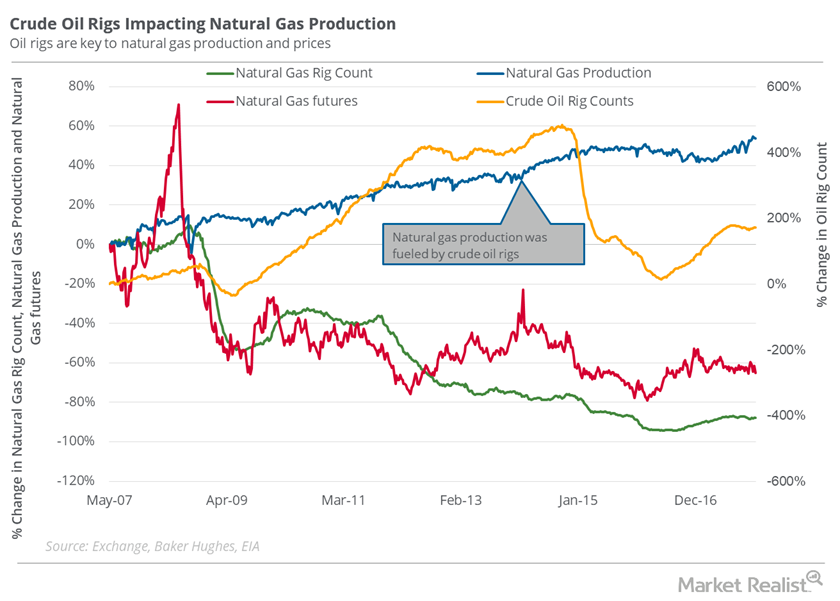
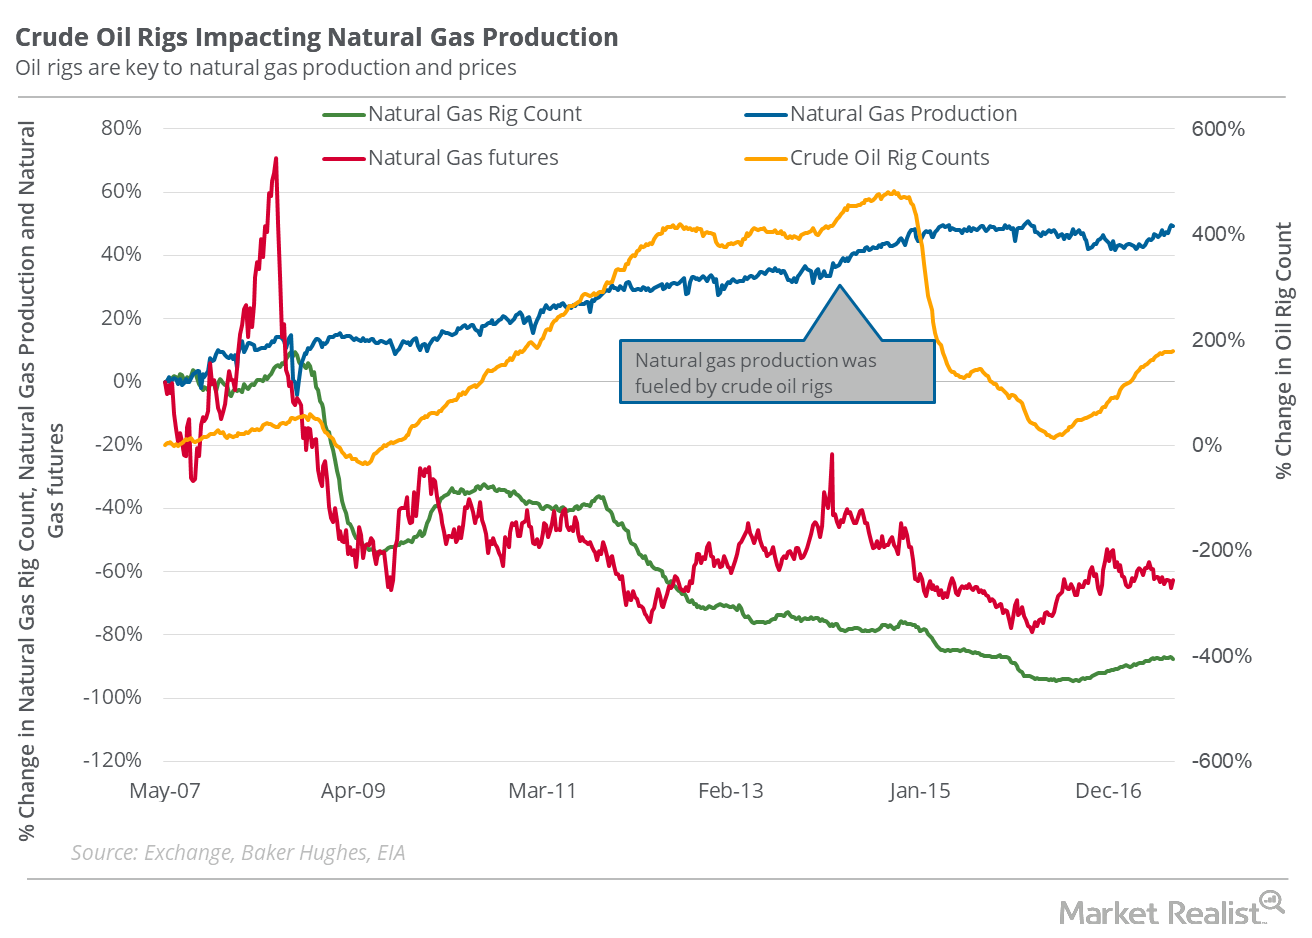
Natural Gas Traders Should Stay Cautious of Oil Rigs
On December 29, the natural gas rig count was 88.7% below its record high of 1,606 in 2008. However, natural gas supplies have risen drastically since 2008.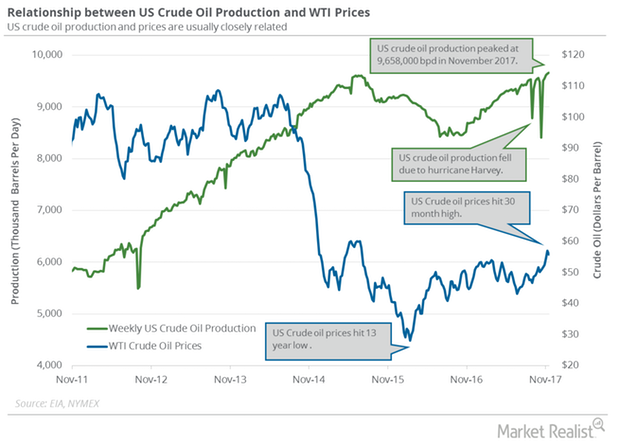
Why US Crude Oil Production Could Hit a Record High in 2018
US crude oil production According to the EIA (U.S. Energy Information Administration), US crude oil production rose 13,000 bpd (barrels per day) to 9,658,000 bpd between November 10 and 17, 2017. Production, which rose for the fifth straight week, has been pressuring oil (SCO) prices in the last few weeks. Production has risen 977,000 bpd (11.3%) year-over-year. Any […]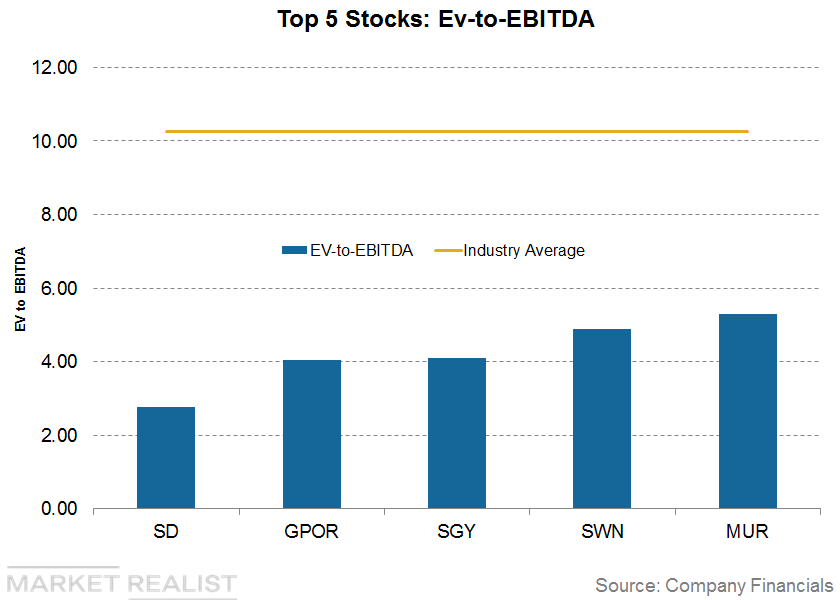
Upstream Companies with the Lowest EBITDA Multiples
As of the first quarter, Sandridge Energy’s (SD) EV-to-adjusted EBITDA ratio was ~2.77x. The company has a market capitalization of $529.83 million.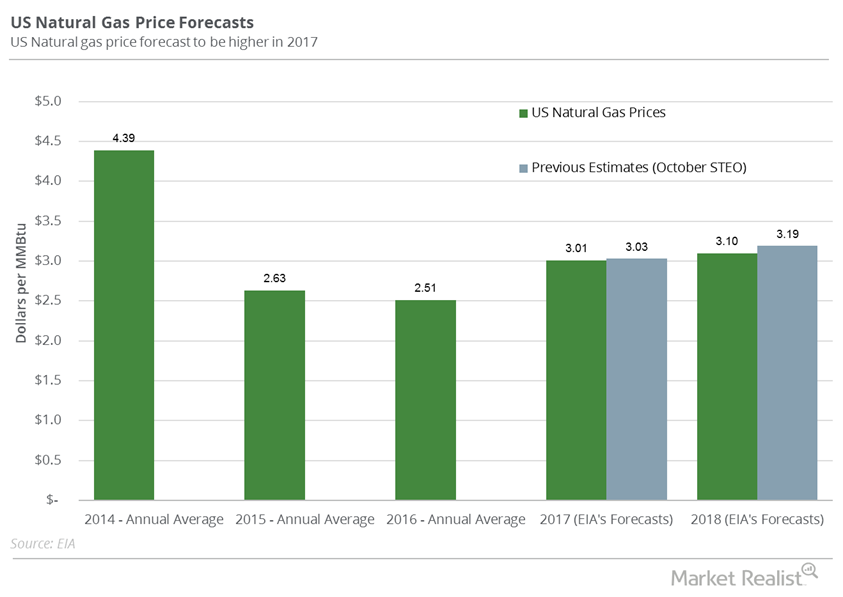
Hedge Funds: Bullish or Bearish on Natural Gas?
Aegent Energy Advisors predicts that US natural gas prices might not exceed $3.18 per MMBtu by December 2017.
Analyzing Gas-Heavy Stocks amid Falling Natural Gas Prices
From February 17–27, 2017, natural gas futures contracts for April 2017 delivery fell 8.8%. On March 3, 2016, natural gas futures touched a 17-year low.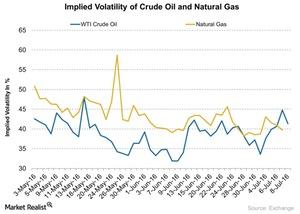
What Are the Implied Volatilities of Crude Oil and Natural Gas?
Crude oil’s (USO) (OIIL) implied volatility was 41.3% on July 8, 2016.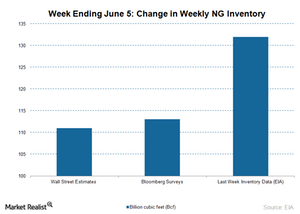
Natural Gas Prices Could Overshadow the Increasing Stockpile Data
The EIA will publish the weekly natural gas in storage report on June 11. US commercial natural gas inventories rose by 132 Bcf for the week ending May 29.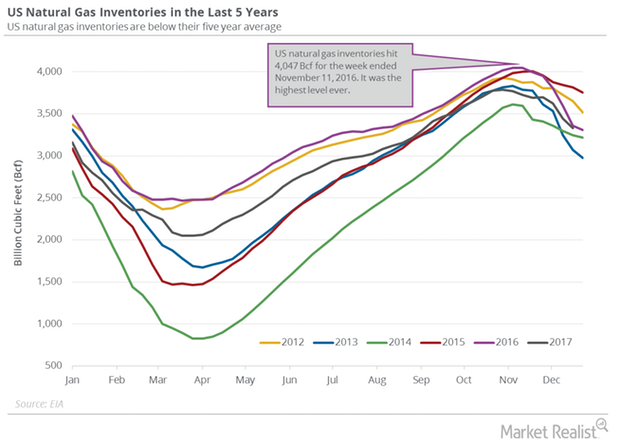
Natural Gas Inventories Could Help US Natural Gas Prices
A larger-than-expected withdrawal in US natural gas inventories compared to historical averages would help natural gas prices this week.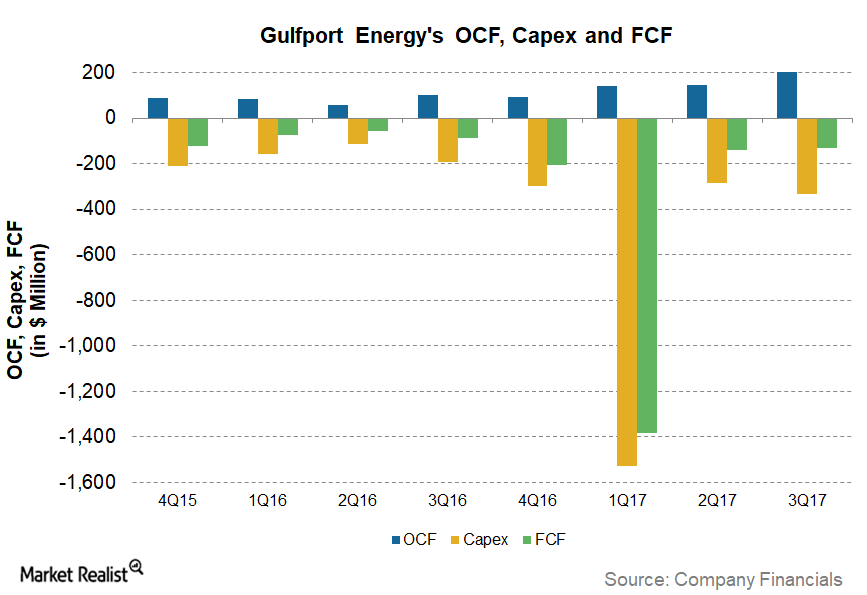
Is Gulfport Energy’s Normalized Free Cash Flow Trending Up?
For 9M17 (the first nine months of 2017), Gulfport Energy (GPOR) had normalized FCF (free cash flow) of -336%, the fourth lowest among the upstream producers we have been tracking.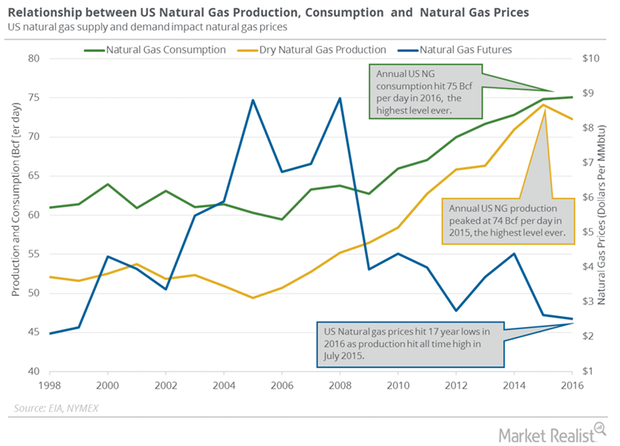
EIA Upgrades US Natural Gas Production for 2018
US dry natural gas production was flat at 76.1 Bcf (billion cubic feet) per day on December 7–13, 2017, according to PointLogic.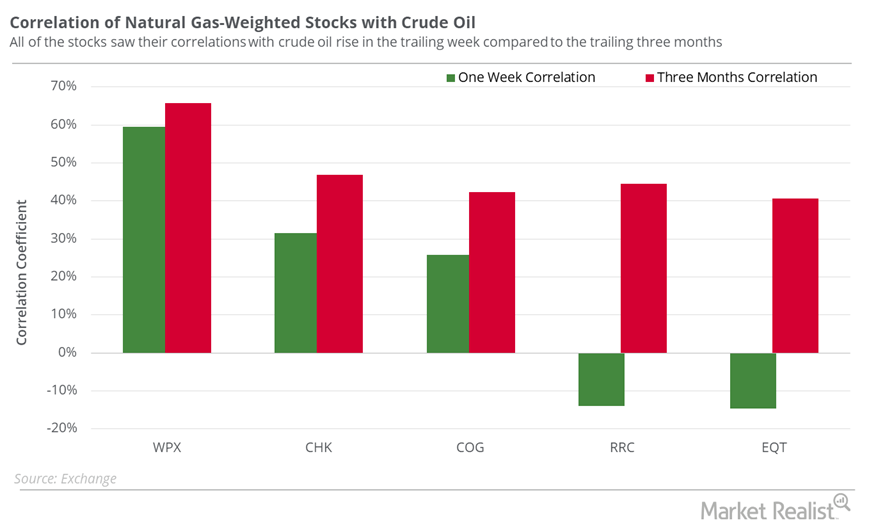
Which Natural Gas–Weighted Stocks Could Take Cues from Oil?
Antero Resources (AR) and Gulfport Energy (GPOR) are among the natural gas–weighted stocks that had the highest correlations with natural gas prices in the trailing week.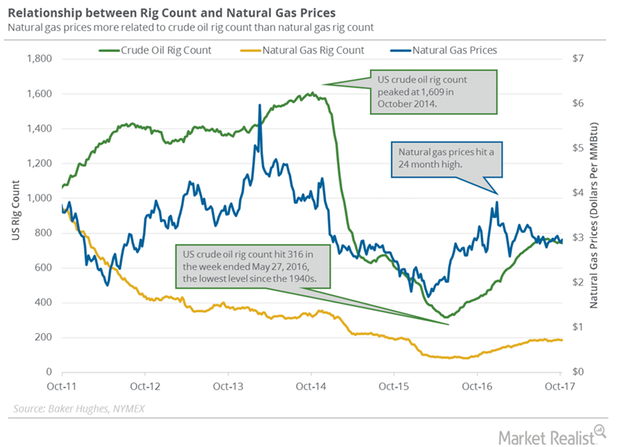
US Gas Rigs Hit 5-Month Low: Good or Bad for Natural Gas Futures?
Baker Hughes is scheduled to release its weekly US oil and gas rig report on October 27, 2017.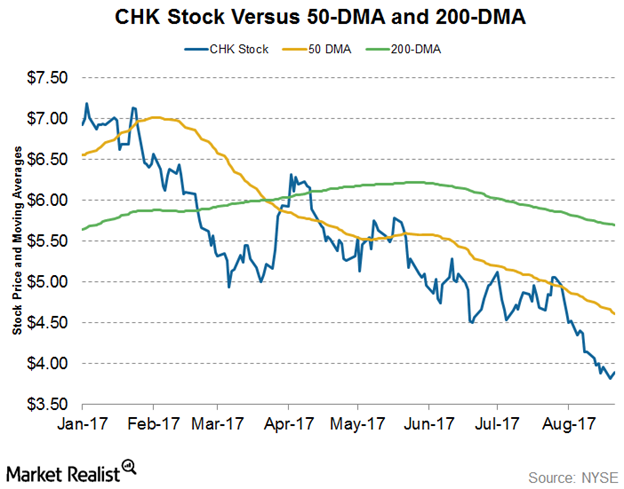
Can Chesapeake Energy Stock Rise from the Doldrums?
Chesapeake Energy stock (CHK) has fallen for most of this year. It picked up slightly in April but wasn’t able to hold those levels.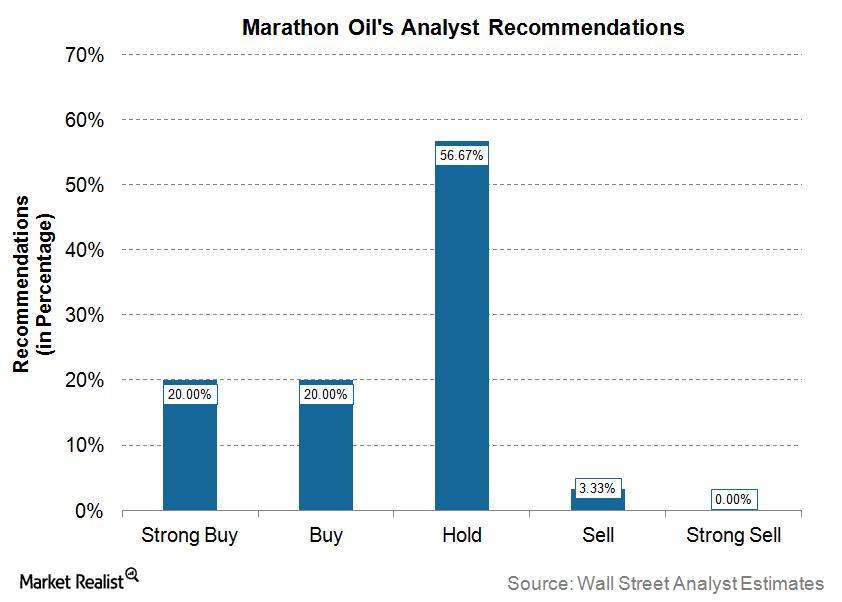
What Are Analysts Saying about Marathon Oil?
Recommendations Currently, 30 analysts cover Marathon Oil (MRO). They’ve given six “strong buy,” six “buy,” 17 “hold,” and one “sell” recommendation on the stock. There were no “strong sell” recommendations. Target price Analysts’ median target price for MRO is $20, which is ~25% higher than the closing price of $16.05 on February 9, 2017. The mean […]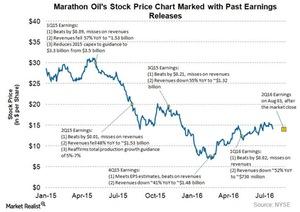
How Marathon Oil’s Stock Has Reacted to Past Earnings Reports
After losing ~84% of its market capitalization between September 2014 and February 2016, Marathon Oil’s stock price has begun to show signs of new uptrends.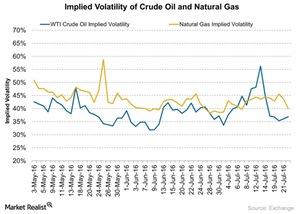
How Volatile Are Natural Gas and Crude Oil?
Natural gas’s (UNG) (GASL) (GASX) implied volatility was 40.0% on July 22, 2016. Its 15-day average implied volatility is 42.5%.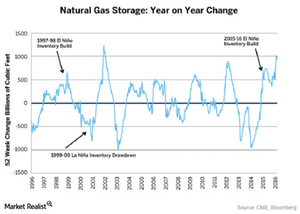
How Do El-Niño and La-Nina Impact Natural Gas Prices?
When El-Niño occurs, it keeps the sea surfaces warmer. This causes milder-than-normal cold temperatures across the sea and some parts of the US.