Can Chesapeake Energy Stock Rise from the Doldrums?
Chesapeake Energy stock (CHK) has fallen for most of this year. It picked up slightly in April but wasn’t able to hold those levels.
Aug. 25 2017, Updated 3:36 p.m. ET

Chesapeake’s moving averages
Chesapeake Energy stock (CHK) has fallen for most of this year. It picked up slightly in April but wasn’t able to hold those levels and resumed its falling streak.
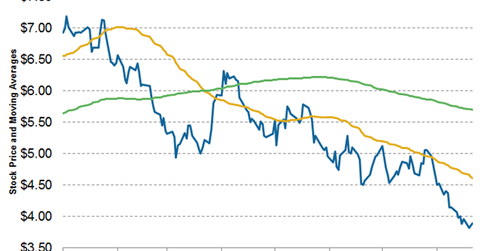
As you can see in the graph below, the stock has mostly traded below its 50-DMA (day moving average) so far this year. There were some spikes in CHK stock this year, but they were short-lived. For some of these short durations, CHK stock was trading above its 50-DMA.
However, on August 24, 2017, CHK was trading 15.6% below its 50-DMA.
Like its 50-DMA, CHK stock was mostly trading under its 200-DMA this year. In the first half of 2017, CHK’s 200-DMA was trading below its 50-DMA. In the second half of this year, however, CHK’s 200-DMA has been trading above its 50-DMA. On August 24, 2017, CHK was trading ~32.0% below its 50-DMA.
Usually, when a stock’s 50-DMA is trading above its 200-DMA, it’s considered a positive sign.
CHK and its peers
As we saw in Part 1 of this series, CHK stock has fallen 44.0% year-to-date. In comparison, Noble Energy (NBL) fell ~38.7%, and WPX Energy (WPX) fell ~34.0%. Gulfport Energy (GPOR) fell ~42.3% during the same period. All these companies make up ~1.6% of the iShares North American Natural Resources (IGE).
We’ll talk about analysts’ forecasts for CHK for the next 12 months in the next part.
