EXCO Resources Inc
Latest EXCO Resources Inc News and Updates
Will US Natural Gas Futures Fall More?
US natural gas (GASL) futures contracts for January delivery were below their 20-day, 50-day, and 100-day moving averages on December 14, 2017.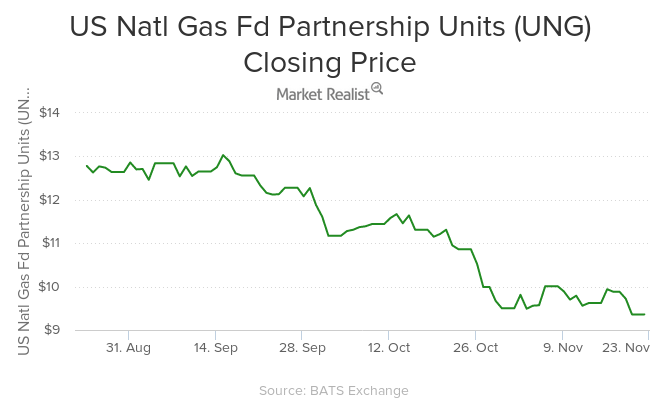
Natural Gas Prices Slump 9.4% for the Week
ETFs like the United States Natural Gas—UNG—ETF fell in the direction of natural gas prices on November 20, 2015. UNG fell by 4.7% on the day.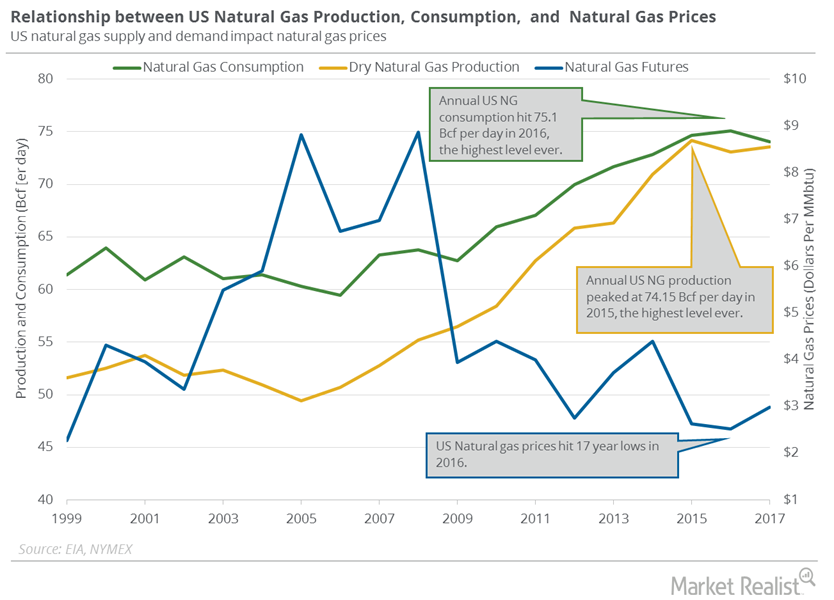
US Natural Gas Consumption Could Hit a Record in 2018 and 2019
US natural gas consumption fell 14.4% to 102.6 Bcf (billion cubic feet) per day on January 4–10, 2018, according to PointLogic.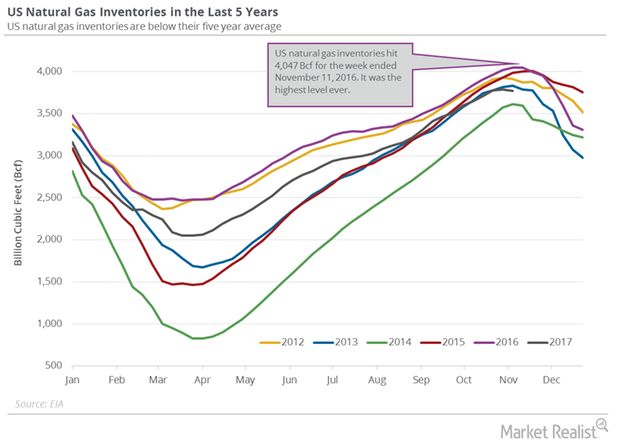
Traders Are Tracking US Natural Gas Inventories
The EIA reported that US gas inventories fell by 18 Bcf (billion cubic feet) to 3,772 Bcf on November 3–10, 2017.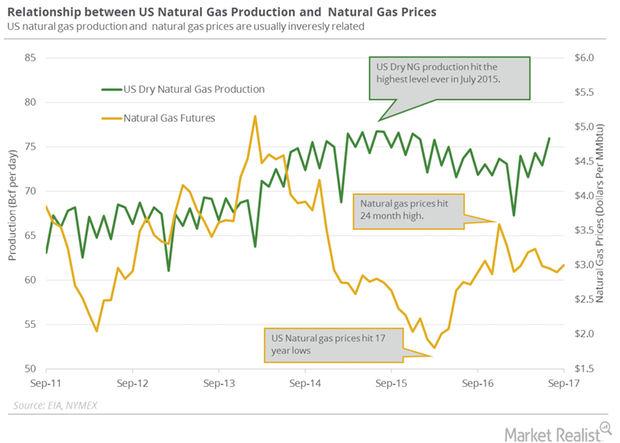
Is US Natural Gas Production Bearish for Natural Gas?
US dry natural gas production will likely average ~73.6 Bcf/d in 2017. It will likely rise by 4.9 Bcf/d or 6.6% to 78.5 Bcf/d in 2018.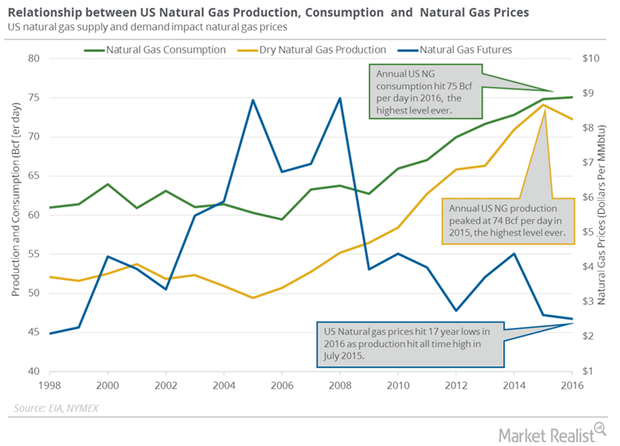
Will US Natural Gas Consumption Outweigh Production?
PointLogic estimates that weekly US natural gas consumption fell 6.6% to 52 Bcf per day from September 7 to 13. Consumption fell 13% year-over-year.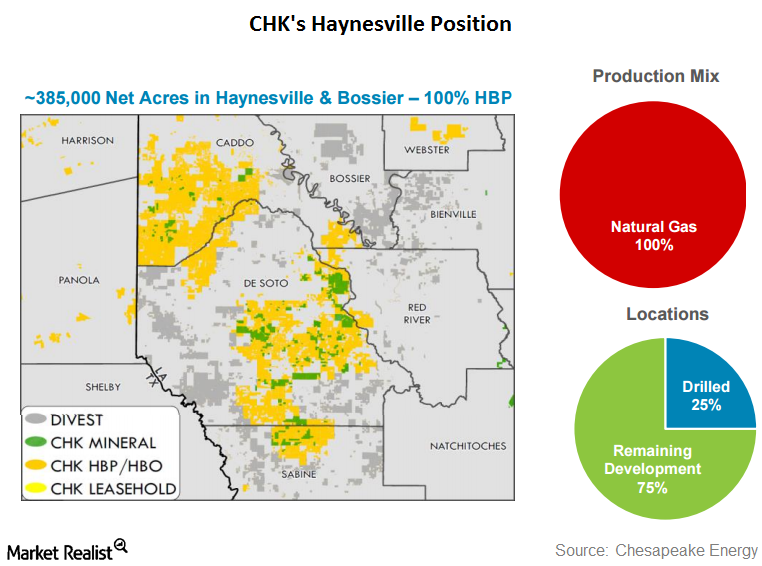
Chesapeake Energy Announces Haynesville Asset Divestiture
Chesapeake Energy (CHK) announced on December 5 that it had agreed to sell 78,000 net acres in Louisiana’s Haynesville Shale for $450 million. The buyer is an undisclosed private player.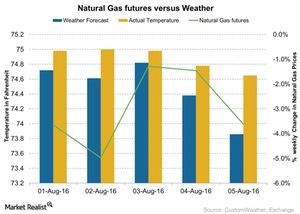
How Weather Could Impact Natural Gas Prices
In the week ended August 5, 2016, temperatures were higher than the forecast for the week. That boosted natural gas prices on August 3.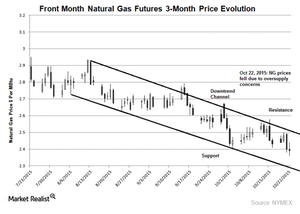
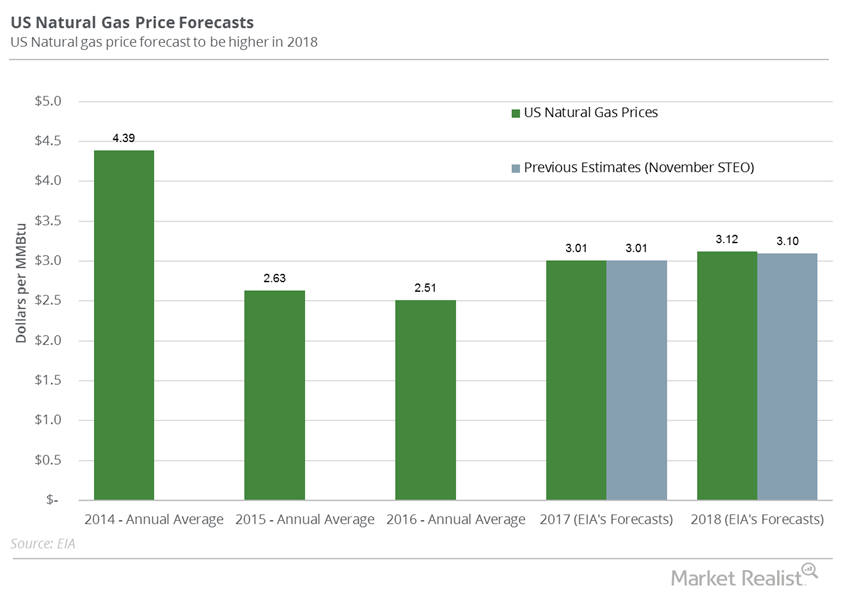
Will Natural Gas Prices Hit New Lows?
Cold winter weather could drive natural gas prices higher. But on the other hand, record natural gas stocks will push natural gas prices lower.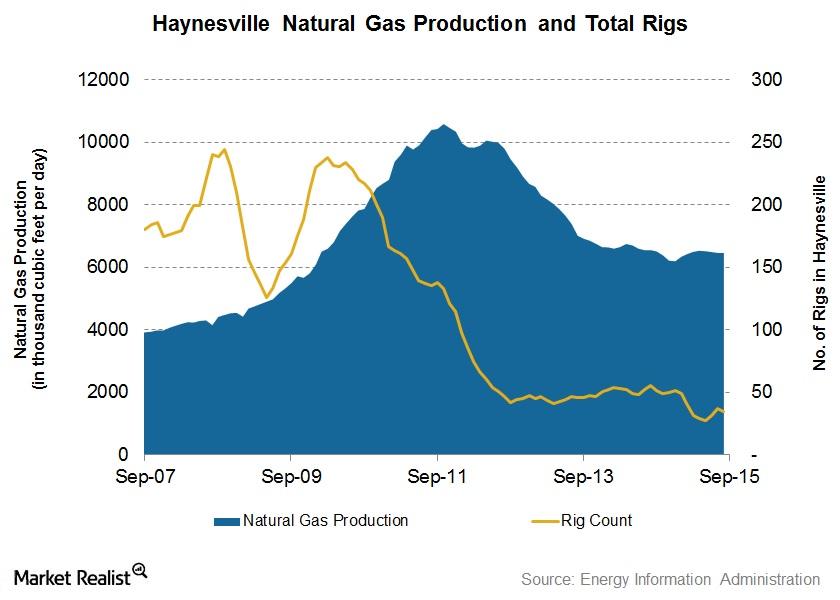
Haynesville Shale Natural Gas Production Fell in September
The Haynesville Shale’s natural gas production in September was 0.1% lower than August. On a YoY basis, it was 1.4% less. The drop marked the fourth straight month-over-month fall in production.