Memorial Resource Development Corp
Latest Memorial Resource Development Corp News and Updates
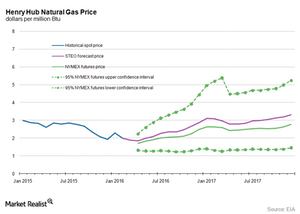
What’s the Long-Term US Natural Gas Price Forecast?
In its March Short-Term Energy Outlook report, the EIA forecast that the US natural gas supply-demand balance could average around 2.9 Bcf per day in 2016.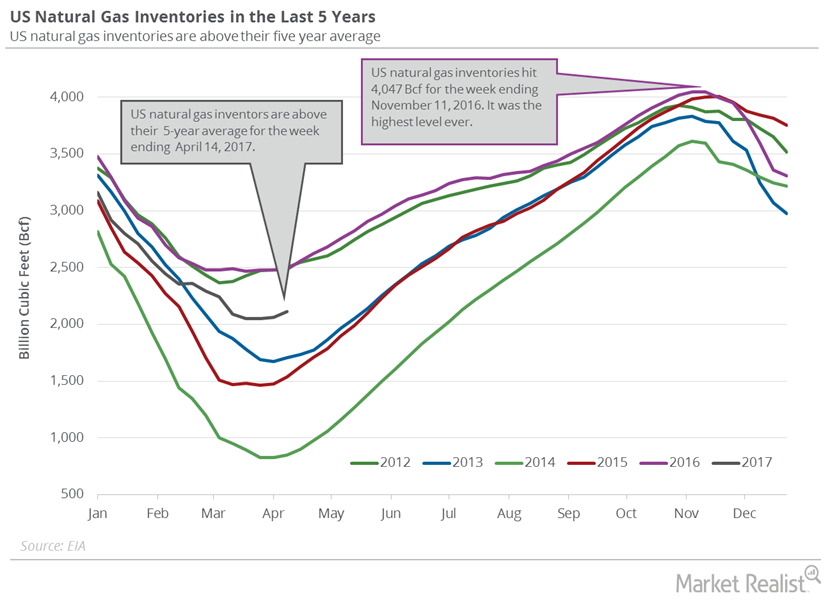
US Natural Gas Inventories Pressure Prices
The EIA reported that US natural gas inventories rose by 54 Bcf to 2,115 Bcf on April 7–14, 2017. Inventories rose 2.6% week-over-week but fell 14.8% YoY.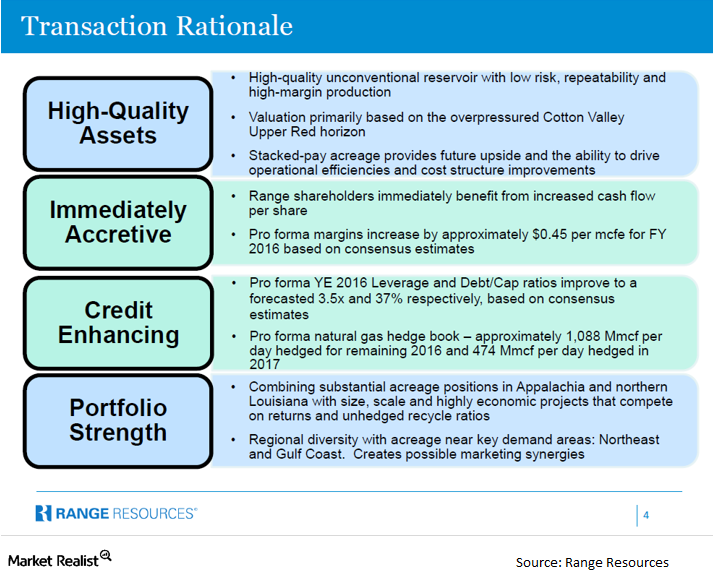
Rationale for the Memorial Resource-Range Resources Transaction
Range Resources is growing its portfolio in the Southeast US. Natural gas exports seem to be a promising growth area. The deal will enhance its credit profile.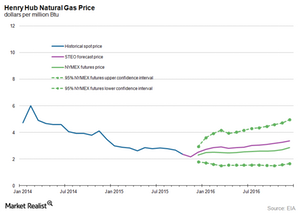
What’s the Long-Term Forecast for Natural Gas Prices?
US natural gas prices have fallen for the third time in the last five trading sessions. Prices are following the long-term bearish trend and trading close to 16-year lows.