United States Natural Gas ETF
Latest United States Natural Gas ETF News and Updates
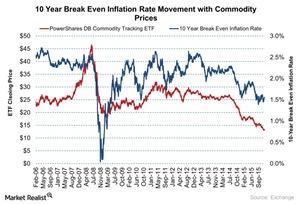
Where Will Commodities Head during Trump’s Term?
Donald Trump’s policies are aimed at strengthening job markets in the United States (VFINX) (IVV).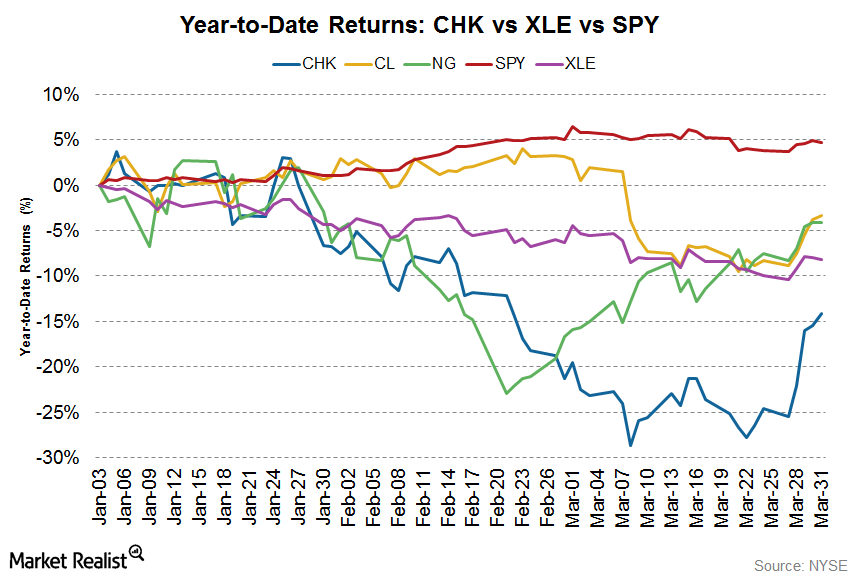
Natural Gas Prices Driving Chesapeake Energy Stock in 2017
Chesapeake Energy’s (CHK) 2016 debt management efforts included a combination of debt exchanges, open market repurchases, and equity-for-debt exchanges.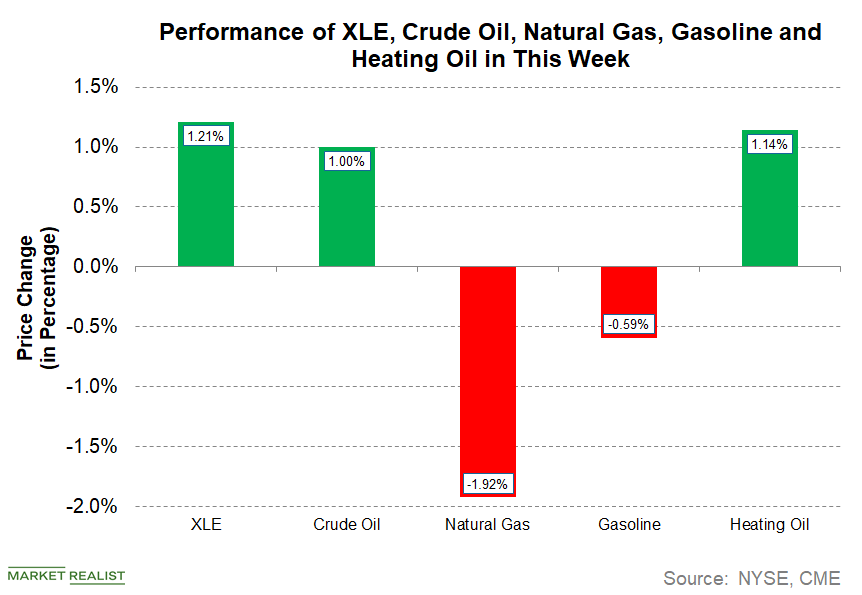
How Energy Commodities Performed from June 18–20
Energy stocks are rising this week. The Energy Select Sector SPDR ETF (XLE) has risen 1.2% from June 18–20.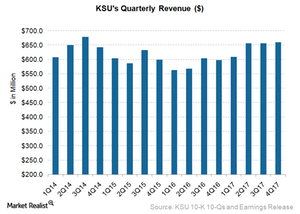
How Kansas City Southern Beat Revenue Estimate in 4Q17
In the fourth quarter 2017, Kansas City Southern (KSU) reported revenue of $660.4 million, exceeding analysts’ revenue estimates by 0.6%.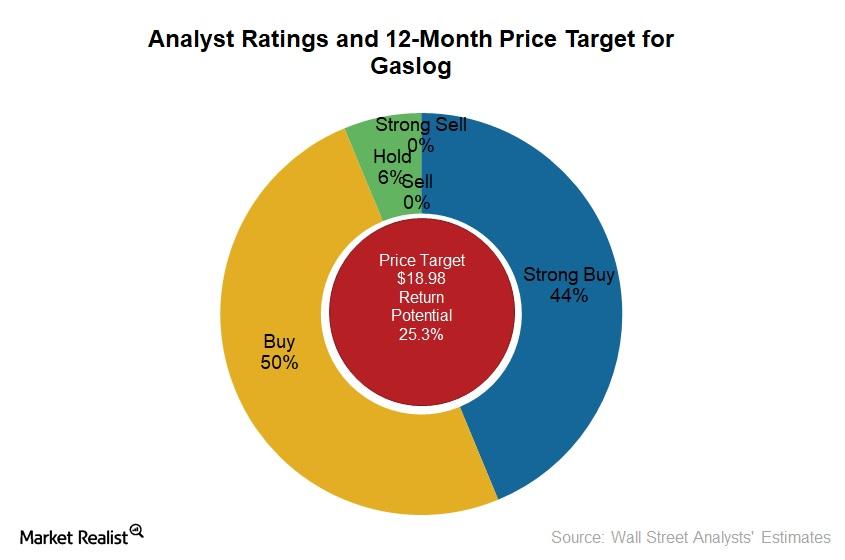
Morgan Stanley Upgrades GasLog
In June 2017, Morgan Stanley upgraded GasLog (GLOG) to “overweight” from “equal weight.”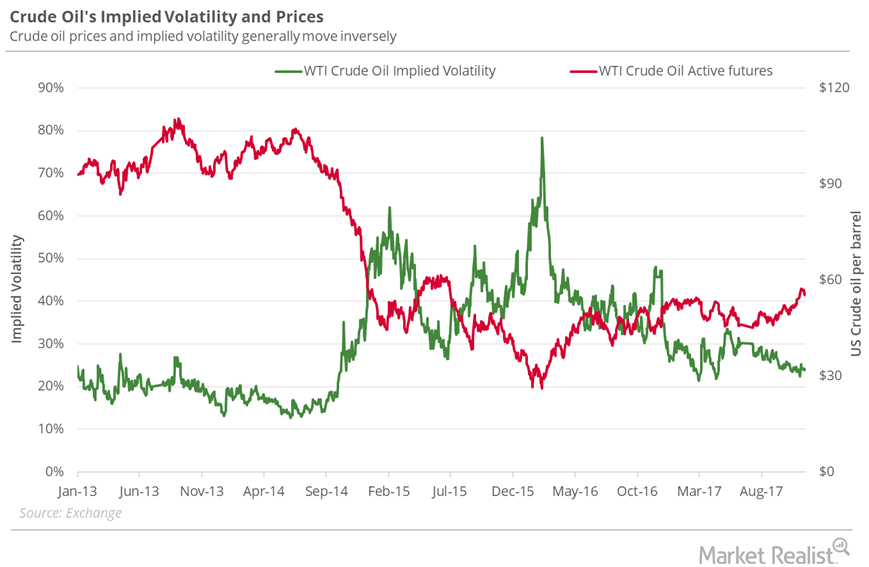
How Much Natural Gas Could Fall Next Week
On November 16, 2017, the implied volatility of natural gas was 44%—6.4% above its 15-day average.
Will Natural Gas Prices Fall to $2.8 Next Week?
On November 2, 2017, natural gas’s (GASL) (GASX) implied volatility was 38.2%, 1.8% below its 15-day average.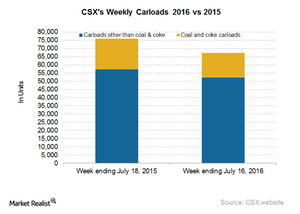
Why Did CSX’s Carloads Slump in the Week Ending July 16?
CSX (CSX) is a major operator in the Eastern US that competes with Norfolk Southern (NSC).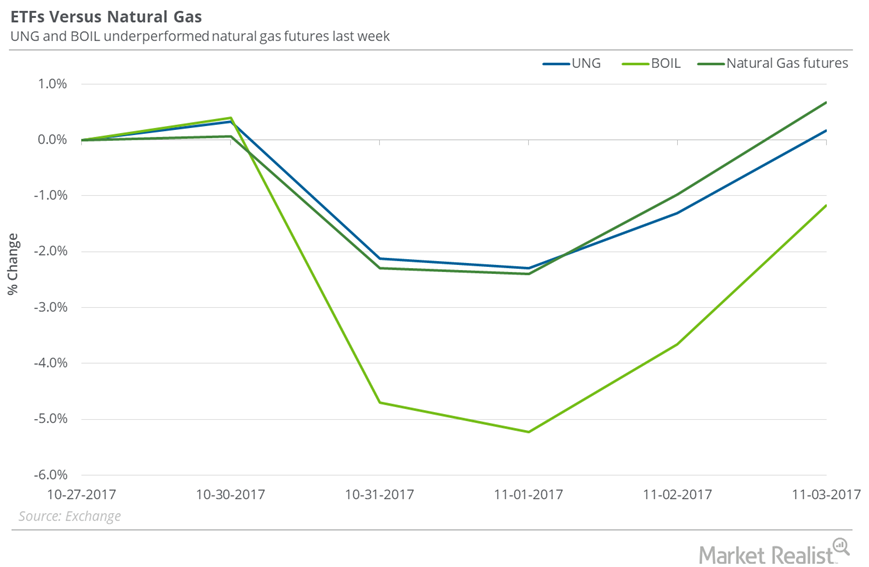
How Natural Gas ETFs Fared Last Week
Between October 27 and November 3, 2017, the United States Natural Gas Fund LP (UNG) rose just 0.2%, and natural gas December futures rose 0.7%.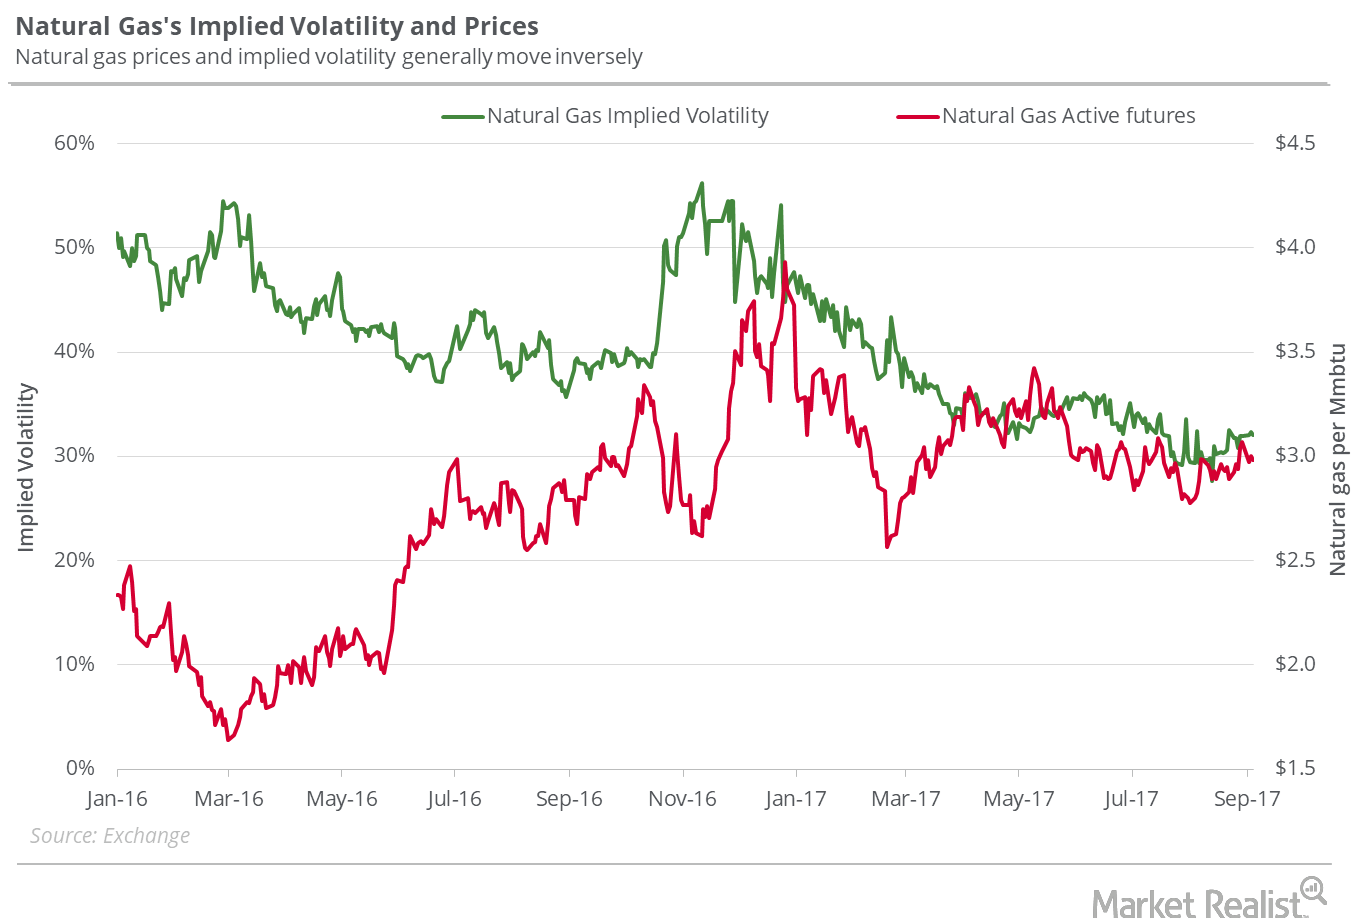
Where Natural Gas Prices Could Go Next Week
On September 21, 2017, natural gas implied volatility was 35.1%, or 5.1% above the 15-day average.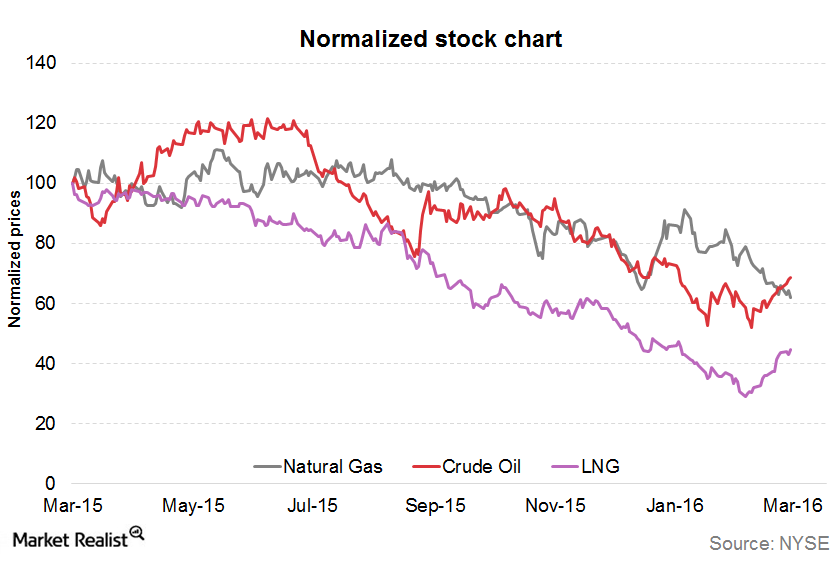
Analyzing Cheniere Energy’s Commodity Price Exposure
The correlation between Cheniere Energy’s stock price and crude oil (USO) resulted in a correlation coefficient of 0.87 during the past year.
Are Natural Gas Supplies Overtaking Demand?
Futures spread On September 27, 2017, natural gas (FCG) (GASL) (BOIL) 2018 November futures traded $0.04 lower than November 2017 futures. That is, the futures spread was at a discount of $0.04. On September 20, 2017, the futures spread was at a discount of $0.10. Between September 20 and 27, 2017, natural gas November futures […]
Energy Calendar for Oil and Gas Traders: May 1–5
The energy sector contributed to ~6.3% of the S&P 500 (SPY) (SPX-INDEX) on April 28, 2017. Oil and gas are major parts of the energy sector.
Could Natural Gas Reach a New 2017 Low Next Week?
Implied volatility On December 21, 2017, natural gas futures’ implied volatility was 42.4%. In the last trading session, their implied volatility was on par with the 15-day average. Supply-glut concerns pushed natural gas (UNG) (BOIL) futures to a 17-year low on March 3, 2016, with an implied volatility of 53.8%. From this multiyear low, natural gas prices […]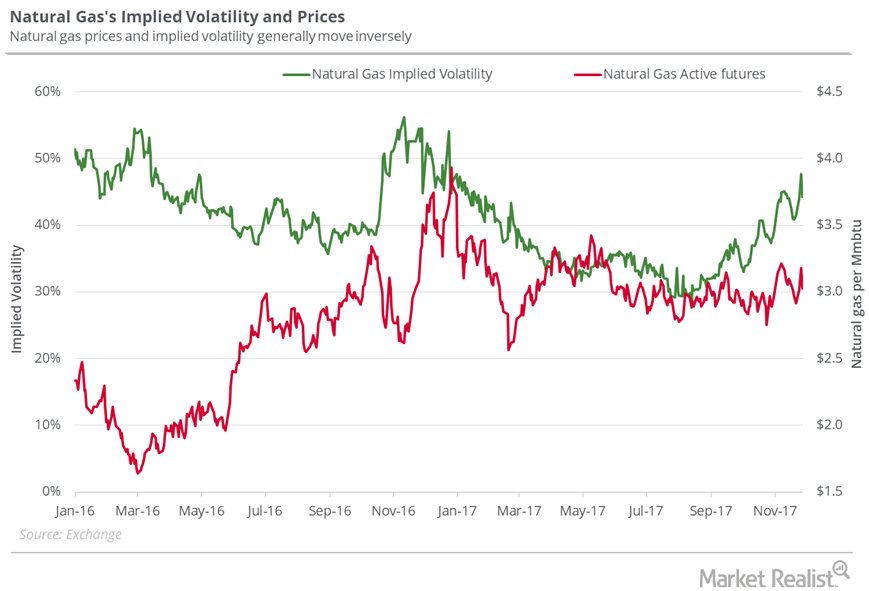
Can Natural Gas Stay above $3 Next Week?
On November 30, 2017, natural gas’s implied volatility was 44.3%, about 1% above its 15-day average.
Futures Spread: Is the Natural Gas Market Turning Bullish?
On September 20, 2017, natural gas (FCG) (BOIL) October 2018 futures closed $0.10 below its October 2017 futures.
Why US Crude Oil Prices Are Steady
On June 14, Russia and Saudi Arabia announced a bilateral framework to increase cooperation and manage the oil market.
Energy Sector and Crude Oil Prices Helped the S&P 500
The S&P 500 rose ~0.7% to 2,733.01 on May 21 due to the rise in industrial stocks and crude oil prices—the highest level in more than two months.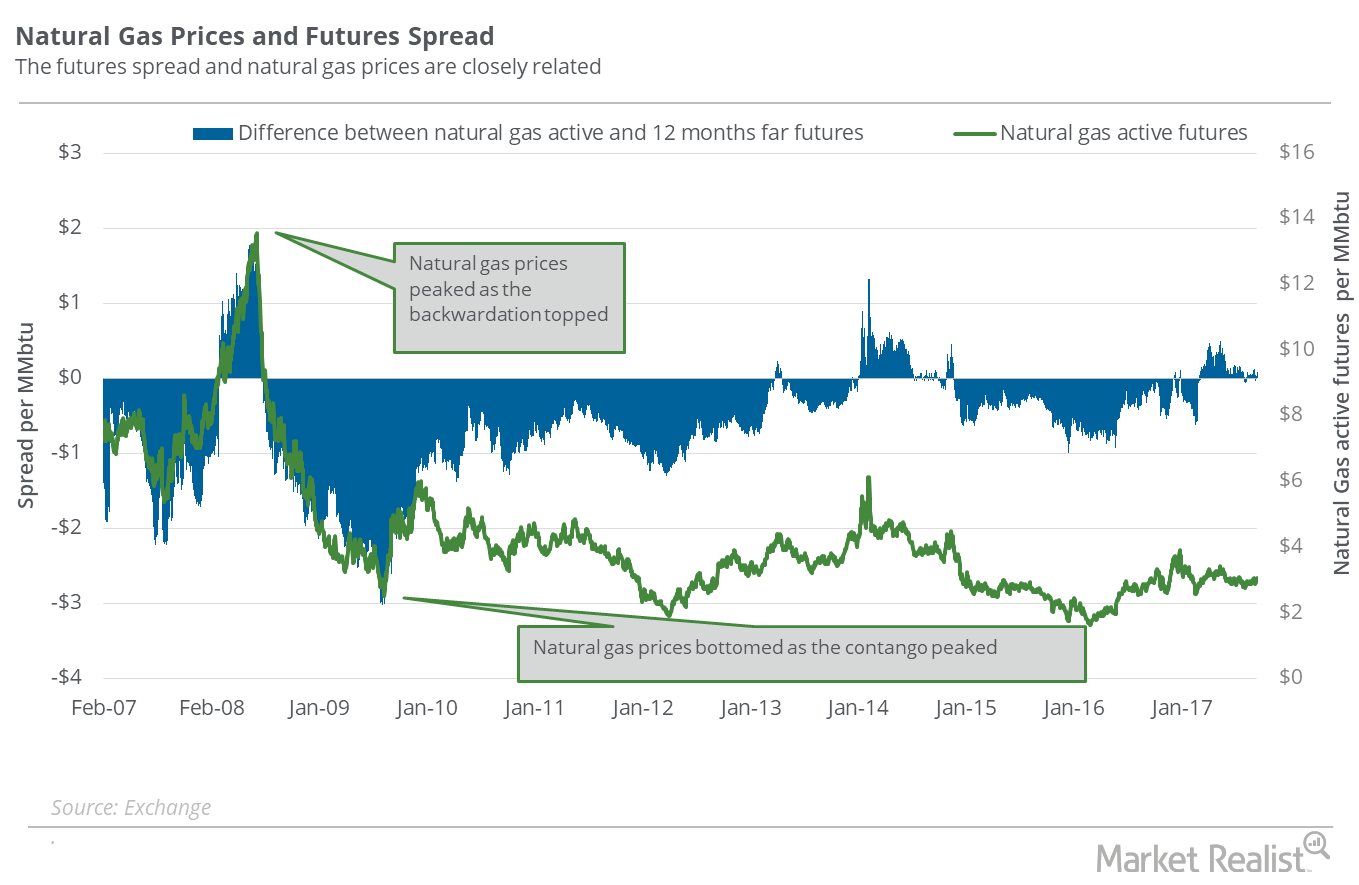
What the Natural Gas Futures Spread Tells Us about the Current Sentiment
On September 6, 2017, the futures spread was at a discount of $0.06, but on September 8, 2017, the futures spread shifted to a premium.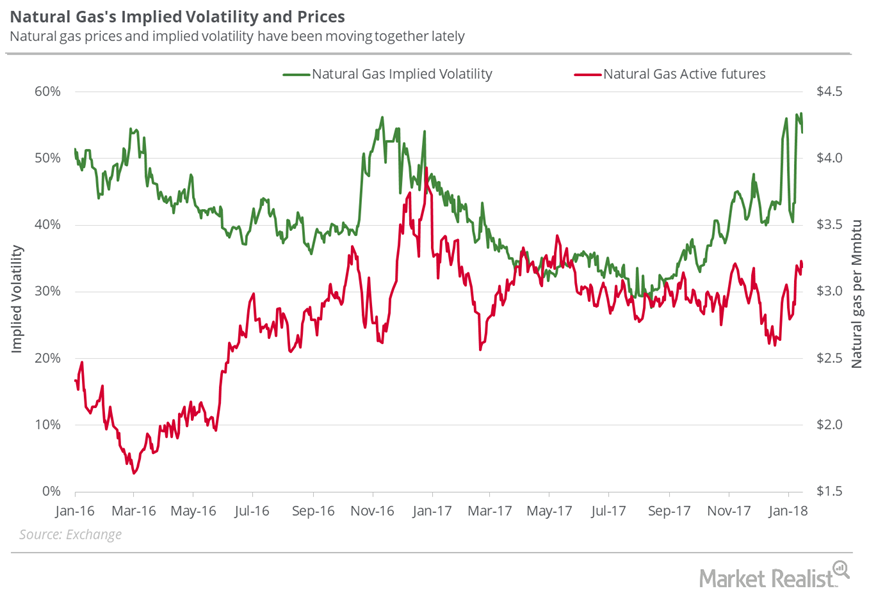
What to Expect from Natural Gas Next Week
On January 18, 2018, natural gas’s implied volatility was 53.9%, 10.2% above its 15-day average.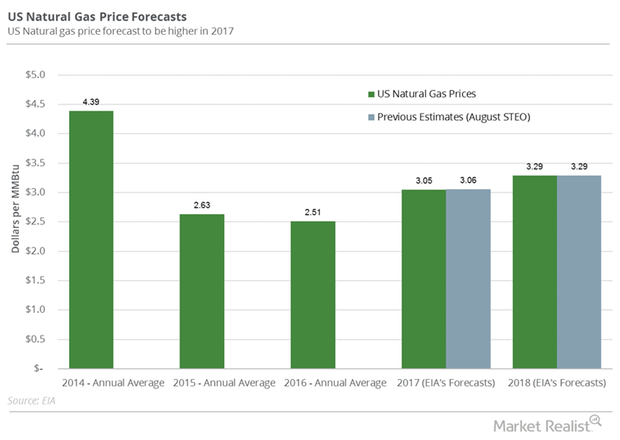
How Hedge Funds Feel about Natural Gas Right Now
On September 29, the CFTC (U.S. Commodity Futures Trading Commission) is slated to release its weekly “Commitment of Traders” report.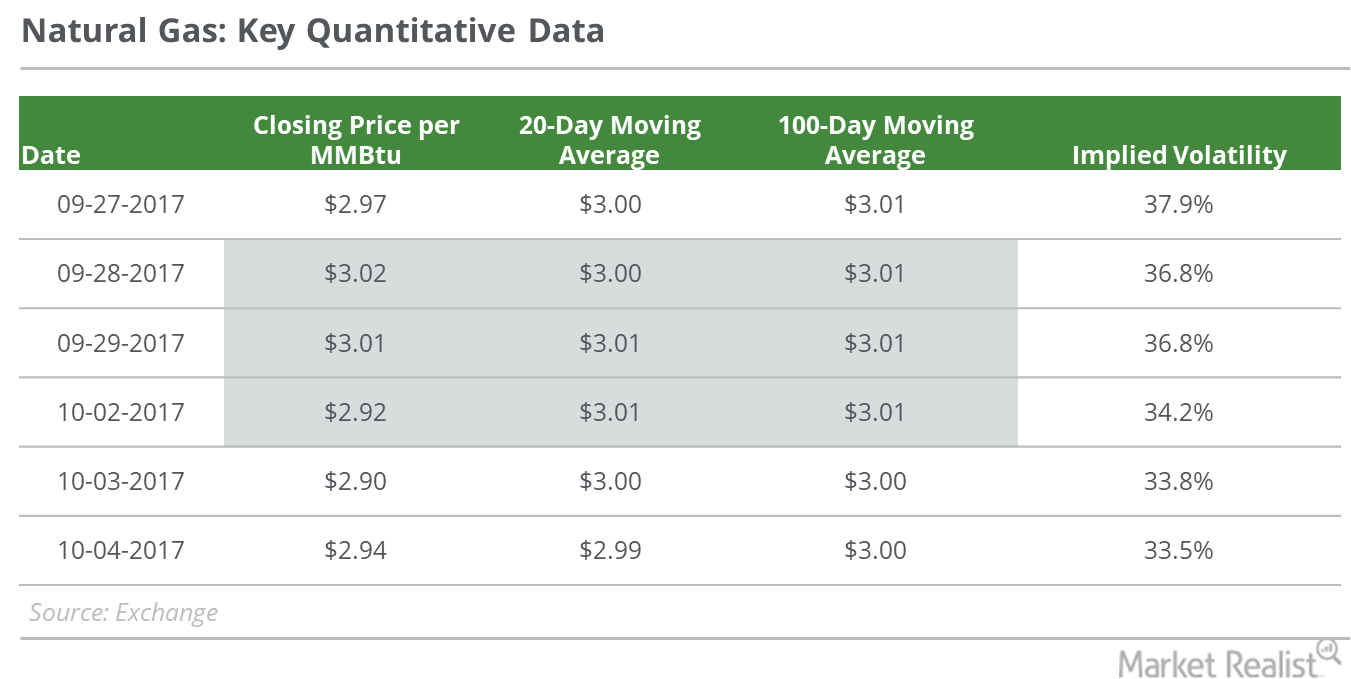
Could La Niña Save Natural Gas Bulls?
On October 4, 2017, natural gas (UNG) November futures closed at $2.94 per MMBtu (million British thermal units), a rise of 1.6% from the last trading session.
US Natural Gas Consumption Could Help the Prices
US natural gas consumption fell 0.17% to 57.1 Bcf/d (billion cubic feet per day) on October 12–18, 2017. It rose 3.1% from the same period in 2016.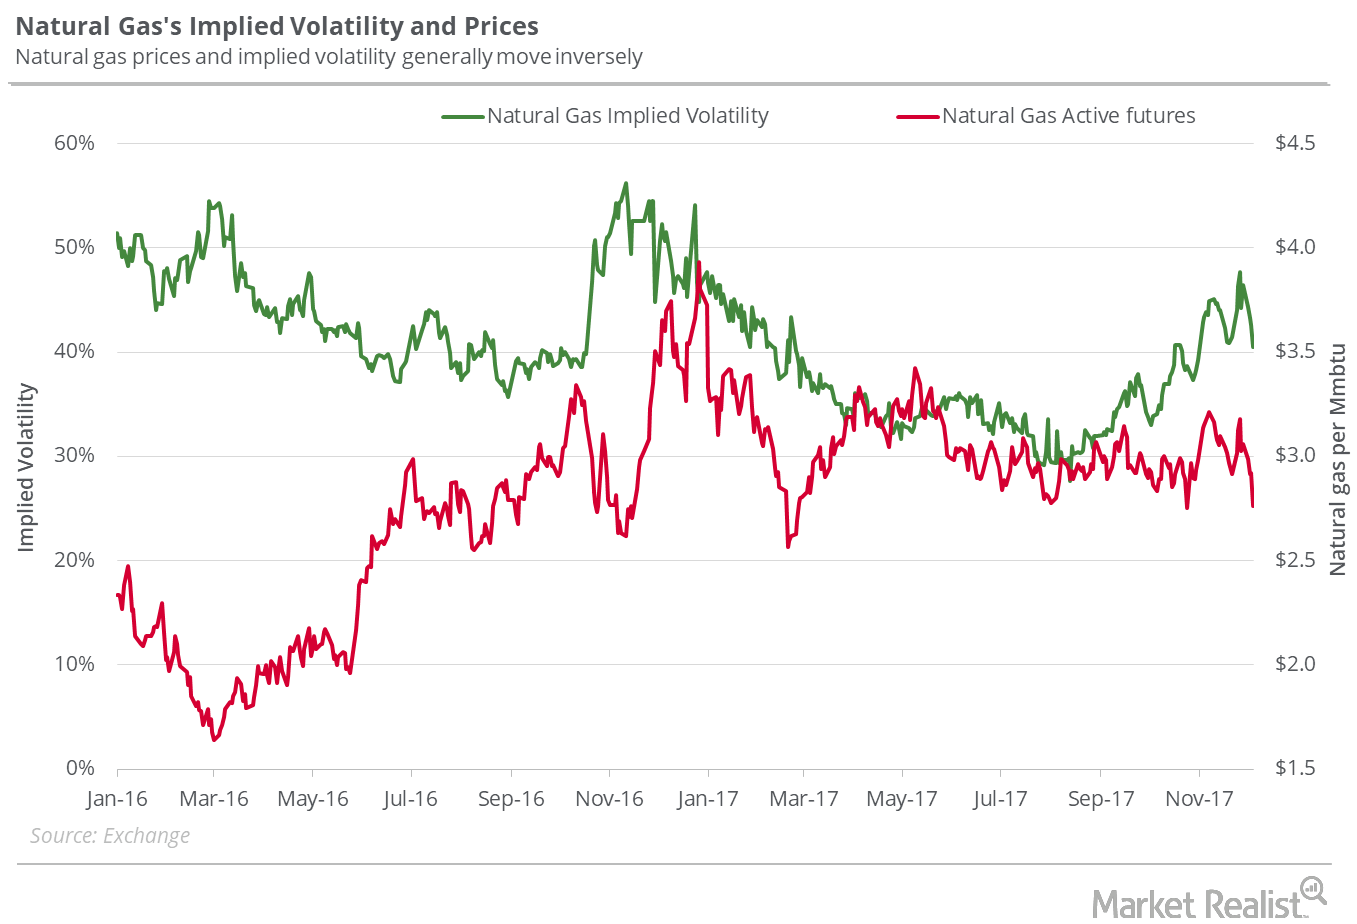
Possibilities for Natural Gas Prices Next Week
On December 7, 2017, natural gas’s implied volatility was 40.5% or ~7.5% less than its 15-day average. On November 29, the implied volatility rose to 47.7%.
Energy Calendar: Analyzing Key Oil and Gas Drivers
The energy sector contributed to ~6.6% of the S&P 500 on March 31, 2017. Oil and gas producers’ earnings depend on crude oil and natural gas prices.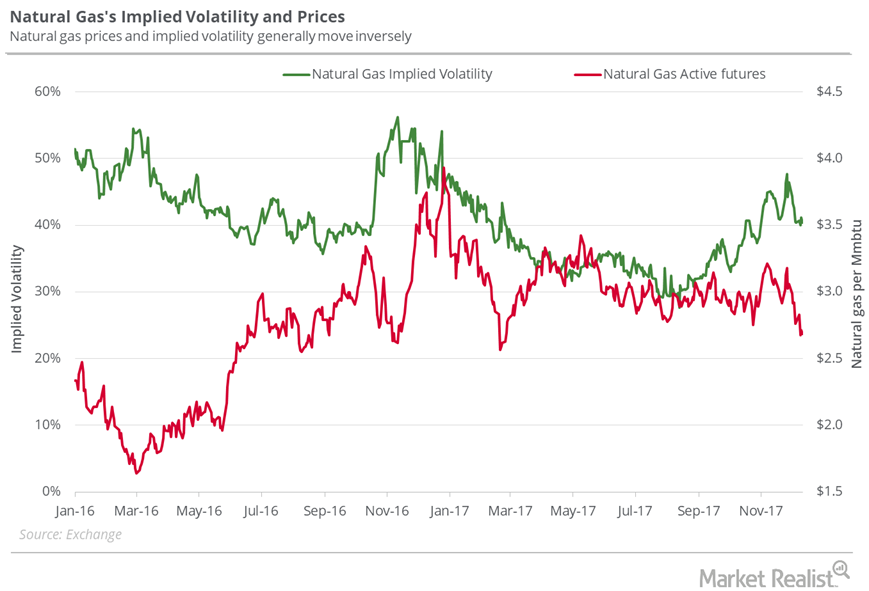
Could Natural Gas Hit a New 2017 Low Next Week?
On December 14, 2017, the implied volatility of natural gas futures was 40.4%. It was ~5.9% below its 15-day average.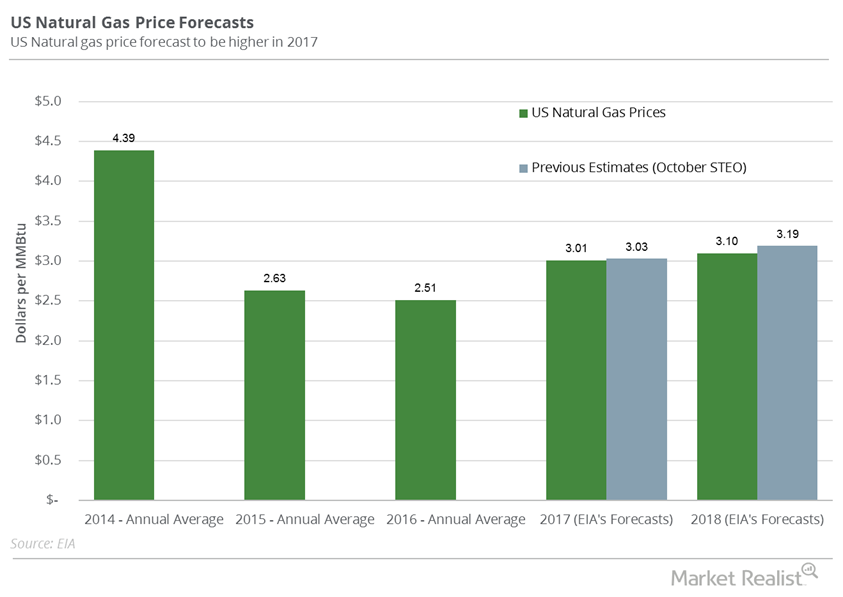
Hedge Funds: Bullish or Bearish on Natural Gas?
Aegent Energy Advisors predicts that US natural gas prices might not exceed $3.18 per MMBtu by December 2017.
Will Natural Gas Reclaim $3 Next Week?
On October 12, 2017, natural gas implied volatility was 35.9%, 1.7% above its 15-day average.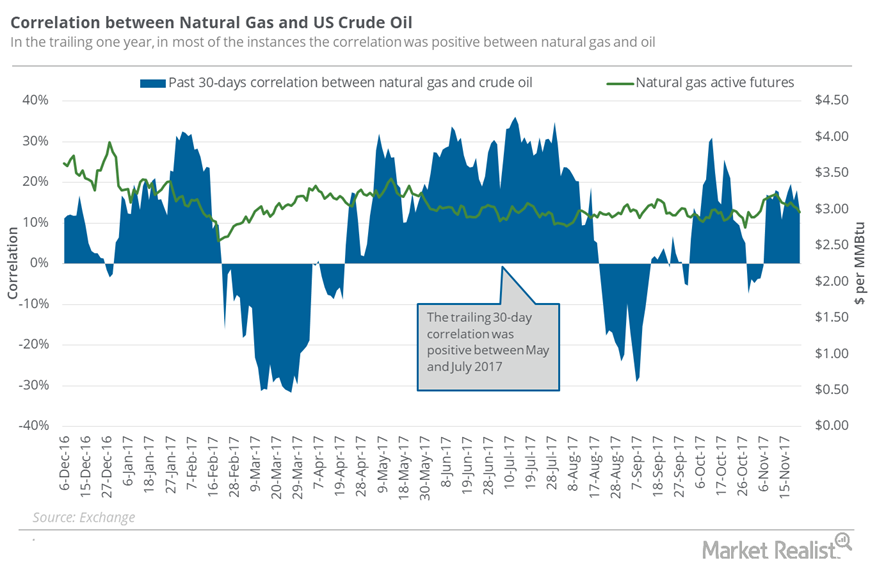
How Closely Is Natural Gas Tracking Oil?
Between November 15 and 22, natural gas (UNG)(FCG) January futures had a correlation of 52.5% with US crude oil January futures.
Natural Gas Could Reach the $3.4 Mark Next Week
On November 9, 2017, natural gas had an implied volatility of 43.5%—9.4% more than its 15-day average. Natural gas active futures settled at $3.2 per MMBtu.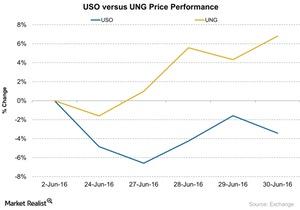
Why Did UNG Outperform USO?
From June 23—30, the United States Natural Gas ETF (UNG) outperformed the United States Oil ETF (USO). UNG rose ~6.8%, while USO fell ~3.4%.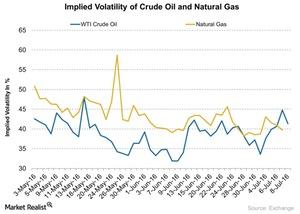
What Are the Implied Volatilities of Crude Oil and Natural Gas?
Crude oil’s (USO) (OIIL) implied volatility was 41.3% on July 8, 2016.
Why Natural Gas Prices Could Take a Hit Next Week
On October 24, natural gas prices rose 1.5% and settled at $2.32 per MMBtu. On the same day, the United States Natural Gas Fund LP rose 1.4%.
US Natural Gas Futures Could Continue to Fall
Hedge funds’ net long positions in US natural gas futures (UGAZ) (UNG) and options contracts were at 5,318 for the week ending January 2, 2018.
Where Is US Crude Oil Headed? An Energy Update
On August 30, US crude oil October futures settled at $55.1 per barrel. On a week-over-week basis, US crude oil prices rose 1.7%.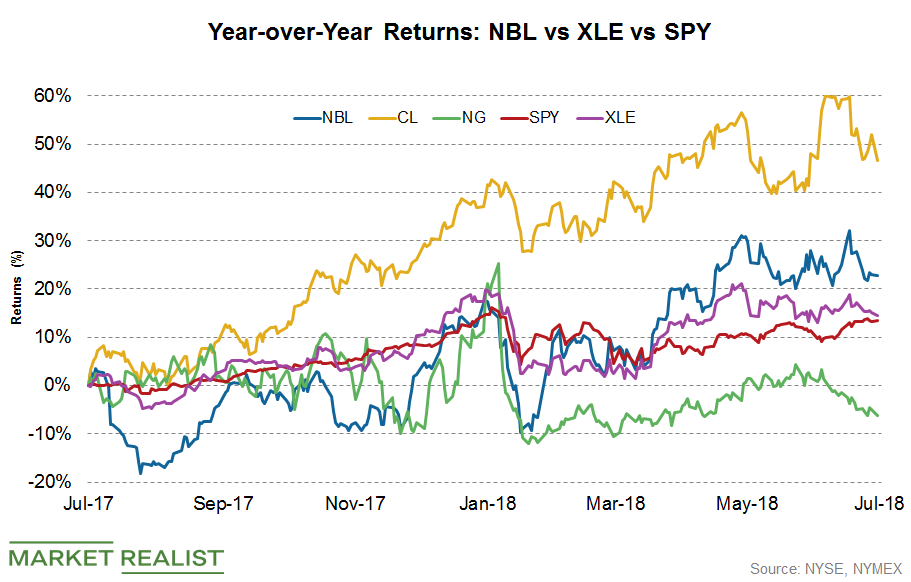
How Has Noble Energy Stock Been Performing Recently?
Year-over-year, NBL stock has risen ~22.7%, while crude oil prices have surged 46.5% in the same period.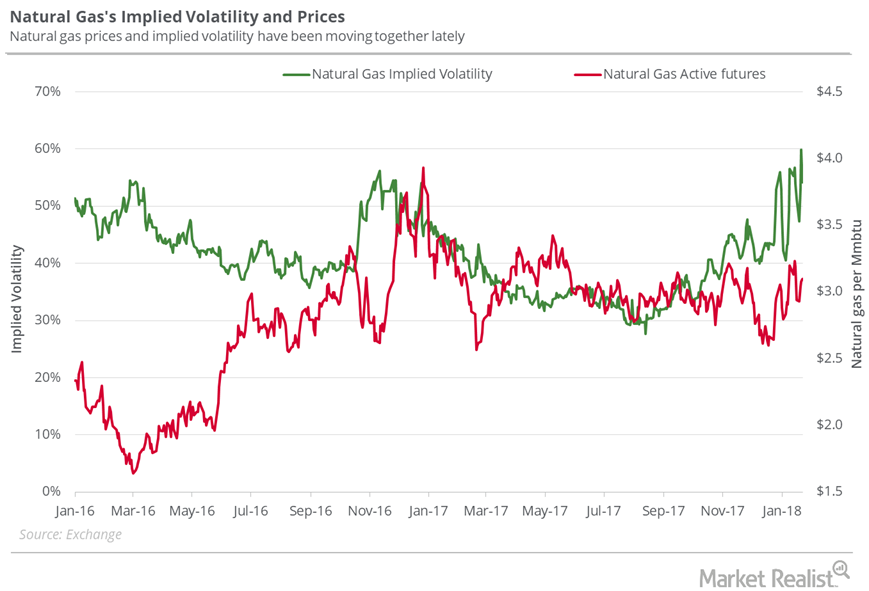
Where Could Natural Gas Prices Close Next Week?
On January 25, 2018, natural gas’s implied volatility was at 54.8%, 8% above its 15-day average.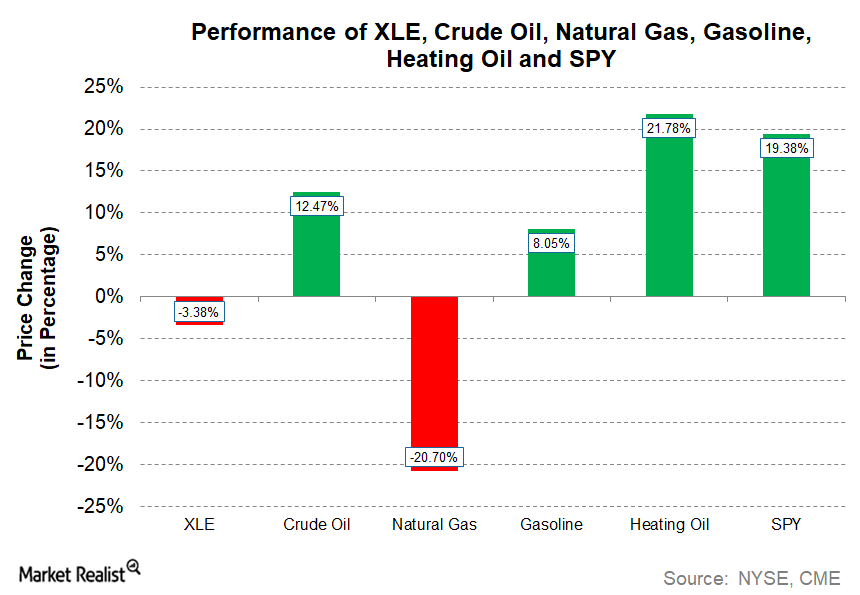
How the Energy Sector Performed in 2017
In this series, we’ll look at the best-performing and worst-performing stocks of the Energy Select Sector SPDR ETF (XLE) and analyze the earnings and developments behind the movements.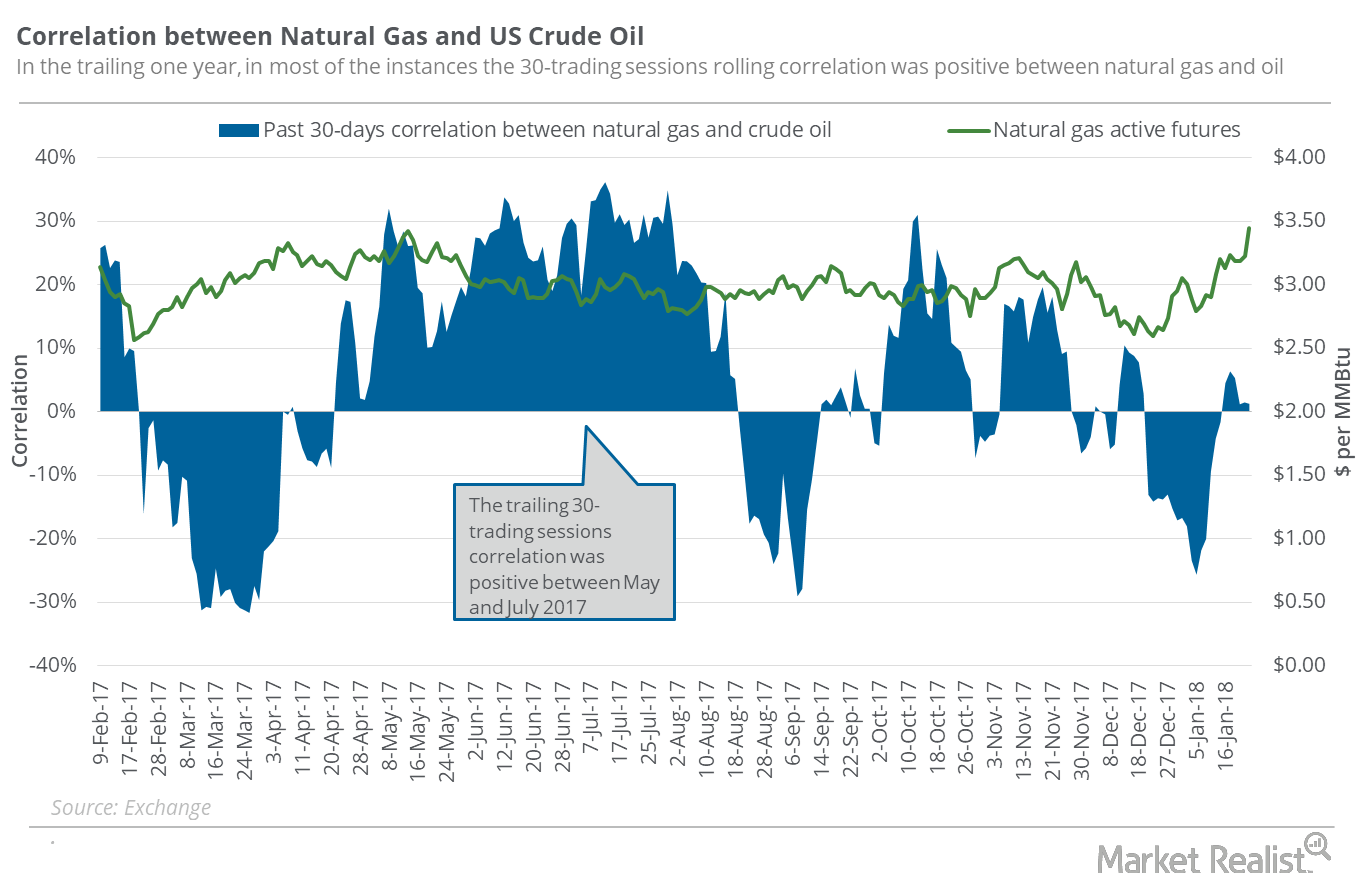
Does Natural Gas’s Rise Depend on Crude Oil?
Between January 16 and January 23, 2018, natural gas (GASL) (UNG) (FCG) had a correlation of 84.6% with US crude oil (OIIL) (USL) (DBO) active futures.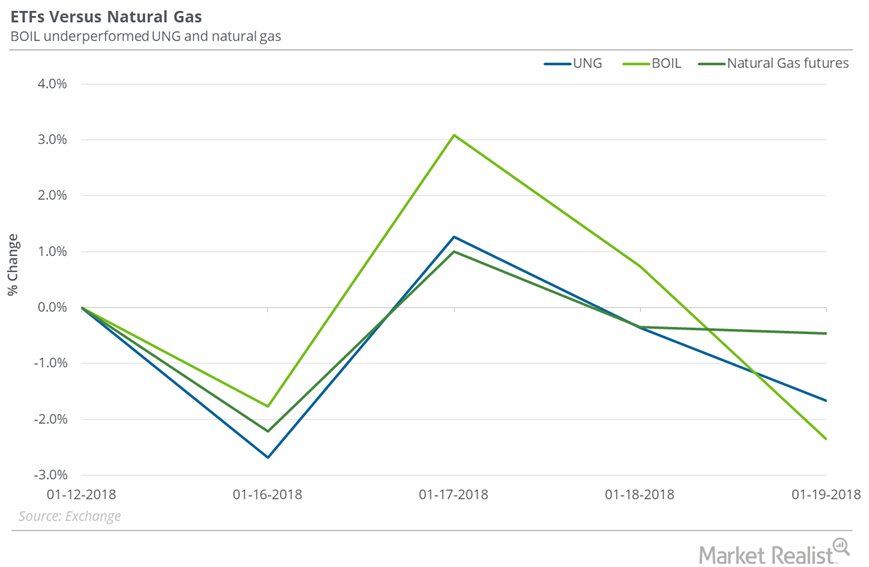
How Natural Gas ETFs Performed Last Week
Between January 12 and January 19, 2018, the United States Natural Gas ETF (UNG), an ETF that has exposure to natural gas futures, fell 1.7%.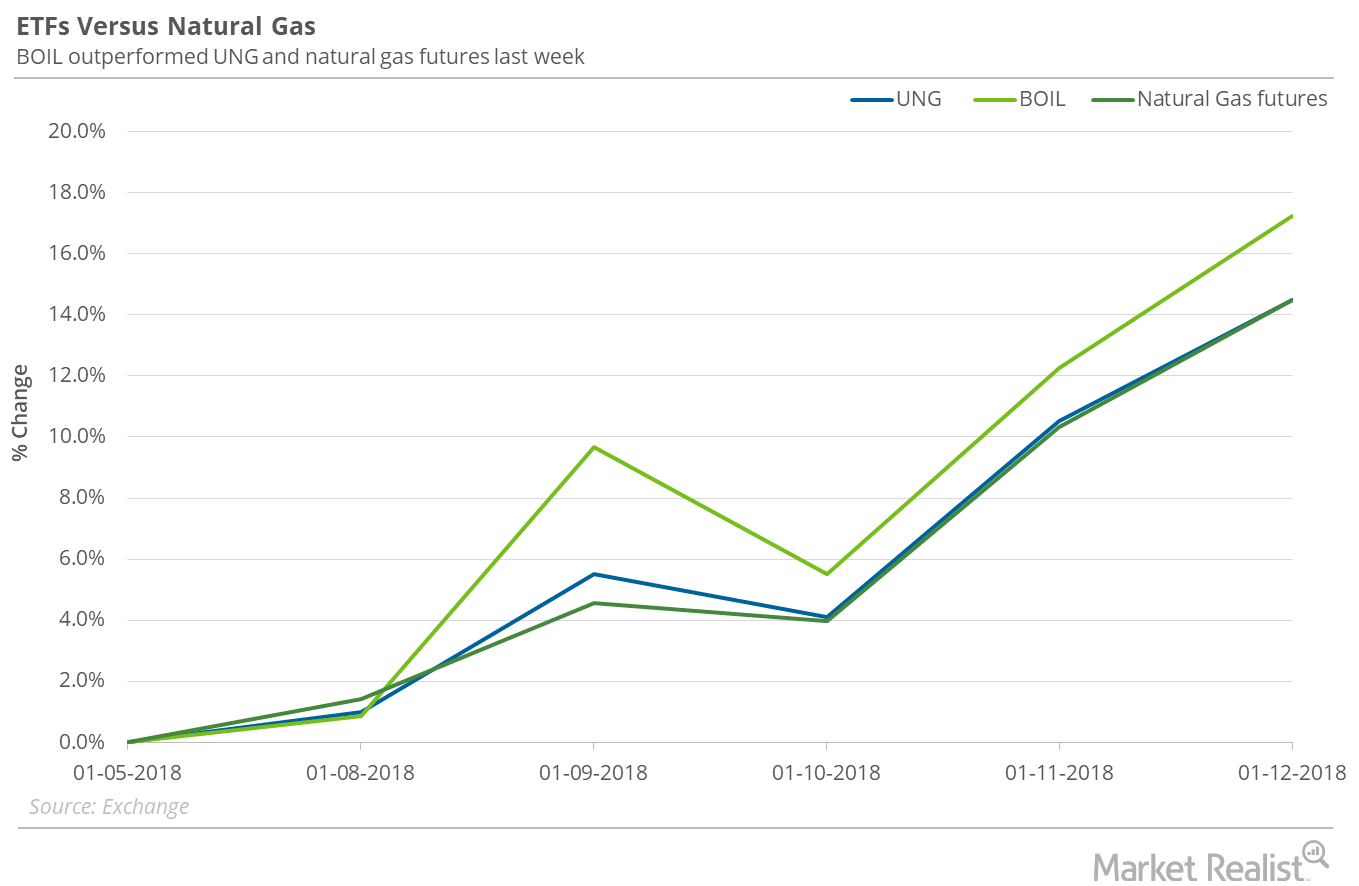
How Natural Gas ETFs Are Reacting to Spike in Natural Gas
Between January 5 and January 12, 2018, the United States Natural Gas ETF (UNG), which holds positions in active natural gas futures, gained 14.5%.
Is $3.30 Possible for Natural Gas Next Week?
On January 11, 2018, natural gas’s implied volatility was 49.1%. That’s 7% above its 15-day average.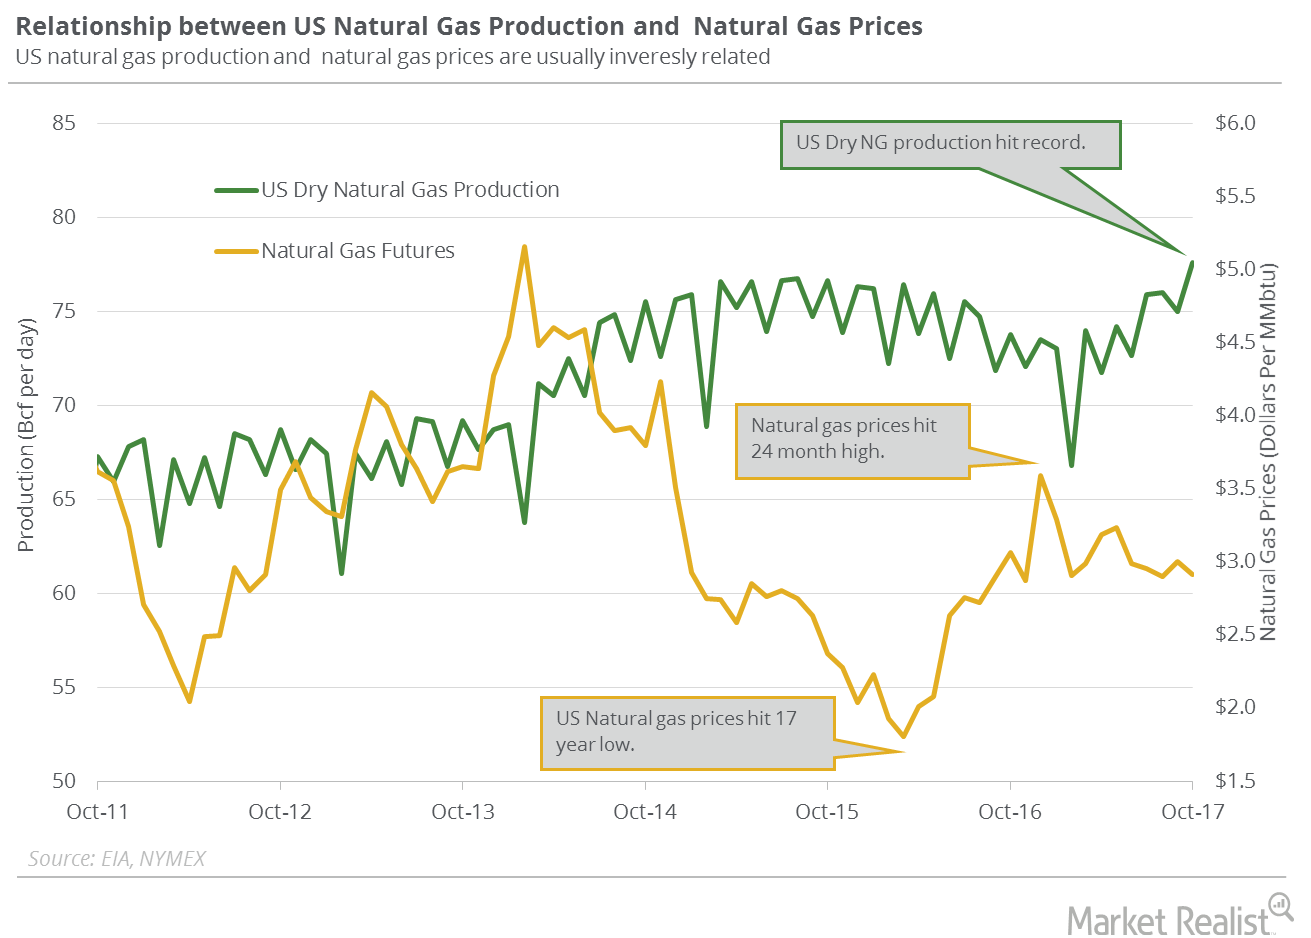
Will US Natural Gas Production Hit a Record in 2018 and 2019?
US dry natural gas production rose by 1.2 Bcf (billion cubic feet) per day or 1.6% to 74 Bcf per day on January 4–10, 2018, according to PointLogic.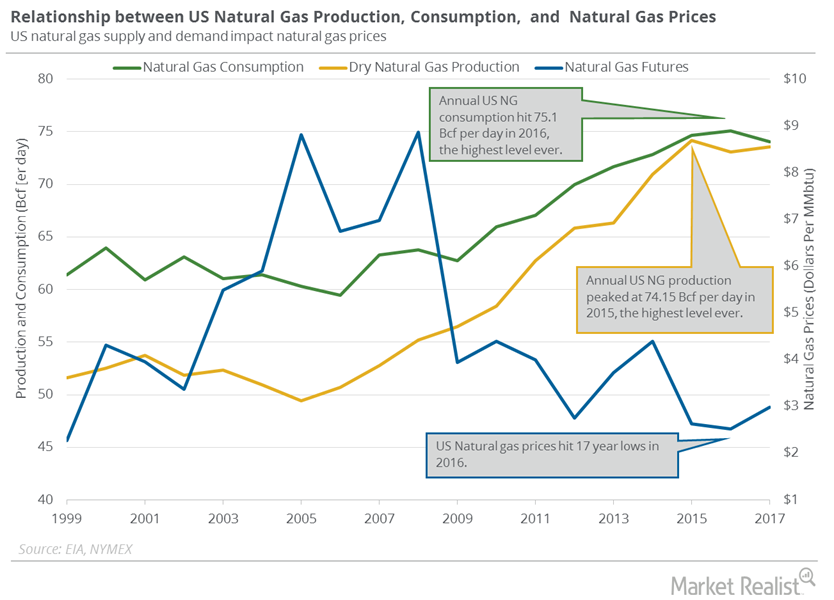
US Natural Gas Consumption Could Hit a Record in 2018 and 2019
US natural gas consumption fell 14.4% to 102.6 Bcf (billion cubic feet) per day on January 4–10, 2018, according to PointLogic.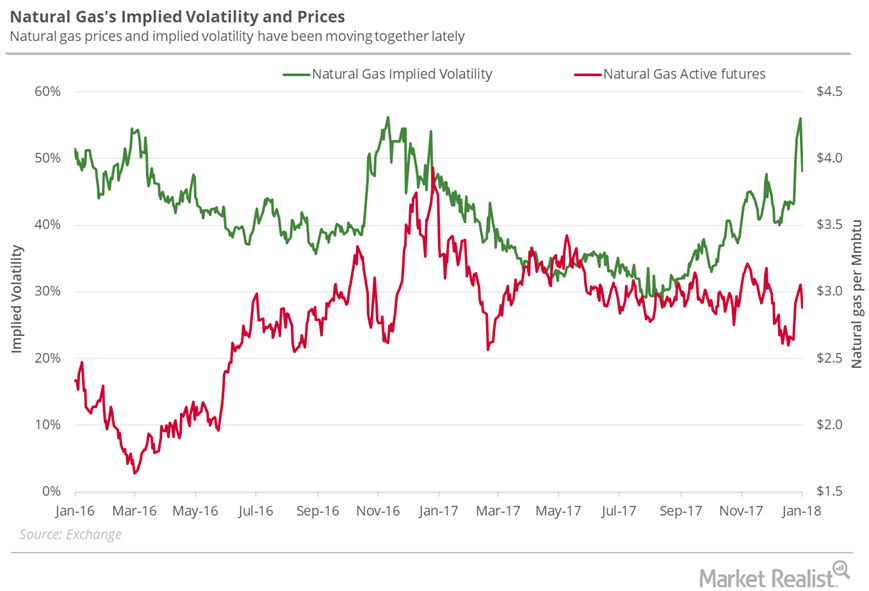
Possible Downside in Natural Gas Next Week
On December 21, 2017, natural gas prices closed at the lowest closing level since February 23, 2017. Since that day, natural gas futures have risen 11.1%.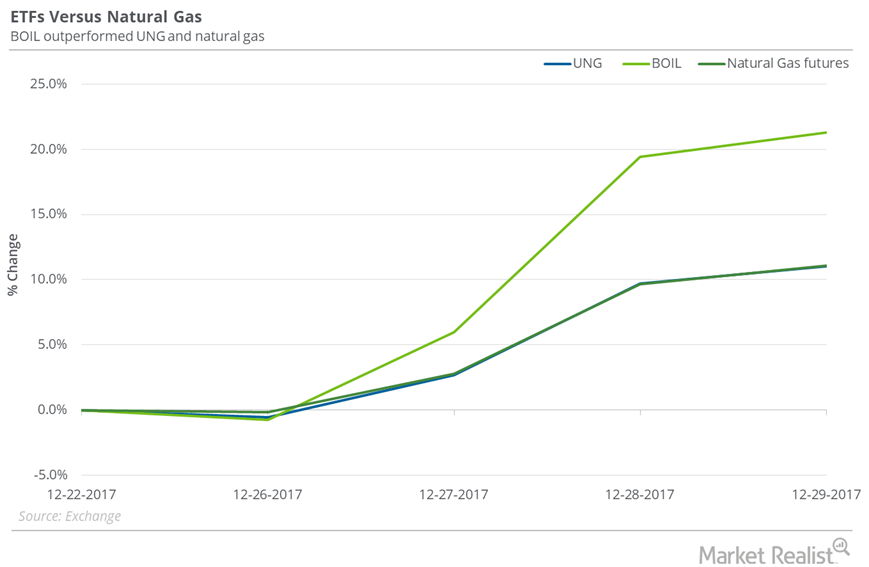
Natural Gas ETFs to Watch in 2018
On December 29, 2017, the closing prices of natural gas futures contracts between March 2018 and May 2018 were progressively lower.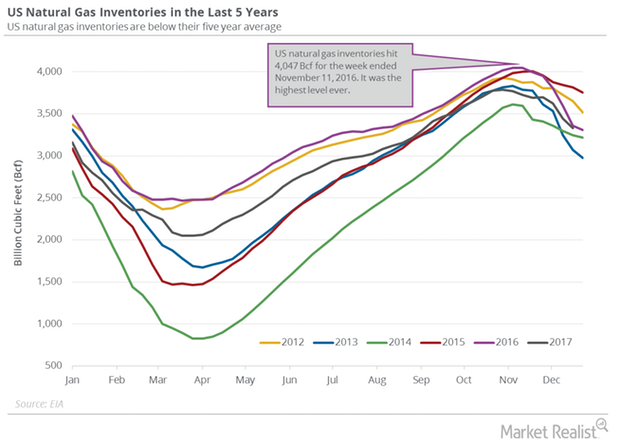
Natural Gas Inventories Could Help US Natural Gas Prices
A larger-than-expected withdrawal in US natural gas inventories compared to historical averages would help natural gas prices this week.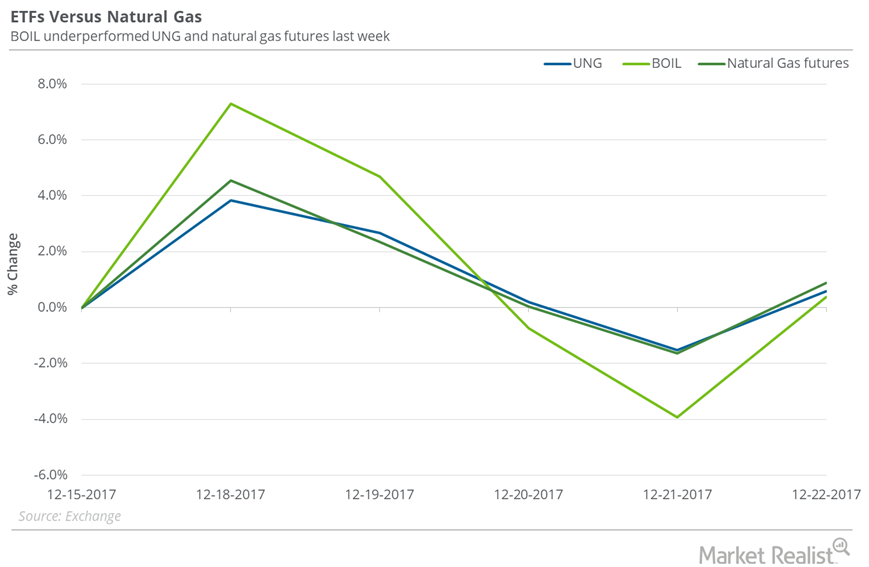
Natural Gas Returns and Natural Gas ETFs
From December 15–22, 2017, the United States Natural Gas Fund (UNG) rose 0.6%.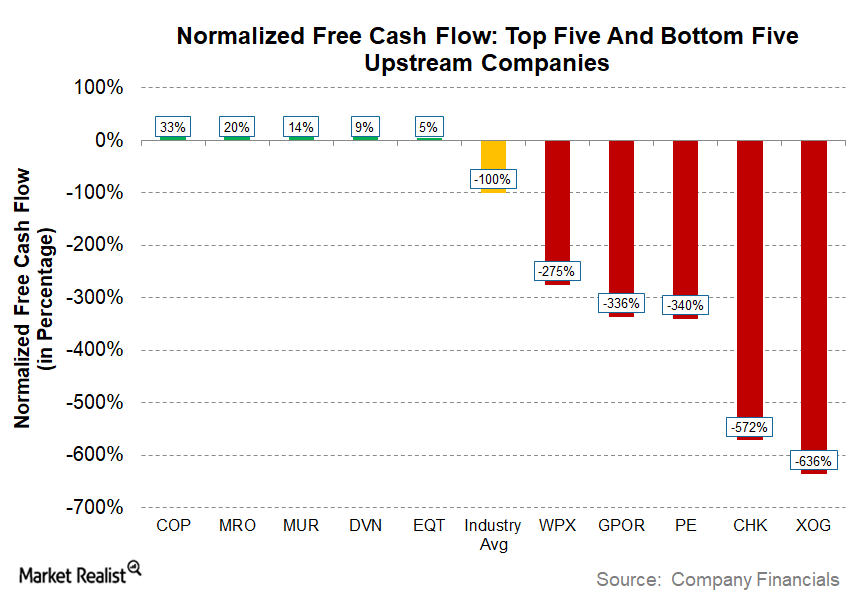
Upstream Energy’s Best and Worst Free Cash Flow Companies
Free cash flow (or FCF) is an important metric for the crude oil (USO) and natural gas (UNG) production (or upstream) sector.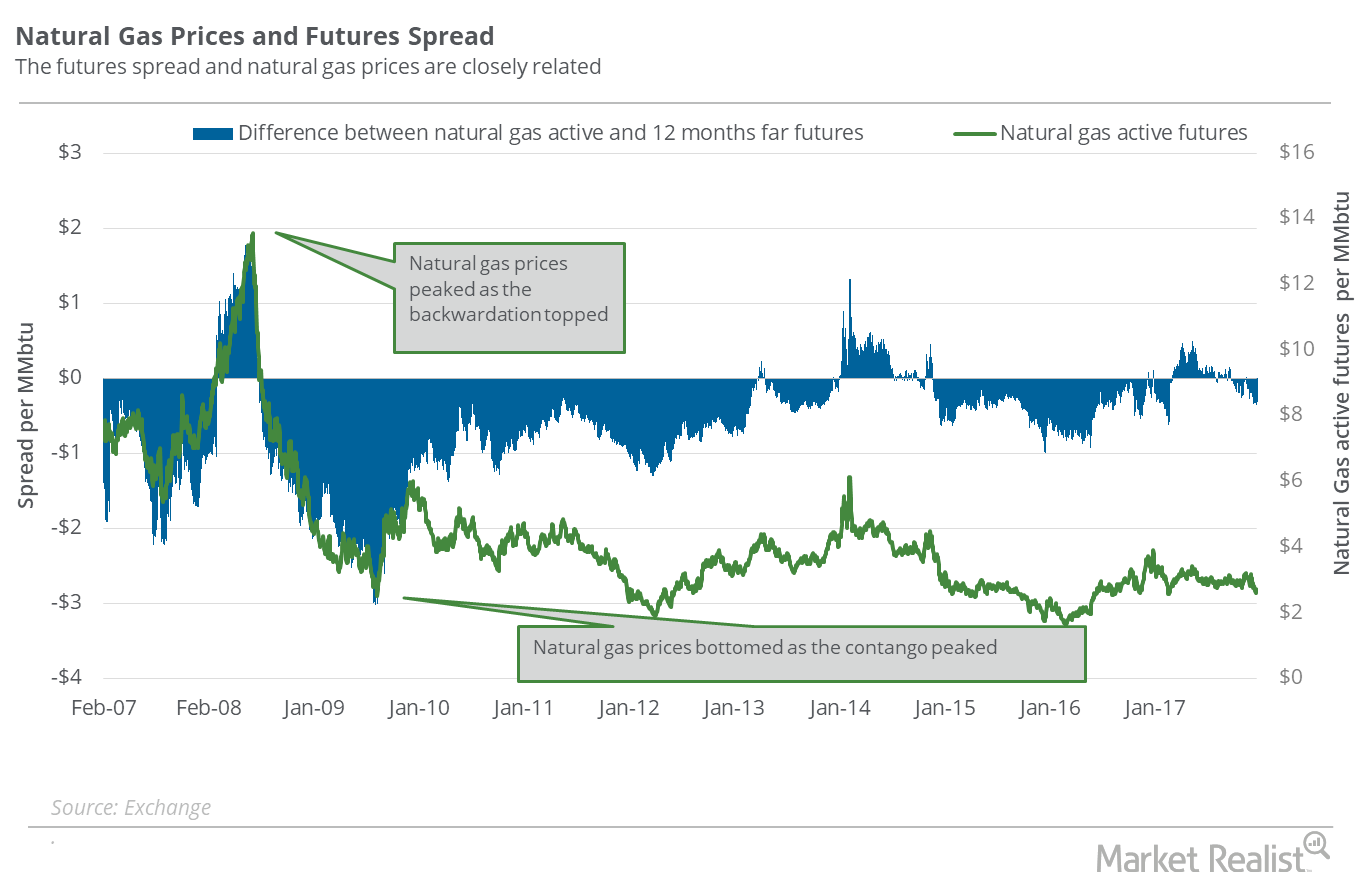
Natural Gas: Have Oversupply Concerns Eased?
On December 19, natural gas (UNG)(BOIL)(FCG) January 2018 futures closed $0.31 below its January 2019 futures.