Direxion Daily Natural Gas Related Bull 3x Shares
Latest Direxion Daily Natural Gas Related Bull 3x Shares News and Updates

World Bank: US Natural Gas Prices Could Trade Higher in 2017
US natural gas inventories are 16.4% more than their five-year average. High natural gas inventories could keep a lid on US natural gas prices.

Did Natural Gas–Weighted Stocks Outperform Natural Gas?
Between June 13 and June 20, our equally weighted basket of natural gas–weighted stocks rose 4.6%—compared to a 6.2% rise in natural gas for the same period.

Monthly US Natural Gas Production Fell in October
The EIA estimated that US-marketed natural gas production fell by 0.64 Bcf per day to 77.93 Bcf per day in October—compared to September 2016.

What Does the Shift in the Natural Gas Futures Spread Indicate?
On April 5, 2017, active natural gas (UNG) (FCG) (BOIL) (GASL) futures were trading at a premium of $0.33 to futures contracts 12 months forward.

How Much Natural Gas Could Fall Next Week
On November 16, 2017, the implied volatility of natural gas was 44%—6.4% above its 15-day average.

Natural Gas Supplies Rose for the Week Ended August 17
The EIA (U.S. Energy Information Administration) reported that US natural gas production averaged 78.9 Bcf per day in July 2016.

Will Natural Gas Prices Fall to $2.8 Next Week?
On November 2, 2017, natural gas’s (GASL) (GASX) implied volatility was 38.2%, 1.8% below its 15-day average.

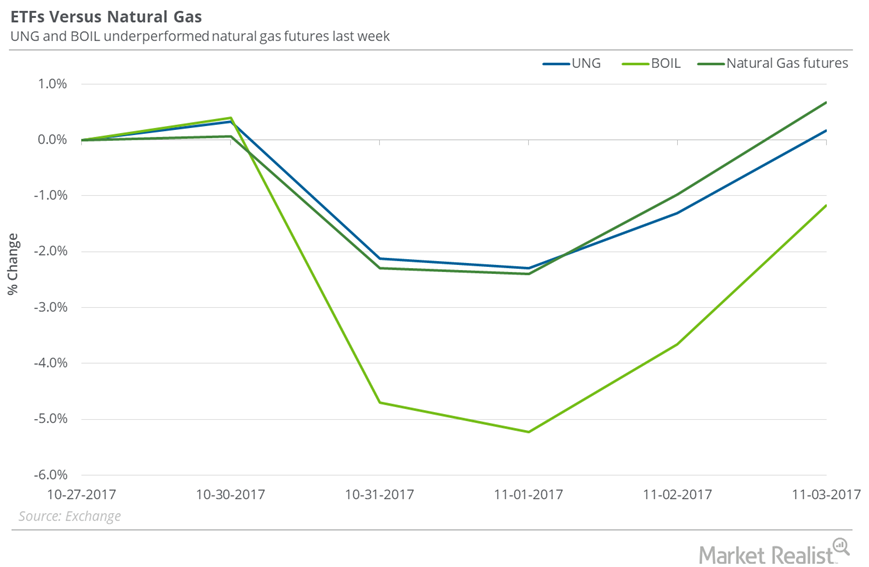
How Natural Gas ETFs Fared Last Week
Between October 27 and November 3, 2017, the United States Natural Gas Fund LP (UNG) rose just 0.2%, and natural gas December futures rose 0.7%.

Futures Spread: What It Says about Natural Gas Prices
On March 1, 2017, active natural gas (UNG) (FCG) (BOIL) (GASL) futures were trading at a discount of $0.5 to futures contracts 12 months ahead.

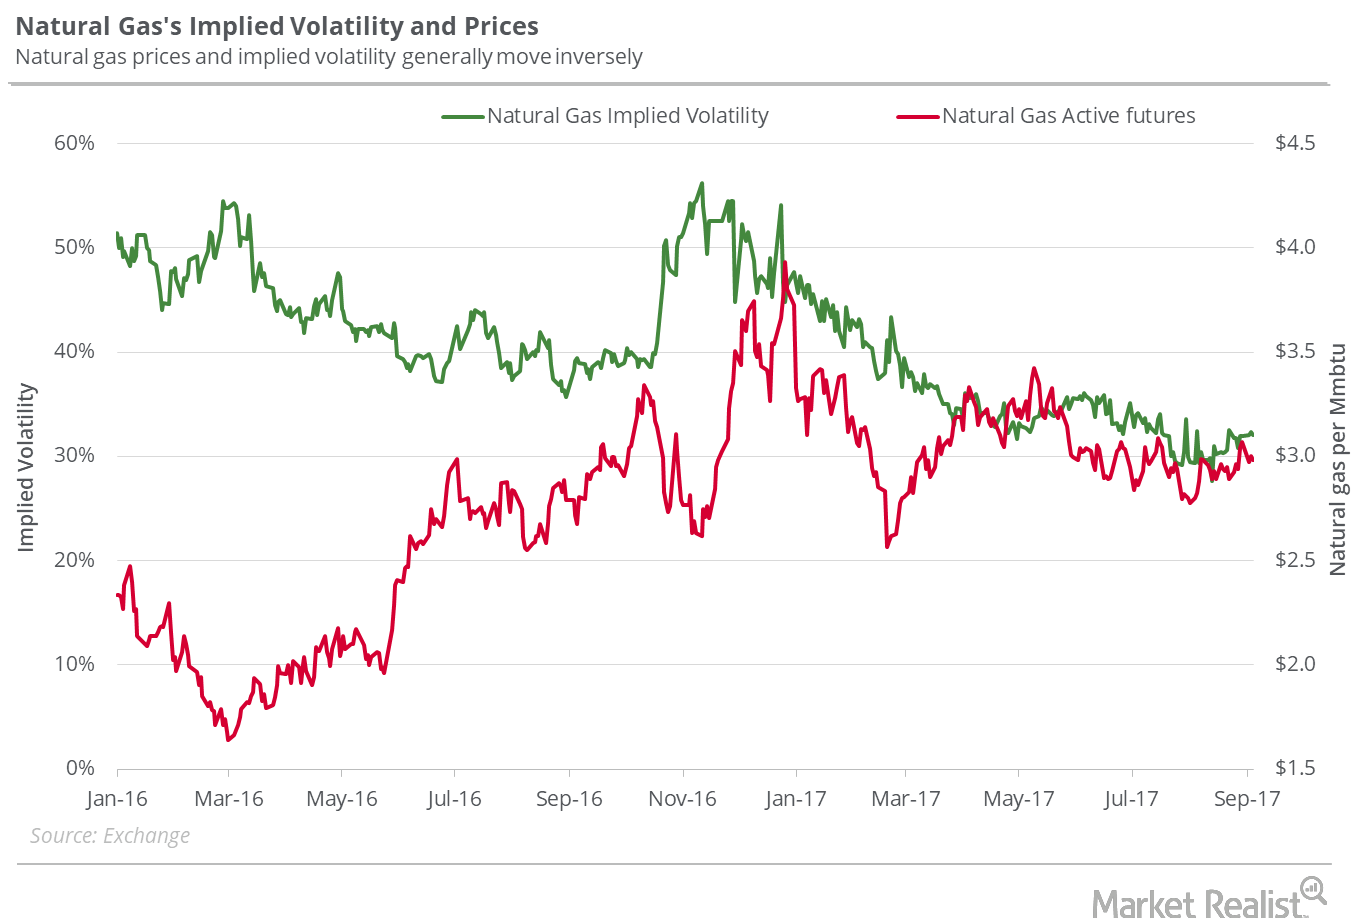
Where Natural Gas Prices Could Go Next Week
On September 21, 2017, natural gas implied volatility was 35.1%, or 5.1% above the 15-day average.

Natural Gas’s Rise: Why Gas-Weighted Stocks Are Underperforming
Between March 20, 2017, and March 27, 2017, natural gas futures contracts for May 2017 rose 1%. The commodity saw the small gain due to slightly bullish inventory data.

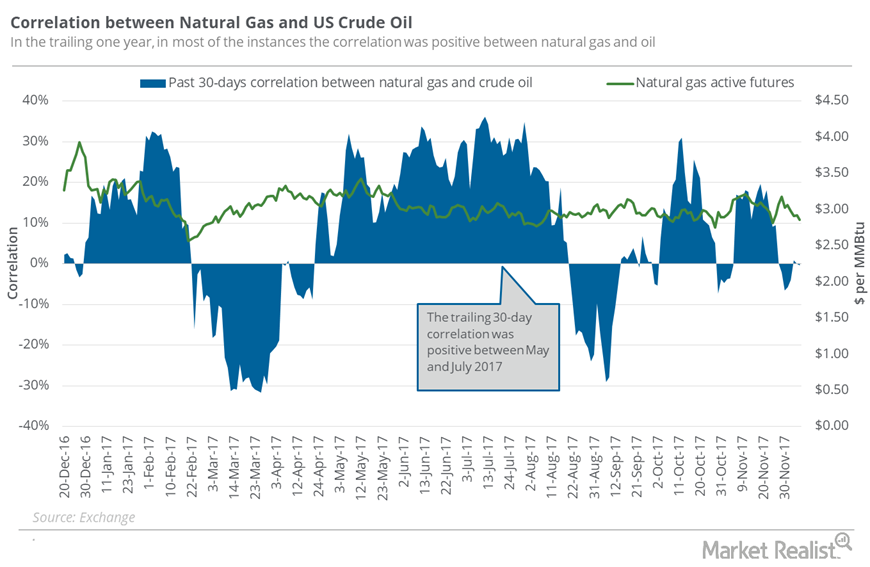
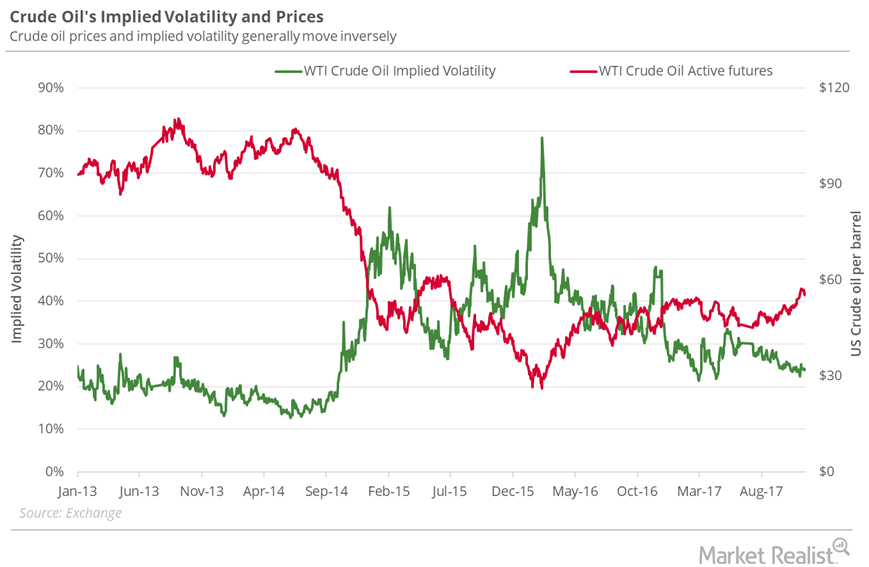
Does the Natural Gas Fall Relate to Oil’s Decline?
Between November 29 and December 6, natural gas (GASL)(GASX)(FCG) January 2018 futures had a correlation of -1.6% with US crude oil January futures.

Will Natural Gas Hold on to the $3 Level Next Week?
On August 31, 2017, natural gas (UNG) (BOIL) active futures’ implied volatility was 32%, which was 4.9% above its 15-day moving average.

Winter Weather and Inventories Could Impact Natural Gas Prices
Aegent Energy Advisors estimates that US natural gas prices are expected to trade below $3.27 per MMBtu this winter from November 2016 to March 2017.

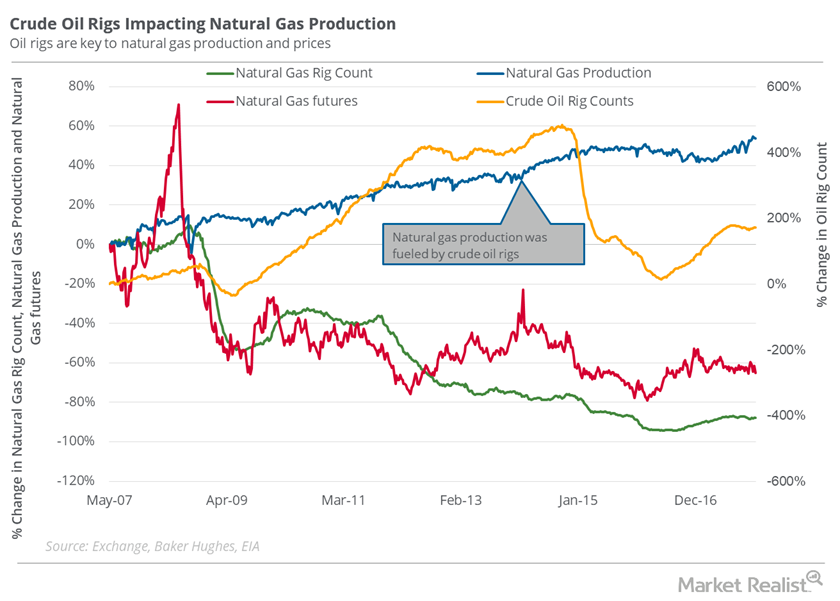
Natural Gas Traders Should Stay Cautious of Oil Rigs
On December 29, the natural gas rig count was 88.7% below its record high of 1,606 in 2008. However, natural gas supplies have risen drastically since 2008.

US Natural Gas Prices Hit a 2016 High: What’s Next?
Natural gas prices rose due to cold weather forecasts and the bullish US natural gas inventory report. Prices hit a 2016 and two-year high.

Could Natural Gas Reach a New 2017 Low Next Week?
Implied volatility On December 21, 2017, natural gas futures’ implied volatility was 42.4%. In the last trading session, their implied volatility was on par with the 15-day average. Supply-glut concerns pushed natural gas (UNG) (BOIL) futures to a 17-year low on March 3, 2016, with an implied volatility of 53.8%. From this multiyear low, natural gas prices […]

Natural Gas Rebound: Pick Gas-Weighted Stocks Carefully
On March 3, 2016, natural gas futures touched a 17-year low of $1.64. From March 3, 2016, to March 6, 2017, natural gas rose 76.8% on a closing price basis.

How Will Natural Gas Prices Move in November and Beyond?
US natural gas inventories are 4.6% above their five-year average. However, the surplus is shrinking.

Can Natural Gas Stay above $3 Next Week?
On November 30, 2017, natural gas’s implied volatility was 44.3%, about 1% above its 15-day average.

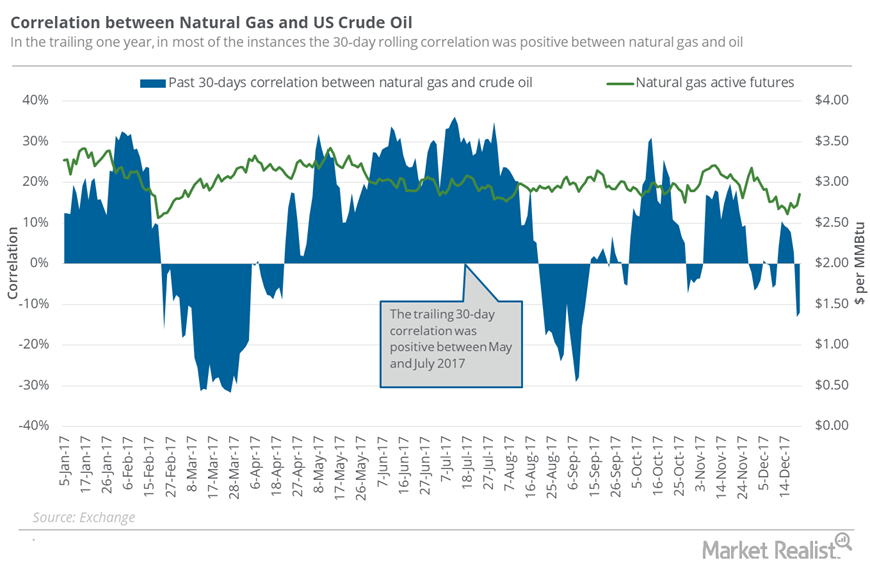
Is Natural Gas Moving with Oil Prices?
The correlation between natural gas (GASL)(GASX)(FCG) active futures with US crude oil active futures was 99.8% between December 12 and December 19.

The Rise or Fall of US Natural Gas Prices in 2Q17
As of April 6, 2017, US natural gas prices are above their 20-day, 50-day, 100-day, and 200-day moving averages. That suggests a bullish momentum for natural gas.

How UNG Looks Relative to Natural Gas Futures
UNG ended May 4, 2017, with a drop of ~0.50%, while natural gas futures fell 1.3%.

Analysts Are Bullish about US Natural Gas Prices in 2017
Aegent Energy Advisors estimates that US natural gas prices are expected to trade below $3.27 per MMBtu (million British thermal units) this winter.

Rise in Natural Gas Isn’t Good for Gas-Weighted Stocks
On March 3, 2016, natural gas futures touched a 17-year low. From March 3, 2016, to March 20, 2017, natural gas rose 85.4% on a closing price basis.

Which Gas-Heavy Stocks Outperformed amid Falling Natural Gas?
Between February 10, 2017, and February 17, 2017, natural gas futures contracts for March 2017 delivery fell 6.6%.

Natural Gas Prices Could Be Weak the Rest of 2016
Aegent Energy Advisors estimates that US natural gas prices won’t exceed $2.92 per MMBtu (million British thermal units) in December 2016.

Is UNG a Good Way to Track Natural Gas?
From March 16, 2017, to March 23, 2017, the United States Natural Gas ETF (UNG), which is designed to track active natural gas futures, rose 5.7%.

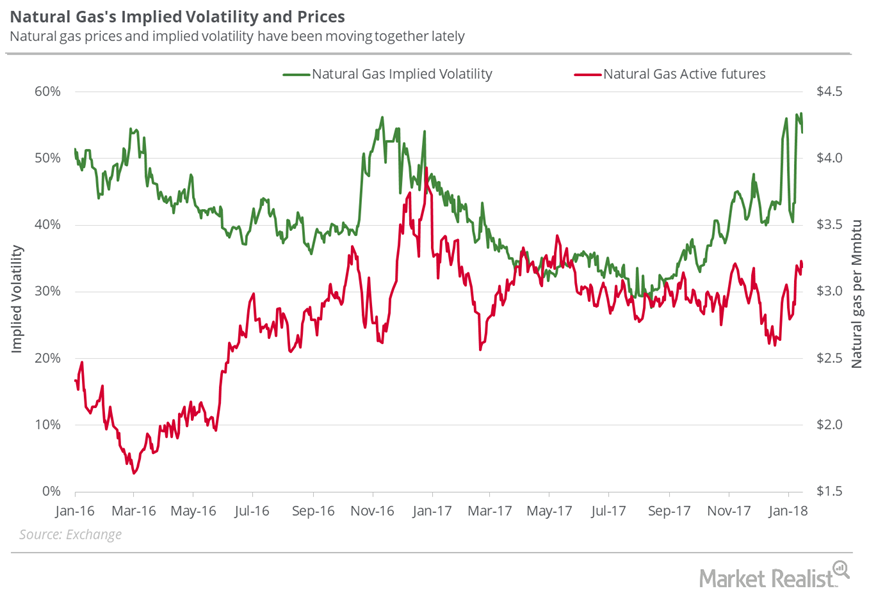
What to Expect from Natural Gas Next Week
On January 18, 2018, natural gas’s implied volatility was 53.9%, 10.2% above its 15-day average.

Why US Natural Gas Traders Are Tracking OPEC’s Production
Baker Hughes, a GE company, released its weekly US natural gas rigs report on January 19, 2018. Natural gas rigs increased by two to 189 on January 12–19.

Will US Natural Gas Futures Fall More?
US natural gas (GASL) futures contracts for January delivery were below their 20-day, 50-day, and 100-day moving averages on December 14, 2017.

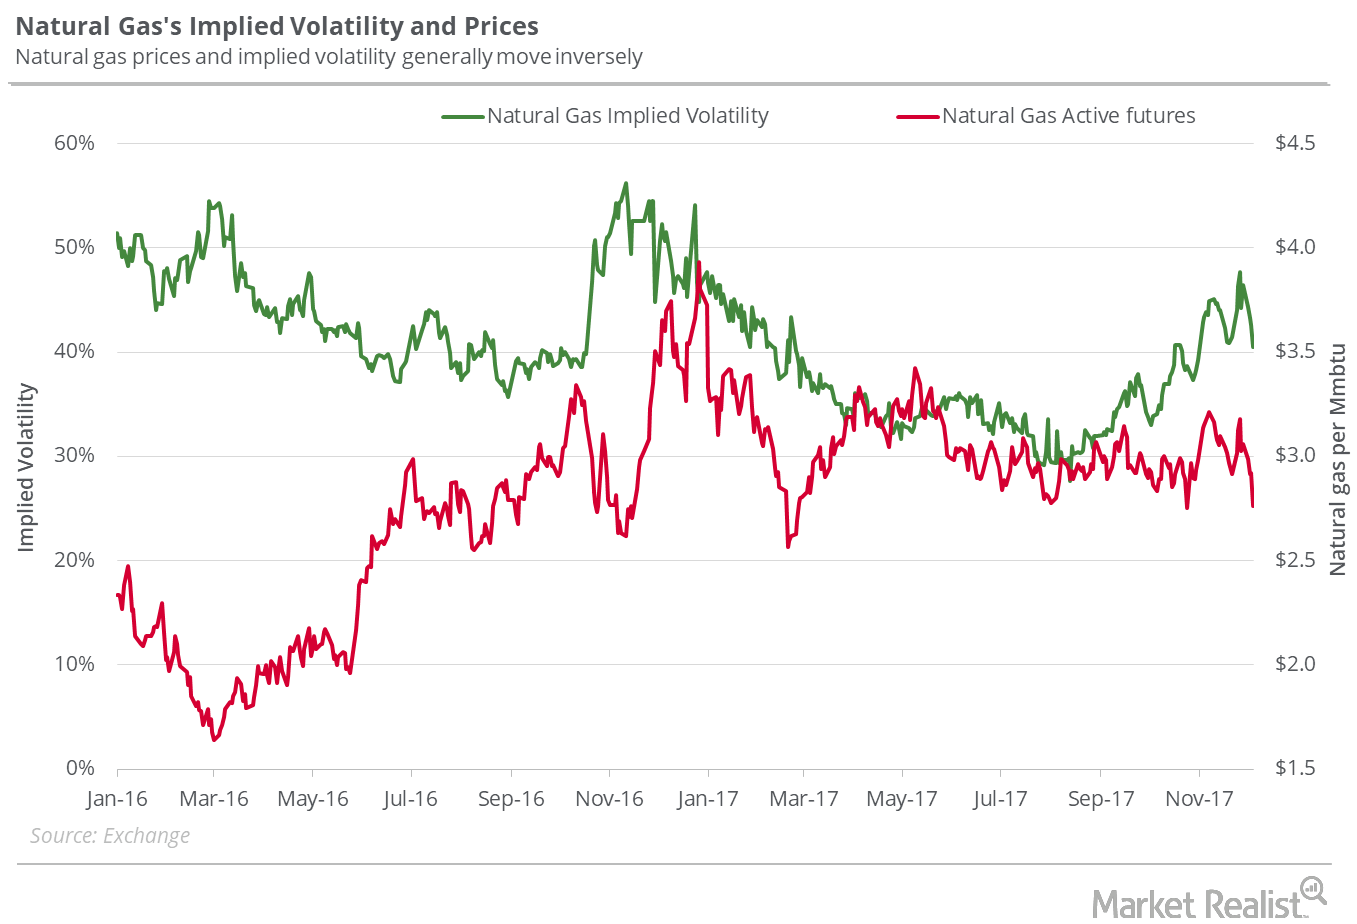
Possibilities for Natural Gas Prices Next Week
On December 7, 2017, natural gas’s implied volatility was 40.5% or ~7.5% less than its 15-day average. On November 29, the implied volatility rose to 47.7%.

NYMEX Natural Gas Prices: Long-Term Forecasts
US natural gas inventories are currently 11% higher than their five-year average. High natural gas inventories could weigh on US natural gas prices.

US Natural Gas Futures Recovered from a 3-Month Low
NYMEX natural gas (GASL) (DGAZ) futures contracts for July delivery rose 4.3% and settled at $3.06 per MMBtu (million British thermal units) on June 15.

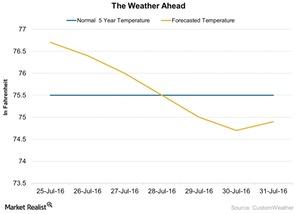
What to Expect from the Weather Forecast and Natural Gas Prices
On July 21, the EIA announced a 34 Bcf (billion cubic feet) addition to natural gas (UNG) (GASL) (GASX) (BOIL) inventory levels for the week ending July 15.

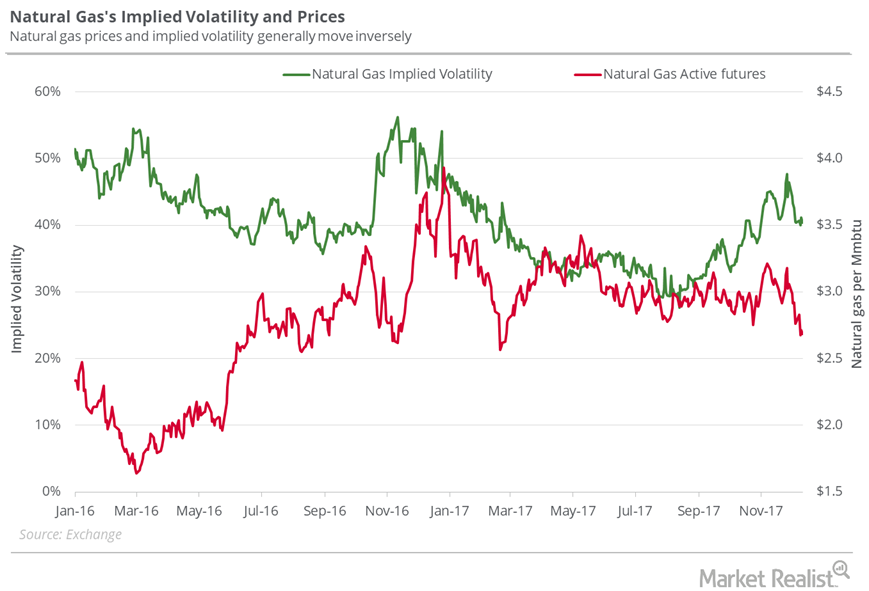
Could Natural Gas Hit a New 2017 Low Next Week?
On December 14, 2017, the implied volatility of natural gas futures was 40.4%. It was ~5.9% below its 15-day average.

What’s the Natural Gas Price Forecast for 2016 and 2017?
The EIA forecast that the US natural gas supply and demand gap will be 4.1 Bcf per day in 2016 and 4.4 Bcf per day in 2017.

Will Natural Gas Reclaim $3 Next Week?
On October 12, 2017, natural gas implied volatility was 35.9%, 1.7% above its 15-day average.

US Natural Gas Price Forecast for 2017 and Beyond
World Bank forecast that US natural gas prices will average $2.30 per MMBtu in 2016, $3.00 per MMBtu in 2017, and $3.50 per MMBtu in 2018.

Analyzing Gas-Heavy Stocks amid Falling Natural Gas Prices
From February 17–27, 2017, natural gas futures contracts for April 2017 delivery fell 8.8%. On March 3, 2016, natural gas futures touched a 17-year low.

Blame Canada: Why Natural Gas Supplies Rose
Market intelligence company PointLogic reported that natural gas supplies rose by 0.6% to 80.2 Bcf (billion cubic feet) per day between June 16 and June 22.

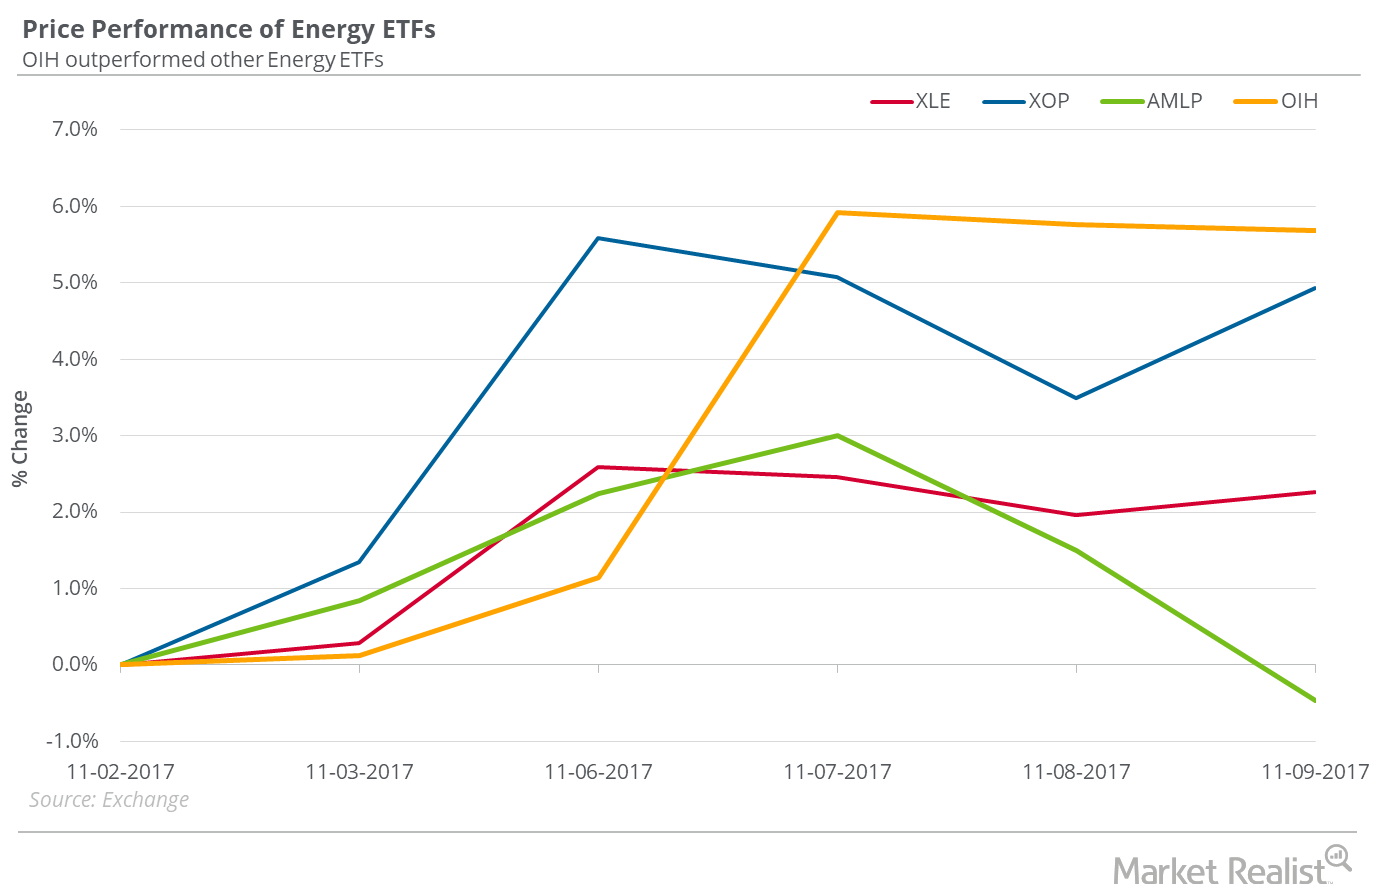
Natural Gas Could Reach the $3.4 Mark Next Week
On November 9, 2017, natural gas had an implied volatility of 43.5%—9.4% more than its 15-day average. Natural gas active futures settled at $3.2 per MMBtu.

US Natural Gas Futures Could Continue to Fall
Hedge funds’ net long positions in US natural gas futures (UGAZ) (UNG) and options contracts were at 5,318 for the week ending January 2, 2018.

S&P 500 and US Natural Gas Futures Next Week
NYMEX natural gas futures contracts for March delivery fell 0.27% to $2.58 per MMBtu on February 15, 2018.

Markets Crash in 1Q – April Fool’s
Decent earnings combined with low expectations are fueling rally after rally – not to mention the ever elusive promise of a China deal.

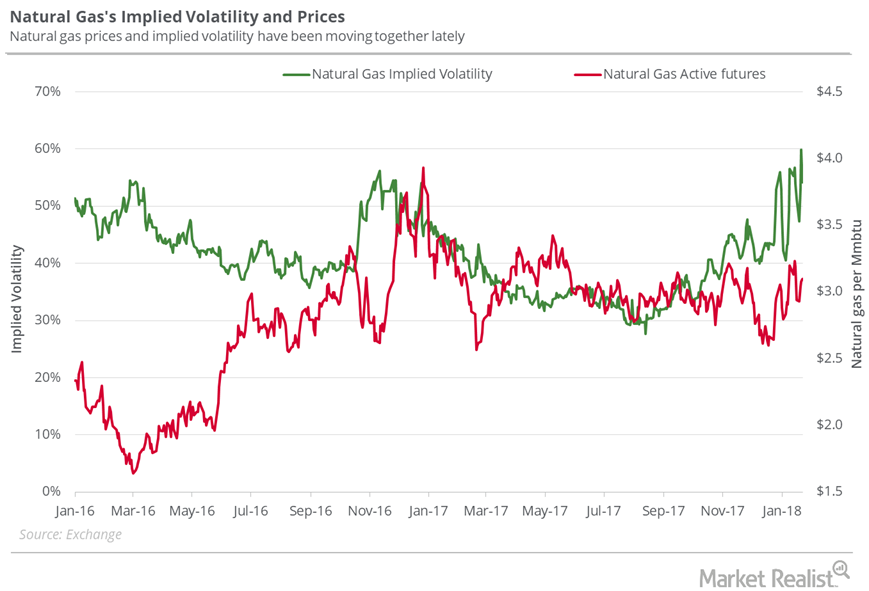
Where Could Natural Gas Prices Close Next Week?
On January 25, 2018, natural gas’s implied volatility was at 54.8%, 8% above its 15-day average.

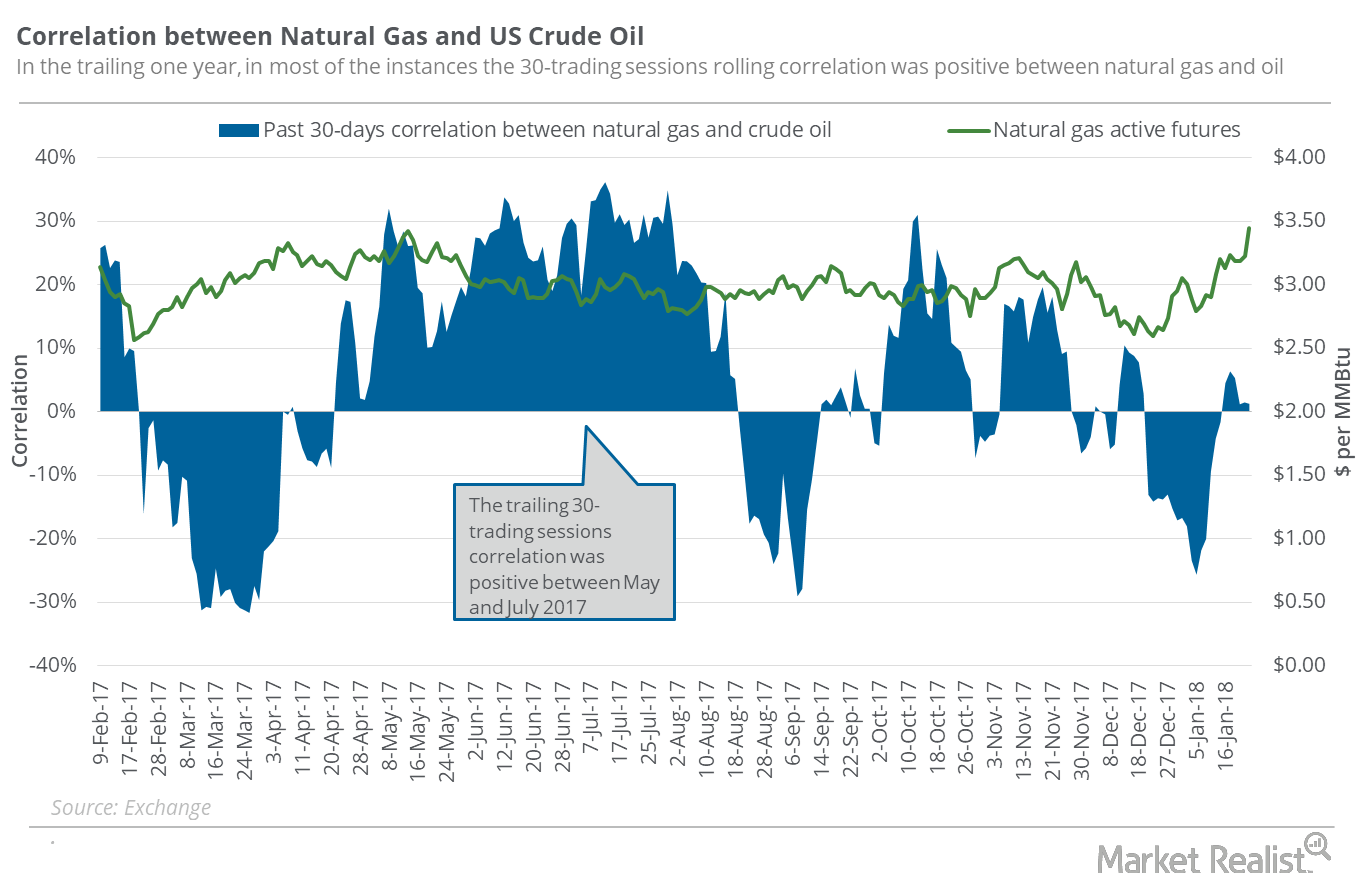
Does Natural Gas’s Rise Depend on Crude Oil?
Between January 16 and January 23, 2018, natural gas (GASL) (UNG) (FCG) had a correlation of 84.6% with US crude oil (OIIL) (USL) (DBO) active futures.

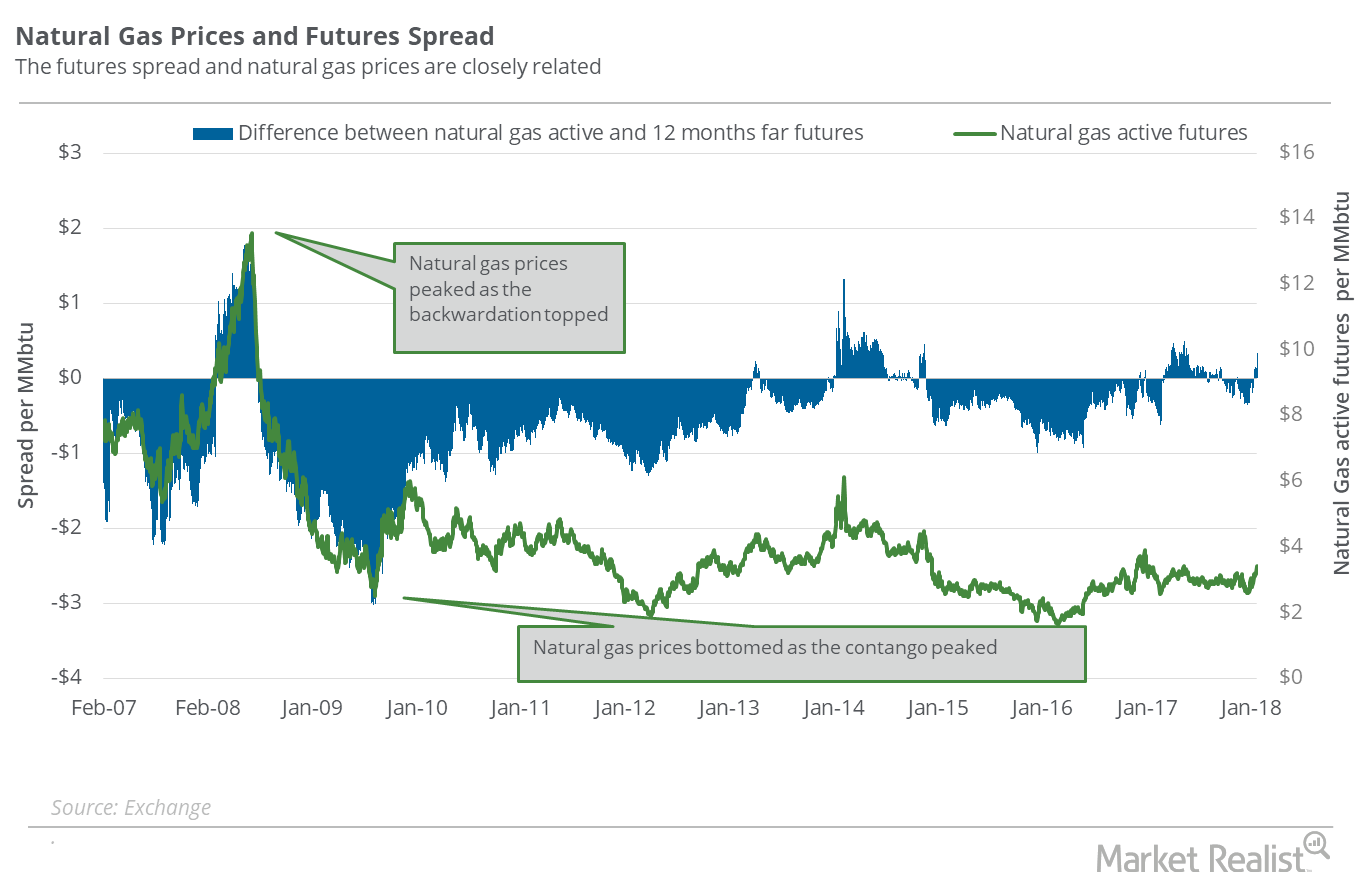
Is Natural Gas Pricing in Colder Weather?
On January 23, 2018, natural gas February 2018 futures settled $0.34 above February 2019 futures.

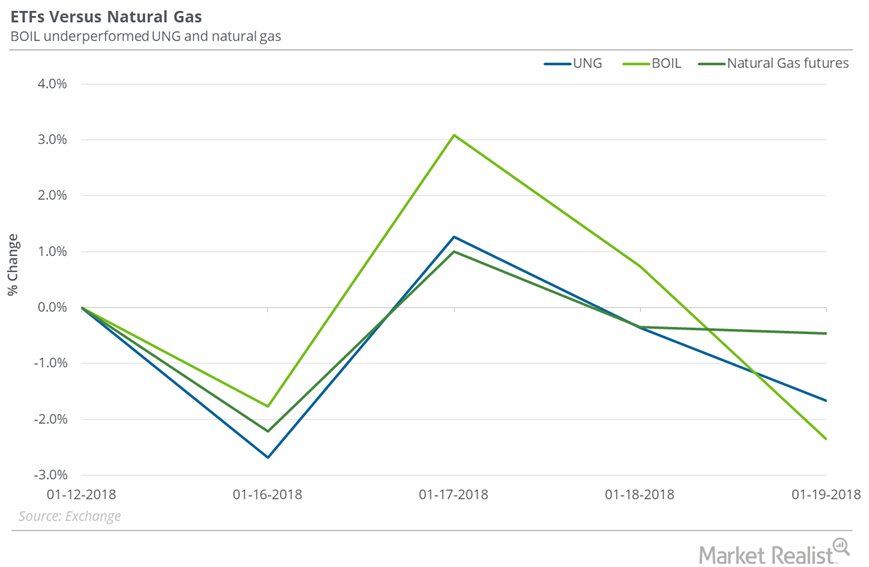
How Natural Gas ETFs Performed Last Week
Between January 12 and January 19, 2018, the United States Natural Gas ETF (UNG), an ETF that has exposure to natural gas futures, fell 1.7%.

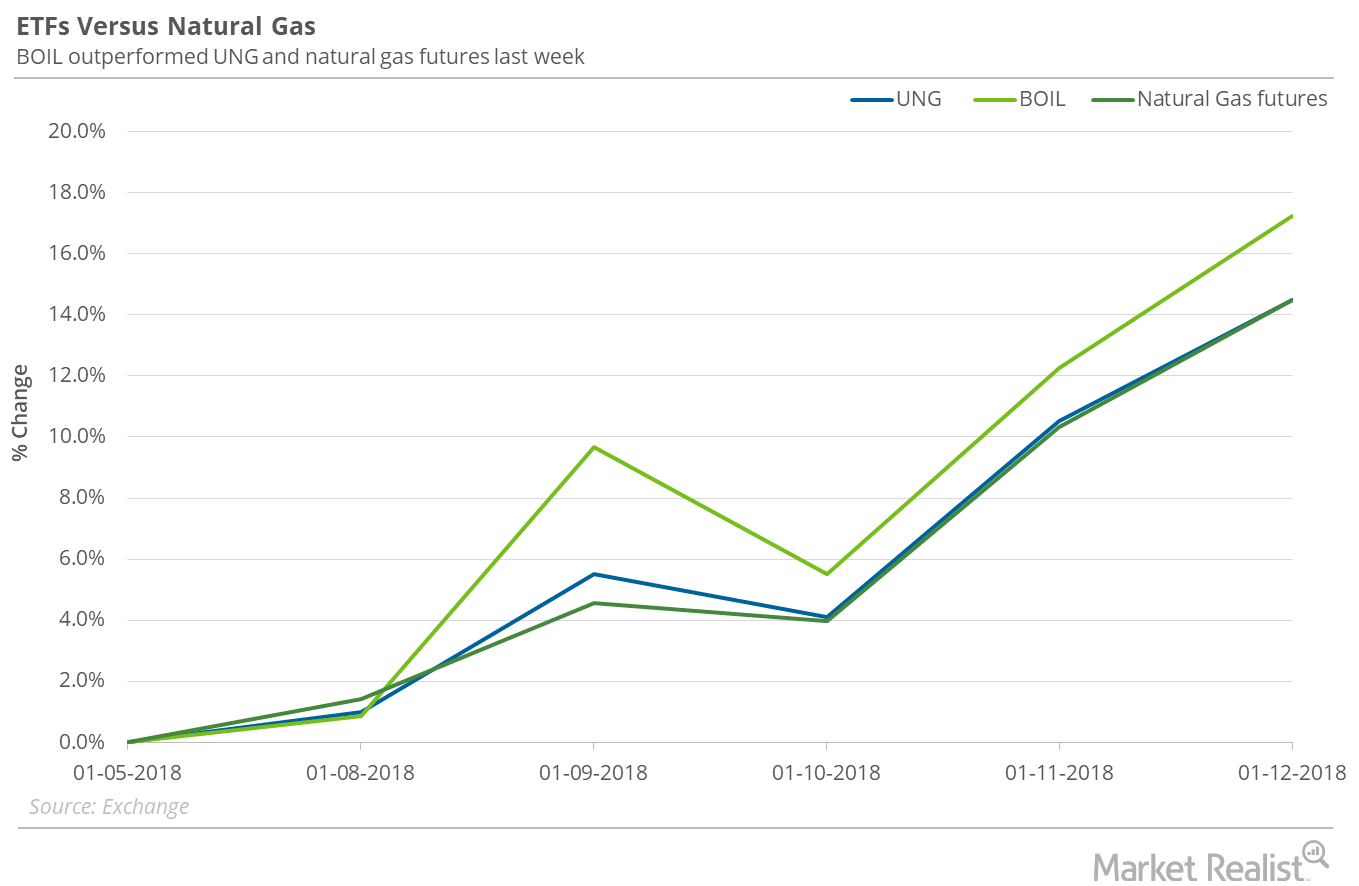
How Natural Gas ETFs Are Reacting to Spike in Natural Gas
Between January 5 and January 12, 2018, the United States Natural Gas ETF (UNG), which holds positions in active natural gas futures, gained 14.5%.

Is $3.30 Possible for Natural Gas Next Week?
On January 11, 2018, natural gas’s implied volatility was 49.1%. That’s 7% above its 15-day average.

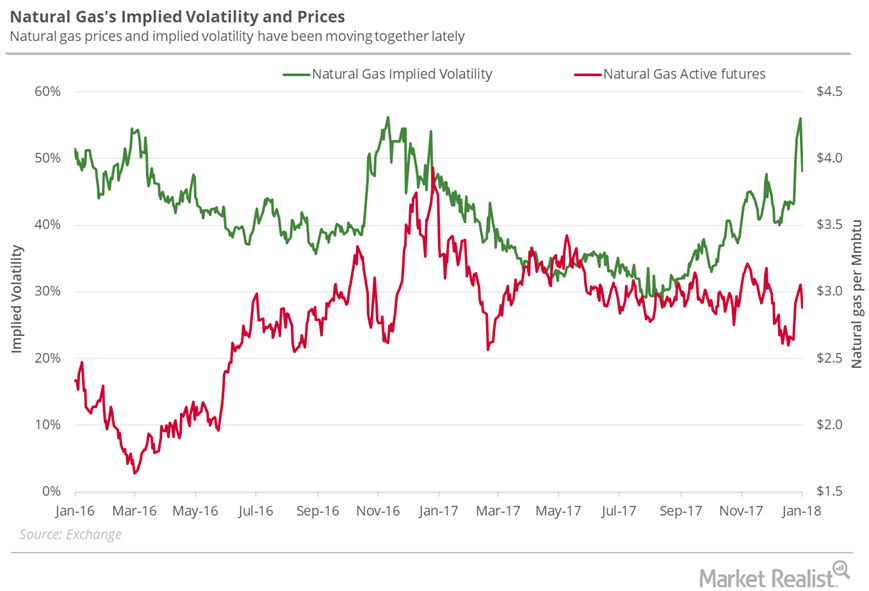
Possible Downside in Natural Gas Next Week
On December 21, 2017, natural gas prices closed at the lowest closing level since February 23, 2017. Since that day, natural gas futures have risen 11.1%.

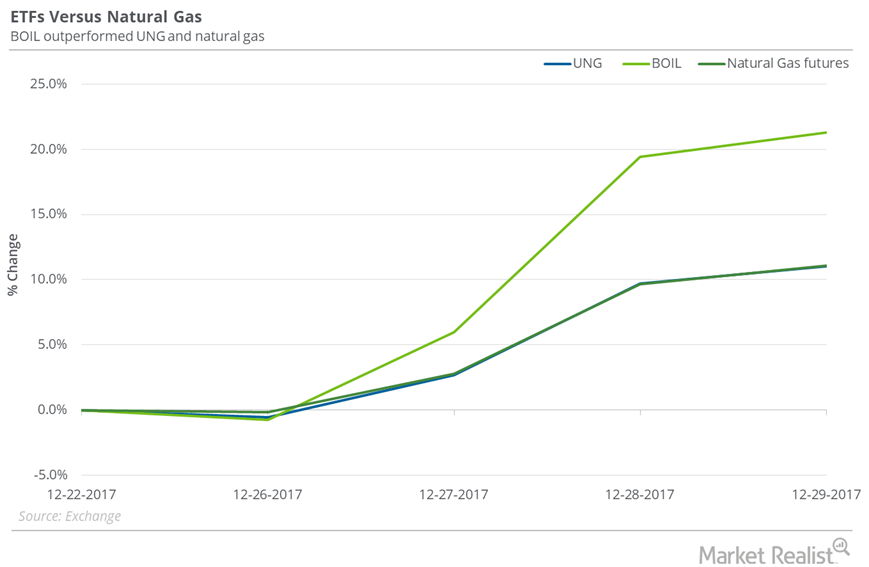
Natural Gas ETFs to Watch in 2018
On December 29, 2017, the closing prices of natural gas futures contracts between March 2018 and May 2018 were progressively lower.

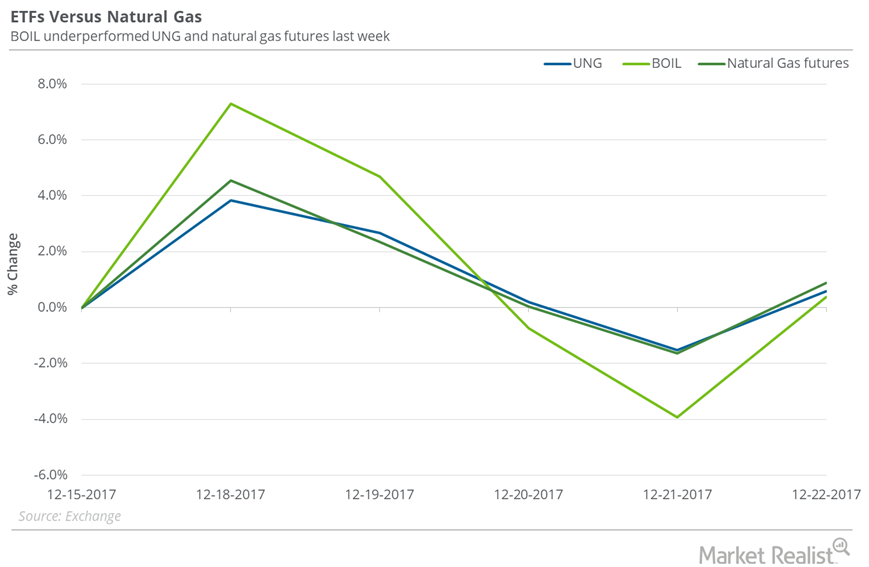
Natural Gas Returns and Natural Gas ETFs
From December 15–22, 2017, the United States Natural Gas Fund (UNG) rose 0.6%.

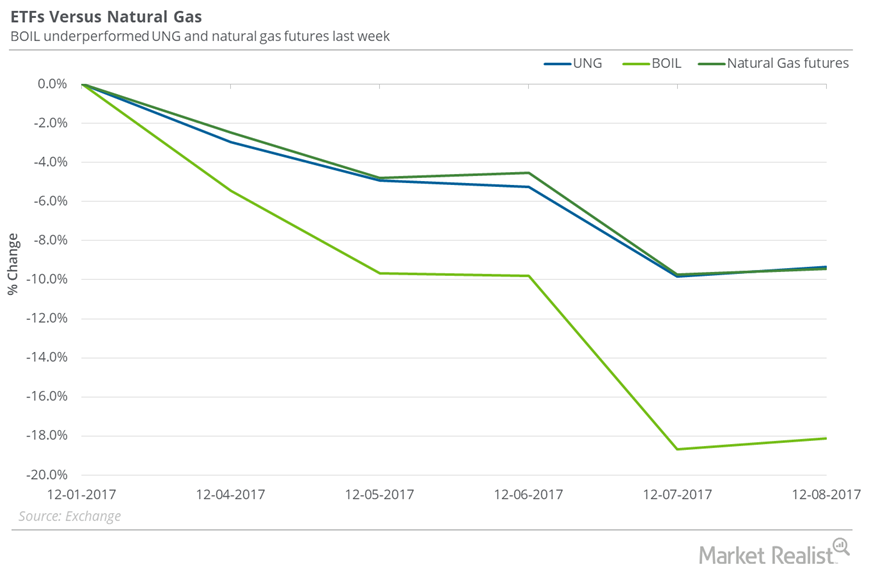
Natural Gas: Fall Impacts Natural Gas ETFs
On December 1–8, 2017, the United States Natural Gas Fund (UNG), which holds near-month natural gas futures contracts, fell 9.3%.

Is US Natural Gas Production Helping Natural Gas Bears?
US dry natural gas production fell by 0.5 Bcf per day or 0.7% to 76.2 Bcf per day on November 30–December 6, 2017, according to PointLogic.

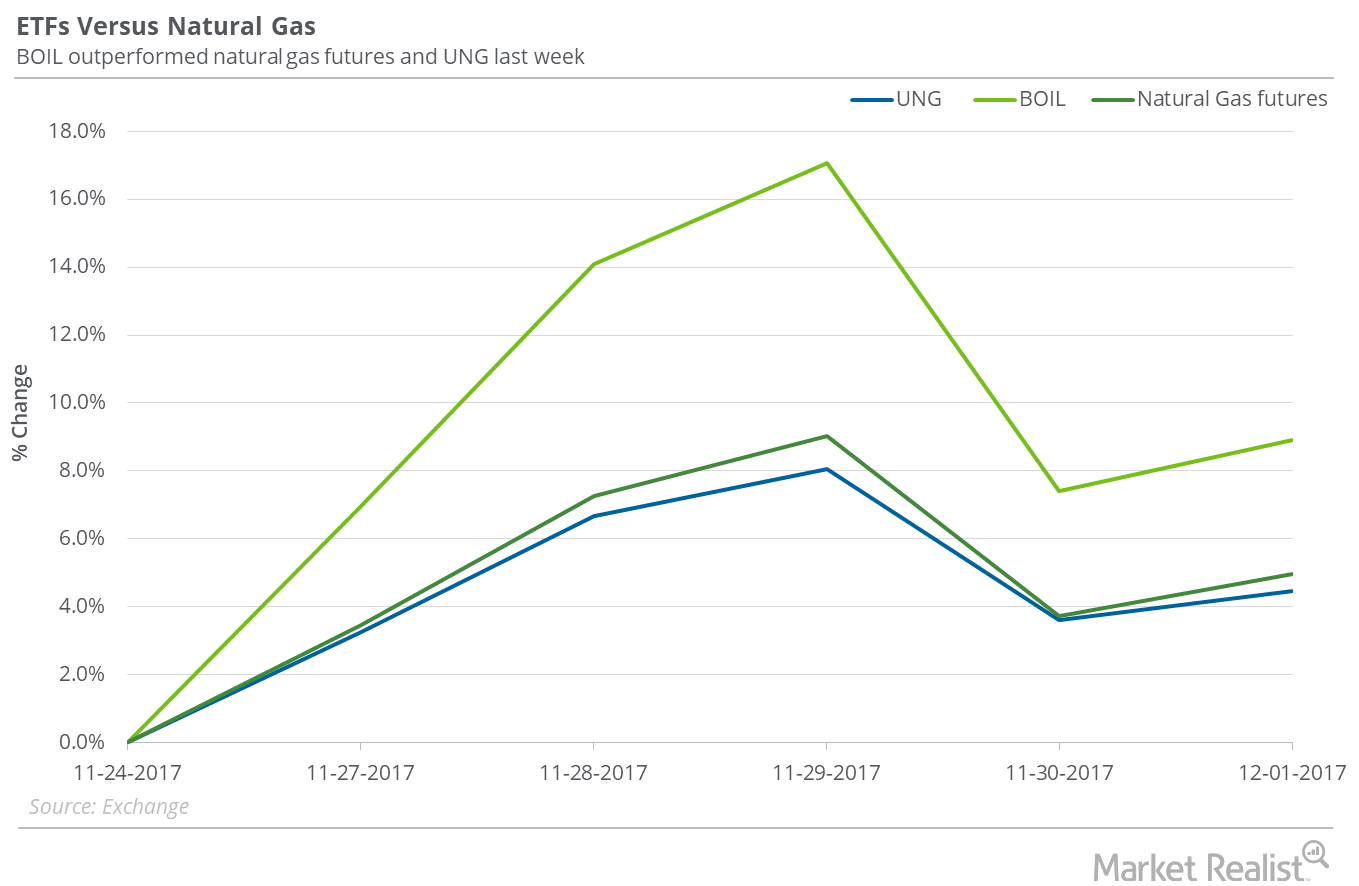
Rise in Natural Gas Impacts Natural Gas ETFs
On November 24–December 1, 2017, the United States Natural Gas Fund (UNG), that follows near-month natural gas futures contracts, rose 4.5%.

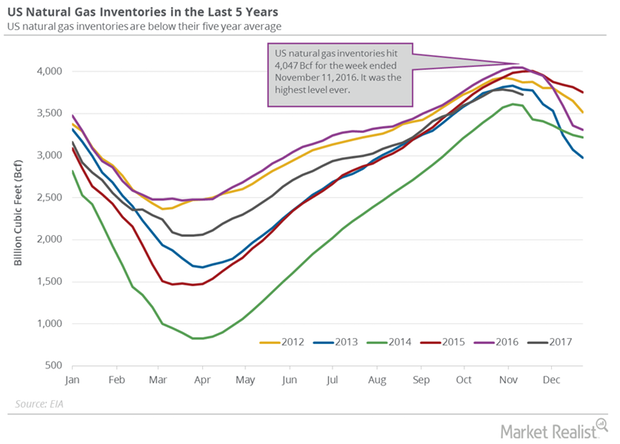
US Natural Gas Future Fell after the Natural Gas Inventory Report
The EIA released its natural gas inventory report on November 30, 2017. US natural gas inventories fell by 33 Bcf to 3,693 Bcf on November 17–24, 2017.

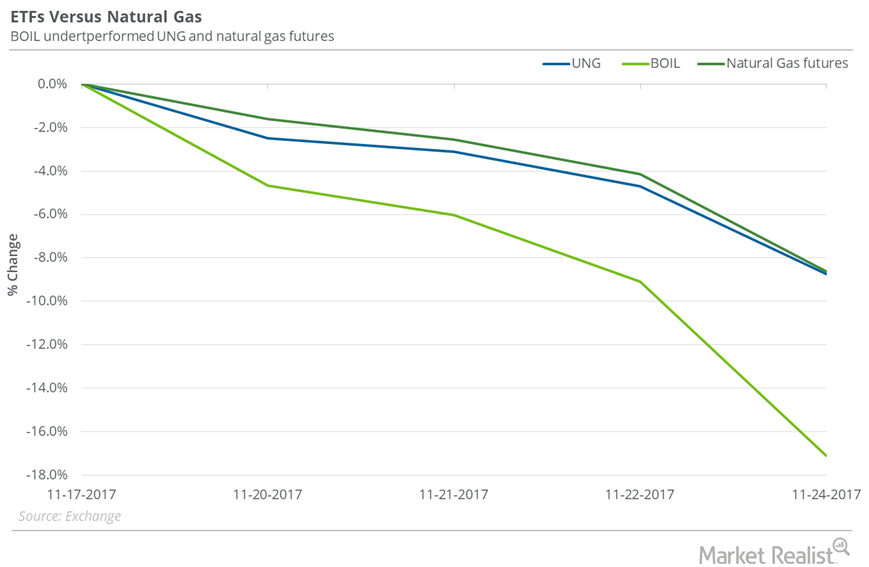
How Are Natural Gas ETFs Adjusting to Fall in Natural Gas Prices?
Between November 17 and November 24, 2017, the United States Natural Gas Fund LP (UNG) fell 8.8%.

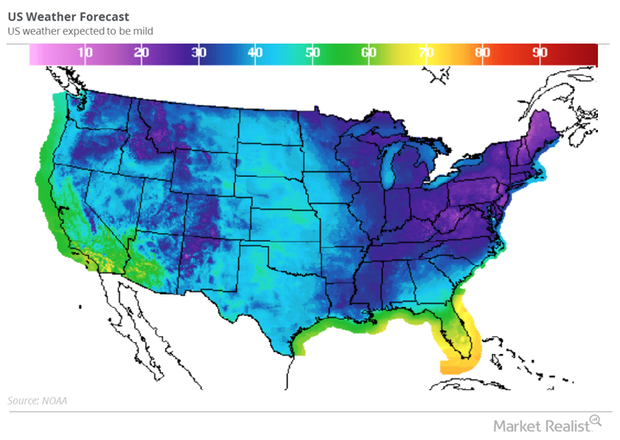
Weather Impacts the US Natural Gas Market
January US natural gas (DGAZ) (UNG) futures contracts fell 1.4% to $3.01 per MMBtu in electronic trading at 1:05 AM EST on November 24, 2017.

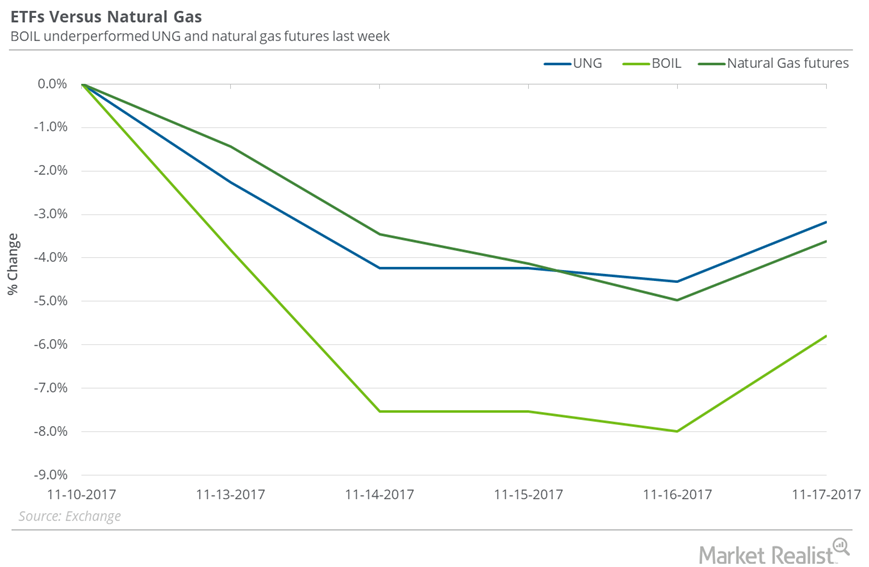
Are Natural Gas ETFs Doing Any Better than Natural Gas?
Between November 10 and November 17, the United States Natural Gas Fund LP (UNG) fell 3.2% while natural gas active futures fell 3.6%.

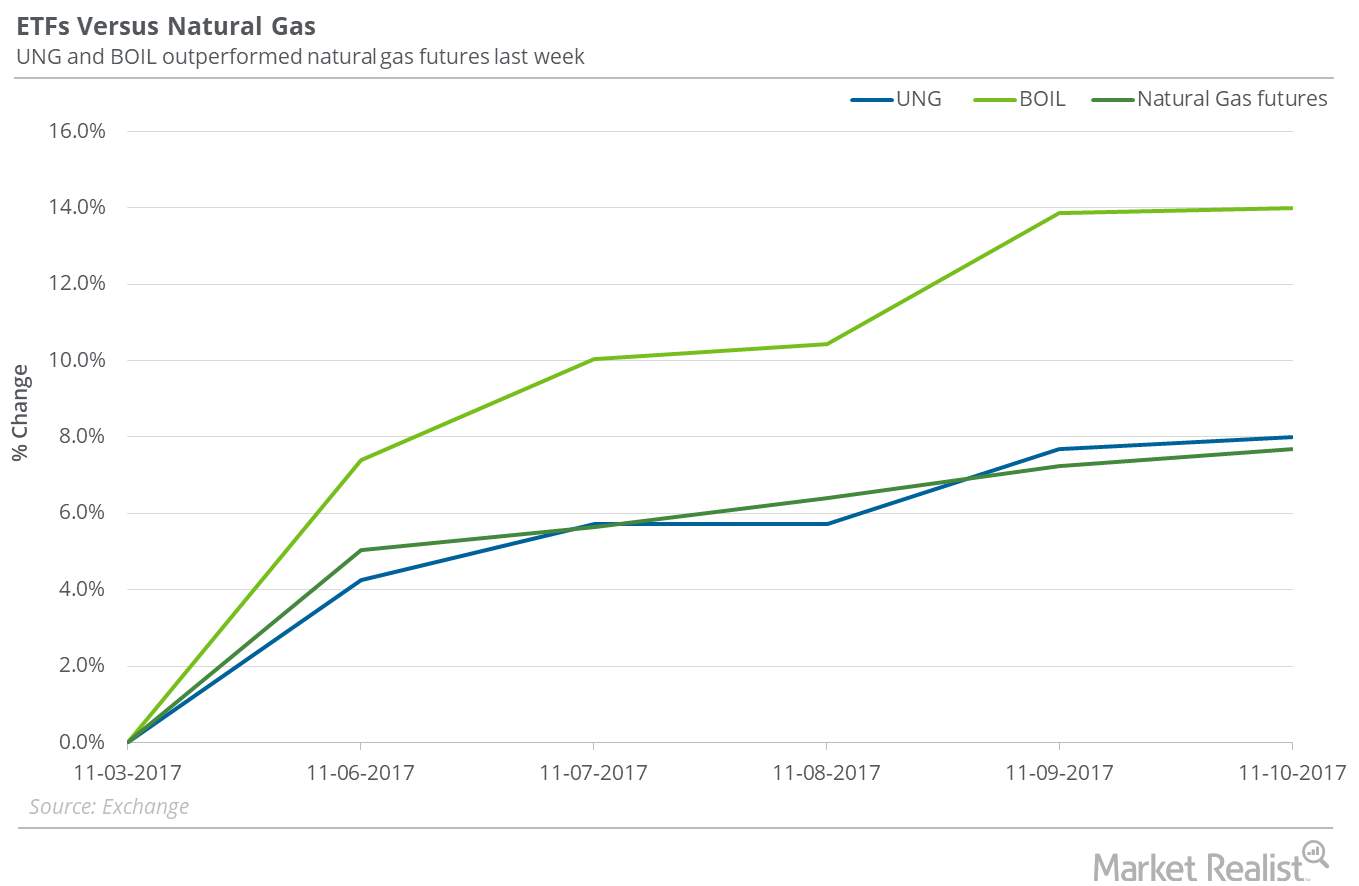
Did Natural Gas ETFs Outperform Natural Gas Last Week?
Between November 3 and November 10, 2017, the United States Natural Gas Fund LP (UNG) rose 8%, only 30 basis points above the gain in natural gas December futures.

US Natural Gas Consumption Could Surpass Production
US natural gas consumption rose by 8.1 Bcf (billion cubic feet) per day to 64.5 Bcf per day on October 26–November 1, 2017.

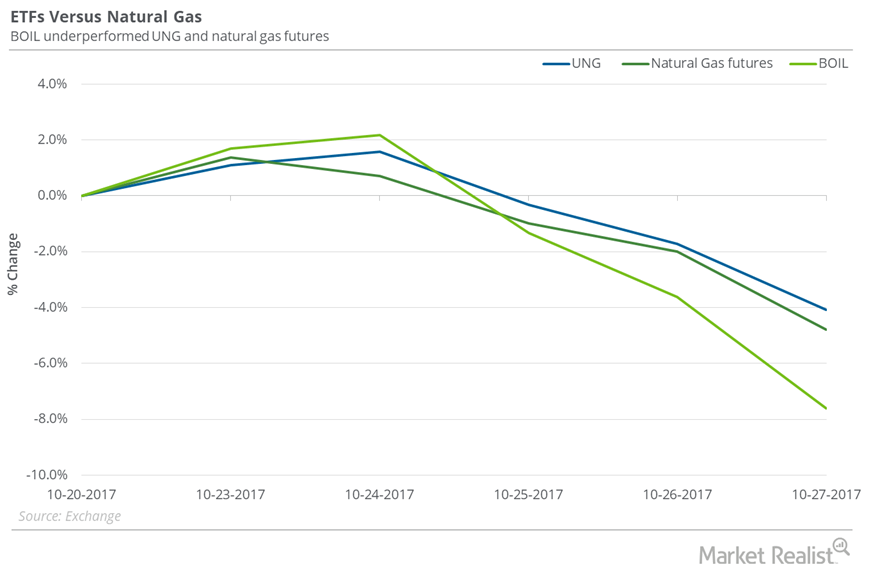
Natural Gas versus Natural Gas ETFs Last Week
On October 20–27, natural gas (FCG) (GASL) (GASX) December futures fell 4.8%. During this period, the United States Natural Gas Fund LP (UNG) fell 4.1%.

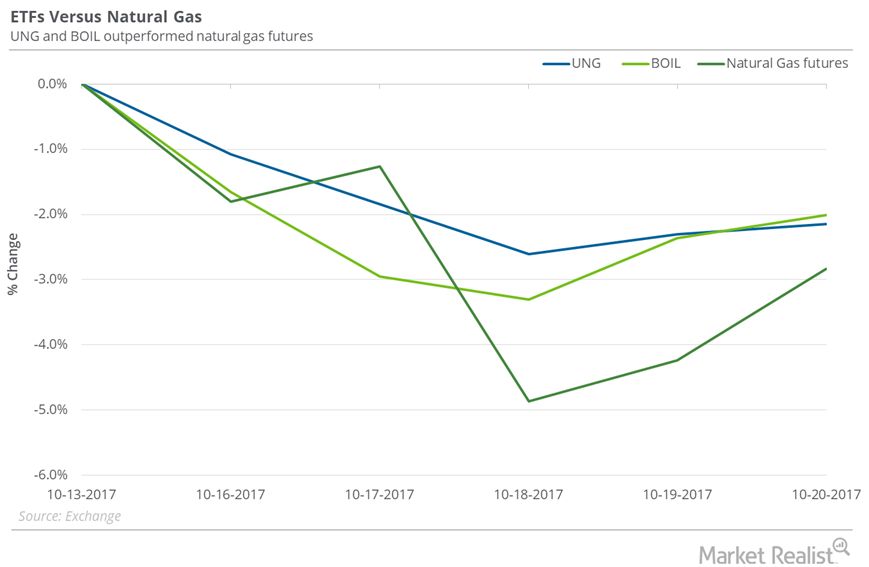
Where Natural Gas ETFs Stood next to Natural Gas Last Week
Between October 13 and October 20, 2017, the United States Natural Gas Fund LP (UNG) fell 2.2%, and natural gas November futures fell 2.8%.

Will Natural Gas Fall to $2.7 Levels Next Week?
On October 19, 2017, natural gas futures’ implied volatility was 38.8%, 9.6% above its 15-day average.

US Natural Gas Production’s 22-Month High: Will Prices Collapse?
US dry natural gas production rose by 3 Bcf (billion cubic feet) per day to 75.9 Bcf per day in July 2017—compared with the previous month.

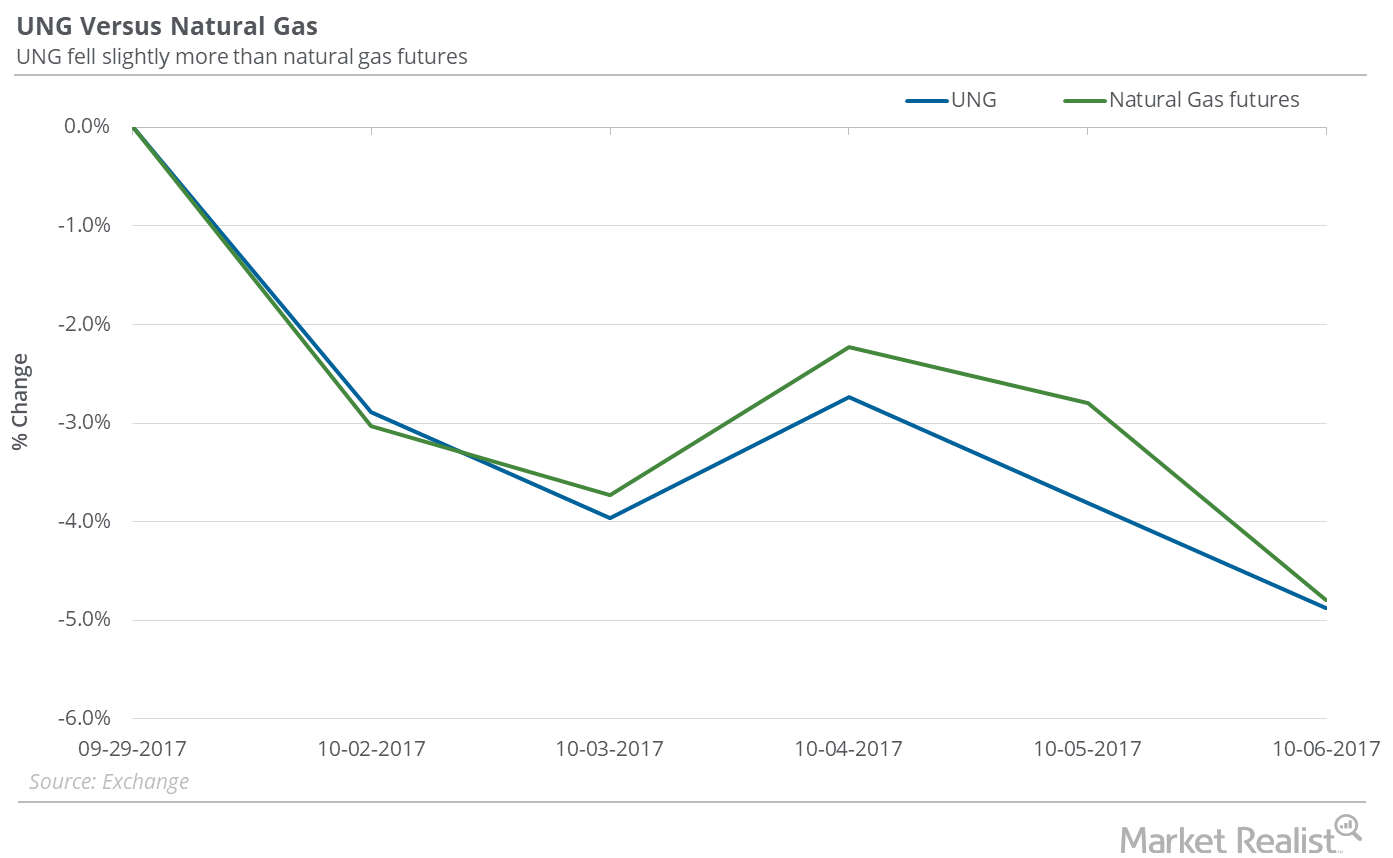
Did UNG Outperform Natural Gas in the Week Ended October 6?
Between September 29 and October 6, 2017, the United States Natural Gas Fund ETF (UNG) fell 4.9%, while natural gas (BOIL) (GASX) November futures fell 4.8%.

Could Natural Gas Fall below the $2.8 Mark Next Week?
On October 5, 2017, the implied volatility of US natural gas active futures was at 33.1%, or 7.3% below the 15-day average.

How UNG Fared Compared to Natural Gas Last Week
On September 22–29, 2017, the United States Natural Gas Fund LP (UNG) rose 0.2%, while natural gas (BOIL) November futures fell 0.5%.

How Weather Is Affecting US Natural Gas Futures
US natural gas (DGAZ)(UGAZ) futures contracts fell 0.3% to $3.00 per MMBtu (million British thermal units) in electronic trading at 2:00 AM EST today.

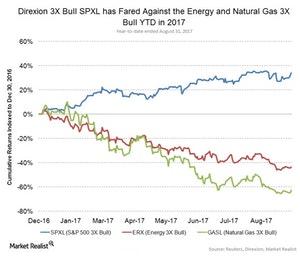
Should Energy Stocks Go in Your Back-to-School Shopping Basket?
The energy sector, as tracked by the Energy Select Sector SPDR Fund (XLE), has lost ~17.0% year-to-date as of August 31.

Why US Natural Gas Inventories Are above their 5-Year Average
On September 14, the EIA (U.S. Energy Information Administration) released its weekly US natural gas inventory report.

Natural Gas Could Regain the $3 Mark Next Week
In the next seven days, natural gas October futures could close between $2.85 and $3.11 per MMBtu (million British thermal units).

Why US Natural Gas Production Fell from a 10-Month High
The EIA estimates that monthly US dry natural gas production fell by 1.36 Bcf (billion cubic feet) per day or 1.8% to 72.9 Bcf per day in June 2017.

US Natural Gas Futures Are near a 5-Week High
October natural gas (BOIL) (UNG) futures contracts trading on NYMEX rose 2% to $3.04 per MMBtu (million British thermal units) on August 31, 2017.

US Natural Gas Production Is near a 2-Year Low
The EIA estimates that monthly US dry natural gas production fell by 2.37 Bcf per day, or 3.2%, to 71.6 Bcf per day in April 2017—compared to March 2017.

Slowing Natural Gas Inventories Could Drive Prices
The EIA reported that US natural gas inventories rose by 57 Bcf (billion cubic feet) to 2,945 Bcf on June 30–July 7, 2017.

What to Expect from Natural Gas this Summer
So what are the returns for natural gas in the summer? Again, these numbers look pretty bleak until late summer.

Why the Natural Gas Inventory Spread Supports Its Recent Recovery
In the week ended June 16, 2017, natural gas inventories rose 61 Bcf (billion cubic feet) to 2,770 Bcf based on EIA data released on June 22, 2017.

Natural Gas Inventories Spread: Savior for Natural Gas Bulls?
The EIA reported that natural gas inventories rose by 78 Bcf (billion cubic feet) to 2,709 Bcf in the week ending June 9, 2017.

What’s in the Natural Gas Inventory Spread—Bears?
In the week ended June 2, 2017, natural gas inventories rose by 106 Bcf.

Chart in Focus: The Natural Gas Inventory Spread
Between January 27–June 7, 2017, natural gas active futures fell 10.9%. Natural gas inventories moved above their five-year average in the week ended January 27, 2017.

Why the Inventory Spread Could Make Natural Gas Bulls Happy
On a week-over-week basis, natural gas inventories rose by 75 Bcf (billion cubic feet) and were at 2,444 Bcf for the week ended May 19, 2017.

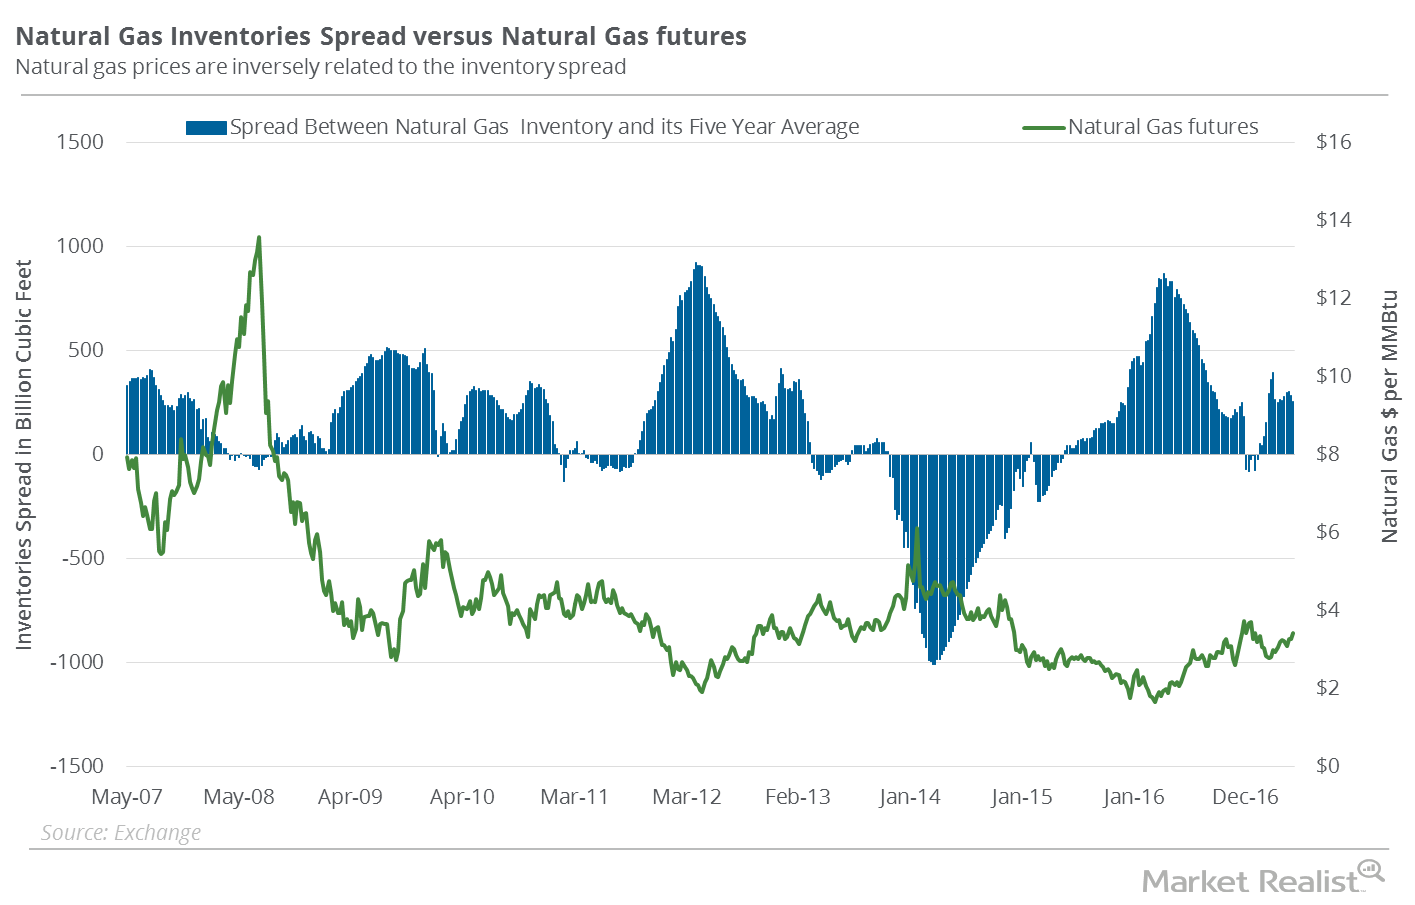
Natural Gas Inventory Spread Is Falling: Will Gas Prices Soar?
According to EIA data announced on May 18, there was an addition of 68 Bcf to natural gas (GASX) (FCG) (GASL) inventories for the week ending May 12, 2017.

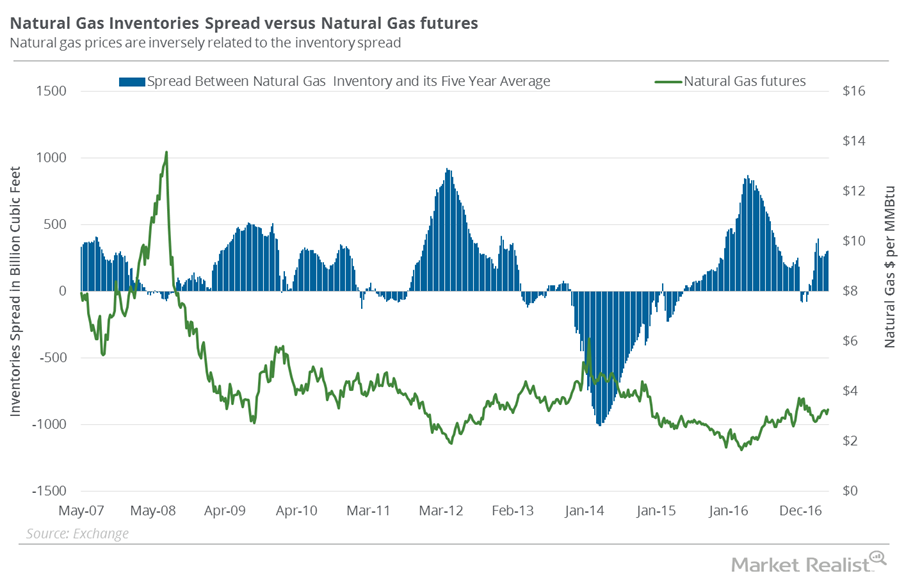
Is the Natural Gas Inventory Spread Optimistic?
According to data from the EIA on May 4, natural gas (GASX) (FCG) (GASL) inventories rose by 67 Bcf (billion cubic feet) during the week ending April 28.

The Natural Gas Inventory Spread: Another Bearish Indicator?
According to data from the EIA released on April 27, 2017, natural gas inventories rose 74 Bcf (billion cubic feet) during the week ended April 21, 2017.

Natural Gas Inventories Spread: What Investors Should Know
According to data from the EIA released on April 20, 2017, natural gas (GASX) (FCG) (GASL) inventories rose by 54 Bcf during the week ending April 14, 2017.

Is the Falling US Dollar Supporting Natural Gas?
Between April 12 and April 19, 2017, natural gas (GASX) (FCG) (GASL) May futures fell 0.1%.

Inventories Spread: Will Natural Gas Prices Fall Again?
Natural gas (GASX) (FCG) (GASL) inventories rose by ten Bcf (billion cubic feet) during the week ending April 7, 2017.

How the US Dollar Is Affecting Natural Gas Prices
Between March 29 and April 5, 2017, natural gas (GASX) (FCG) (GASL) May futures rose 1.1%.

US Dollar Could Impact Natural Gas Prices
Between March 22 and March 29, 2017, natural gas (GASX) (FCG) (GASL) May futures rose 5.4%. The US dollar rose 0.3% during that period.

Natural Gas Inventories and Why They’re Bearish for Prices
According to data from the EIA released on March 16, 2017, natural gas inventories fell by 53 Bcf during the week ending March 10, 2017.

Will Cold Weather Forecasts Boost Natural Gas Prices?
The latest weather reports suggest that cold weather will persist for a few days in the northern and eastern parts of the US.

Analyzing US Natural Gas Inventories: Week Ending February 24
The EIA estimates that US natural gas inventories will be at 1,805 Bcf by the end of March 2017—3.7% higher than the five-year average.

What Contango Could Mean for Natural Gas Traders
Active natural gas futures are currently trading at a discount of $0.56 to the futures contracts 12 months ahead. The situation is called “contango.”

Decoding Natural Gas Inventories: Week Ending February 3
US natural gas inventories are at 2,559 Bcf for the week ending February 3, 2017—11.3% lower than the same period in 2016.

Is UNG Underperforming Natural Gas Prices?
From February 2, 2017, to February 9, 2017, the United States Natural Gas Fund (UNG) fell ~1.9%. Natural gas futures fell 1.4% during this period.

US Natural Gas Inventories Impact Natural Gas Prices
The EIA released its weekly natural gas inventory report on January 26. US natural gas inventories fell by 119 Bcf to 2,798 Bcf from January 13–20, 2017.

Natural Gas Inventories Are below the 5-Year Average
For the week ending January 13, US natural gas inventories were 2.6% lower than the five-year average. They’re also 13% less than the same period in 2016.