Credit Suisse Nassau Branch
Latest Credit Suisse Nassau Branch News and Updates

Decoding US Natural Gas Inventories by Region
The EIA estimates that US natural gas inventories will be ~4.0 trillion cubic feet by the end of October 2016, which is the start of the 2016–2017 heating season.

Is Southwestern Energy Following Natural Gas Price Movements?
As we saw in the previous part of this series, Southwestern Energy’s (SWN) stock price decreased strongly by ~6.0% for the week ended January 19. Natural gas (UGAZ)(DGAZ)(UNG) prices fell marginally by ~0.5%.

What’s in the Cards for US Natural Gas Prices in August?
US natural gas inventories are 23.2% higher than their five-year average. High inventories could limit the upside potential for US natural gas prices.

How Rise in US Natural Gas Consumption Affects Prices
PointLogic reported that US natural gas consumption rose 10% between December 8 and December 14, 2016.

Will US Natural Gas Futures Rise in September?
Hedge funds reduced their net bullish positions on US natural gas futures and options contracts by 2,511 contracts to 81,683 on August 15–22, 2017.

OPEC Could Pressure US Natural Gas Prices in 2018
US natural gas rigs rose 35% in the last 12 months, while US natural gas prices (UNG) fell 20% during this period.

Winter Weather and Inventories Could Impact Natural Gas Prices
Aegent Energy Advisors estimates that US natural gas prices are expected to trade below $3.27 per MMBtu this winter from November 2016 to March 2017.

Natural Gas Prices Are Trading Close to $2 per MMBtu
November natural gas futures contracts are following their long-term downward trend. Prices are trading close to the key support of $2 per MMBtu.

The EIA Upgrades US Natural Gas Forecast for 2016
US natural gas inventories are 22.1% higher than their five-year average. High natural gas inventories could pressure natural gas prices.

US Natural Gas Prices Hit a 2016 High: What’s Next?
Natural gas prices rose due to cold weather forecasts and the bullish US natural gas inventory report. Prices hit a 2016 and two-year high.

The Rising Dollar: Is It Affecting Natural Gas Prices?
From November 9–16, 2016, natural gas December futures rose 2.8%. The US Dollar Index rose 1.8% during that period.

How Will Natural Gas Prices Move in November and Beyond?
US natural gas inventories are 4.6% above their five-year average. However, the surplus is shrinking.

Southwestern Energy Followed Natural Gas to the Upside Last Week
Southwestern Energy’s (SWN) stock price rose ~4.9% for the week ending December 29. Even natural gas (UGAZ) (DGAZ) (UNG) prices moved to the upside.

Will Natural Gas Prices Hold above $2 per MMBtu
Long-term bearish momentum is dragging natural gas prices to record lows. All the fundamental drivers are supporting the bearish traders.

Bottom Fishing: Natural Gas Prices Could Rally
The long-term bearish momentum could cause natural gas prices to fall, and the next support for natural gas prices could be seen at $2 per MMBtu.

US Natural Gas Consumption: Bullish or Bearish for Prices?
The EIA estimated that monthly US natural gas consumption rose by 19 Bcf per day to 91 Bcf per day in December 2016—compared to the previous month.

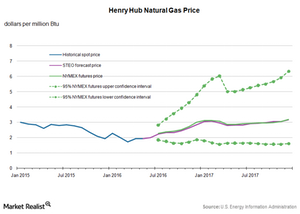
Natural Gas Prices Are Trading above Key Moving Averages
US natural gas inventories are 25% higher than their five-year average. High natural gas inventories could also limit the upside for US natural gas prices.

What Caused Range Resources’ Revenue Growth in 4Q17
Range Resources’ 4Q17 revenue In 4Q17, Range Resources (RRC) reported revenue of ~$600 million, lower than Wall Street analysts’ estimate of ~$626 million. RRC’s revenue rose ~24% from its 3Q17 revenue of ~$482 million and ~2% from its 4Q16 revenue of ~$590 million. Reasons behind Range Resources’ higher revenue in 4Q17 Range Resources’ higher revenue could be attributed […]

Why US Natural Gas Traders Are Tracking OPEC’s Production
Baker Hughes, a GE company, released its weekly US natural gas rigs report on January 19, 2018. Natural gas rigs increased by two to 189 on January 12–19.

Will US Natural Gas Futures Fall More?
US natural gas (GASL) futures contracts for January delivery were below their 20-day, 50-day, and 100-day moving averages on December 14, 2017.

NYMEX Natural Gas Prices: Long-Term Forecasts
US natural gas inventories are currently 11% higher than their five-year average. High natural gas inventories could weigh on US natural gas prices.

US Natural Gas Futures Recovered from a 3-Month Low
NYMEX natural gas (GASL) (DGAZ) futures contracts for July delivery rose 4.3% and settled at $3.06 per MMBtu (million British thermal units) on June 15.

US Natural Gas Price Forecast for 2017 and Beyond
World Bank forecast that US natural gas prices will average $2.30 per MMBtu in 2016, $3.00 per MMBtu in 2017, and $3.50 per MMBtu in 2018.

Will Natural Gas Prices Make a U-turn at $2.3 per MMBtu?
The consensus of rising natural gas inventory could push natural gas prices lower than the key resistance of $2.30 MMBtu.

US Natural Gas Prices Were Mixed in 2016: What’s Next?
US natural gas prices were on a rollercoaster ride in 2016. February 2017 natural gas futures contracts fell and closed at $3.72 per MMBtu on December 30.

Decoding US Natural Gas Inventories by Region Last Week
The EIA estimates that US natural gas inventories will be at 1,940 Bcf by the end of March 2017—20.0% higher than the five-year average.

S&P 500 and US Natural Gas Futures Next Week
NYMEX natural gas futures contracts for March delivery fell 0.27% to $2.58 per MMBtu on February 15, 2018.

Why Southwestern Energy’s Revenues Grew in 4Q17
For 4Q17, Southwestern Energy (SWN) reported revenues of ~$809 million—higher than Wall Street analysts’ consensus of ~$803 million.

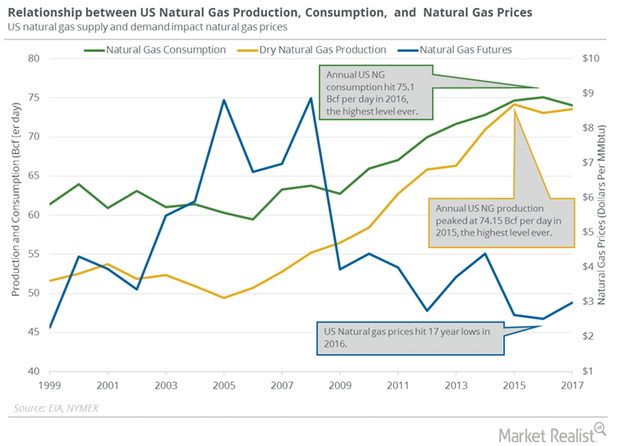
US Natural Gas Production and Consumption Could Impact Prices
According to PointLogic, US dry natural gas production increased by 0.3 Bcf (billion cubic feet) per day to 75.7 Bcf per day on January 11–17, 2018.

US Natural Gas Production Could Pressure Prices in 2018
According to PointLogic, US dry natural gas production fell 3.7% to 74 Bcf (billion cubic feet) per day between December 28, 2017, and January 3, 2018.

Natural Gas Inventories Could Help US Natural Gas Prices
A larger-than-expected withdrawal in US natural gas inventories compared to historical averages would help natural gas prices this week.

US Natural Gas Inventories Fell Last Week
US natural gas inventories fell by 182 Bcf (billion cubic feet) to 3,444 Bcf on December 8–15, 2017, according to the EIA.

US Natural Gas Production Could Help Natural Gas Bears
According to PointLogic, US dry natural gas production rose 0.9% to 76.8 Bcf (billion cubic feet) per day on December 14–20, 2017.

Why Southwestern Energy Has High Correlation with Natural Gas
Southwestern Energy (SWN) stock has fallen more than 9% in the last five trading sessions.

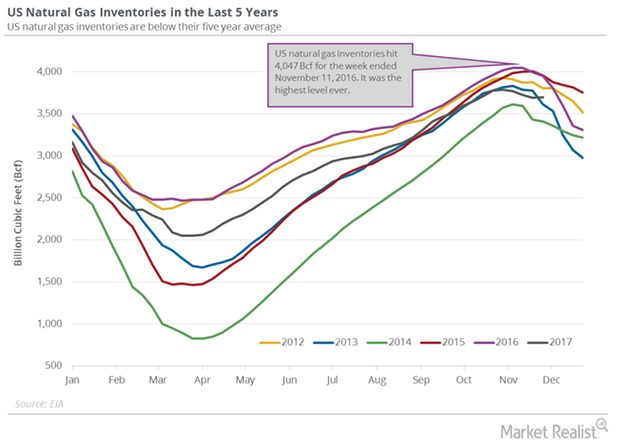
Unexpected Rise in US Natural Gas Inventories
The EIA estimated that US natural gas inventories rose by 2 Bcf (billion cubic feet) to 3,695 Bcf on November 24–December 1, 2017.

Natural Gas: OPEC’s Meeting Could Impact Supply and Demand
US natural gas production rose by 0.3 Bcf (billion cubic feet) per day to 75.9 Bcf per day on November 9–15, 2017. Production rose 0.4% week-over-week.

Weather Could Help Natural Gas Bulls Next Week
The weather is expected to be colder than normal next week. High demand could have a bullish impact on natural gas prices.

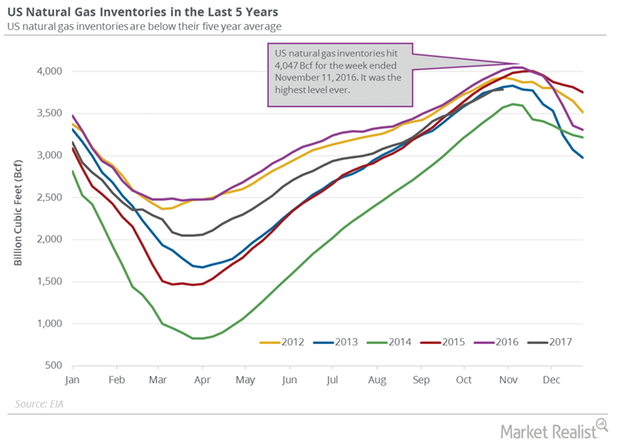
Are US Natural Gas Inventories Bullish for Natural Gas Futures?
The EIA estimates that US gas inventories rose by 15 Bcf (billion cubic feet) or 0.4% to 3,790 Bcf on October 27–November 3, 2017.

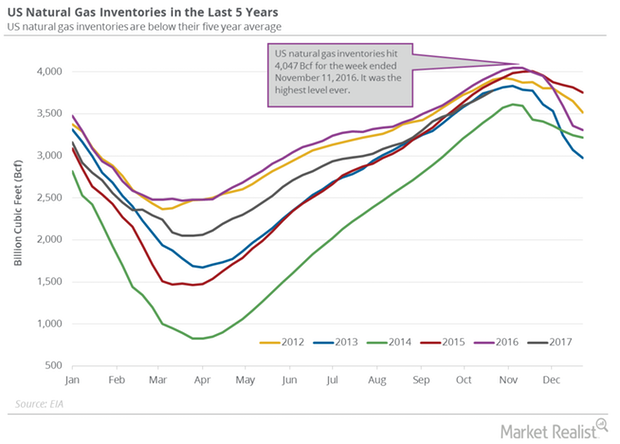
US Natural Gas Inventories Could Help Natural Gas Futures
The EIA reported that US natural gas inventories rose by 65 Bcf (billion cubic feet) to 3,775 Bcf on October 20–27, 2017.

Will US Natural Gas Consumption Drive Prices?
US natural gas consumption rose by 7.3 Bcf (billion cubic feet) per to 70.37 Bcf per day in July 2017 compared to August 2017.

Analyzing Southwestern Energy’s 3Q17 Revenue Expectations
For 3Q17, Wall Street analysts expect Southwestern Energy (SWN) to report revenues of ~$759 million.

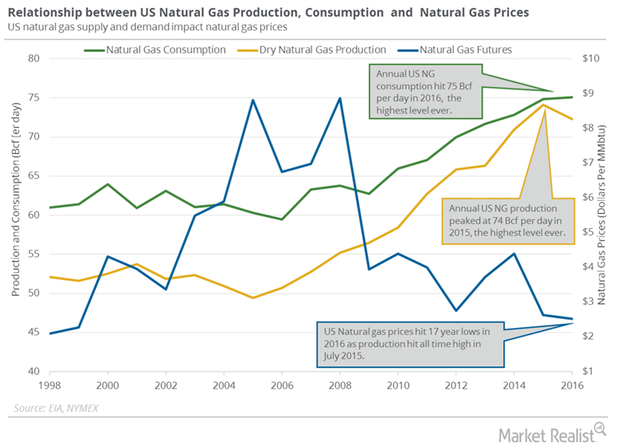
How US Natural Gas Production and Consumption Are Driving Prices
Market data provider PointLogic estimates that weekly US dry natural gas production fell by 0.2 Bcf (billion cubic feet) per day to 74.3 Bcf per day from September 21 to 27, 2017.

How Weather Is Affecting US Natural Gas Futures
US natural gas (DGAZ)(UGAZ) futures contracts fell 0.3% to $3.00 per MMBtu (million British thermal units) in electronic trading at 2:00 AM EST today.

US Natural Gas Futures Collapsed, S&P 500 Fell
October US natural gas (UNG) (FCG) futures contracts fell 4.5% to $2.95 per MMBtu (million British thermal units) on September 21, 2017.

Will US Natural Gas Production Pressure Natural Gas Prices?
Market data provider PointLogic estimates that weekly US dry natural gas production rose by 0.2 Bcf (billion cubic feet) per day to 73.9 Bcf per day from September 7 to 13.

Why US Natural Gas Inventories Are above their 5-Year Average
On September 14, the EIA (U.S. Energy Information Administration) released its weekly US natural gas inventory report.

US Natural Gas Prices: Moving Averages and Price Forecasts
The EIA estimates that US natural gas prices could average $3.06 per MMBtu in 2017—1.4% lower than previous estimates.

US Natural Gas Consumption Reached a 25-Month Low
The EIA estimates that monthly US natural gas consumption rose by 0.11 Bcf per day or 0.2% to 62.77 Bcf per day in June 2017—compared to May 2017.

Will US Natural Gas Inventories Fall below the 5-Year Average?
The EIA reported that US natural gas inventories rose by 30 Bcf (billion cubic feet) to 3,155 Bcf on August 18–25, 2017.

Hurricane Harvey Impacted US Weather and Natural Gas Prices
Hurricane Harvey hit the Gulf Coast region on August 26, 2017. It’s estimated to be one of the biggest hurricanes to hit the US in the last 50 years.

US Natural Gas Futures Are near a 5-Week High
October natural gas (BOIL) (UNG) futures contracts trading on NYMEX rose 2% to $3.04 per MMBtu (million British thermal units) on August 31, 2017.

US Weather Could Drive Natural Gas Demand
US natural gas futures contracts for September delivery were trading flat at $2.96 per MMBtu in electronic trading at 1:45 AM EST on July 28, 2017.

US Natural Gas Production Is near a 2-Year Low
The EIA estimates that monthly US dry natural gas production fell by 2.37 Bcf per day, or 3.2%, to 71.6 Bcf per day in April 2017—compared to March 2017.

Slowing Natural Gas Inventories Could Drive Prices
The EIA reported that US natural gas inventories rose by 57 Bcf (billion cubic feet) to 2,945 Bcf on June 30–July 7, 2017.

US Natural Gas Futures Could Rise Next Week
August natural gas (UNG) (DGAZ) (UGAZ) futures contracts trading in NYMEX fell 0.67% to $2.96 per MMBtu (million British thermal units) on July 13, 2017.

Slowing US Natural Gas Inventories: Bullish for Prices?
The EIA reported that US natural gas inventories rose by 10.0 Bcf (billion cubic feet) to 2,061 Bcf between March 31, 2017, and April 7, 2017.

Analyzing US Natural Gas Inventories: Week Ending March 10
US natural gas inventories are at 2,242 Bcf for the week ending March 10, 2017—21.4% higher than their five-year average.

Inventories: Will Bullish Natural Gas Traders Rethink Their Bets?
According to data from the EIA released on March 9, 2017, natural gas (UNG) (FCG) (DGAZ) inventories fell by 68 Bcf during the week ending March 3, 2017.

Analyzing the US Dollar’s Impact on Natural Gas Prices
From February 8, 2017, to February 15, 2017, natural gas March futures fell 6.4%. The US dollar (UUP) (UDN) (USDU) rose 0.9% during that period.

How Does US Natural Gas Consumption Impact Prices?
The EIA estimates that US natural gas consumption could average 75.4 Bcf per day in 2017 and 76.9 Bcf per day in 2018.

US Natural Gas Inventories Impact Natural Gas Prices
The EIA released its weekly natural gas inventory report on January 26. US natural gas inventories fell by 119 Bcf to 2,798 Bcf from January 13–20, 2017.

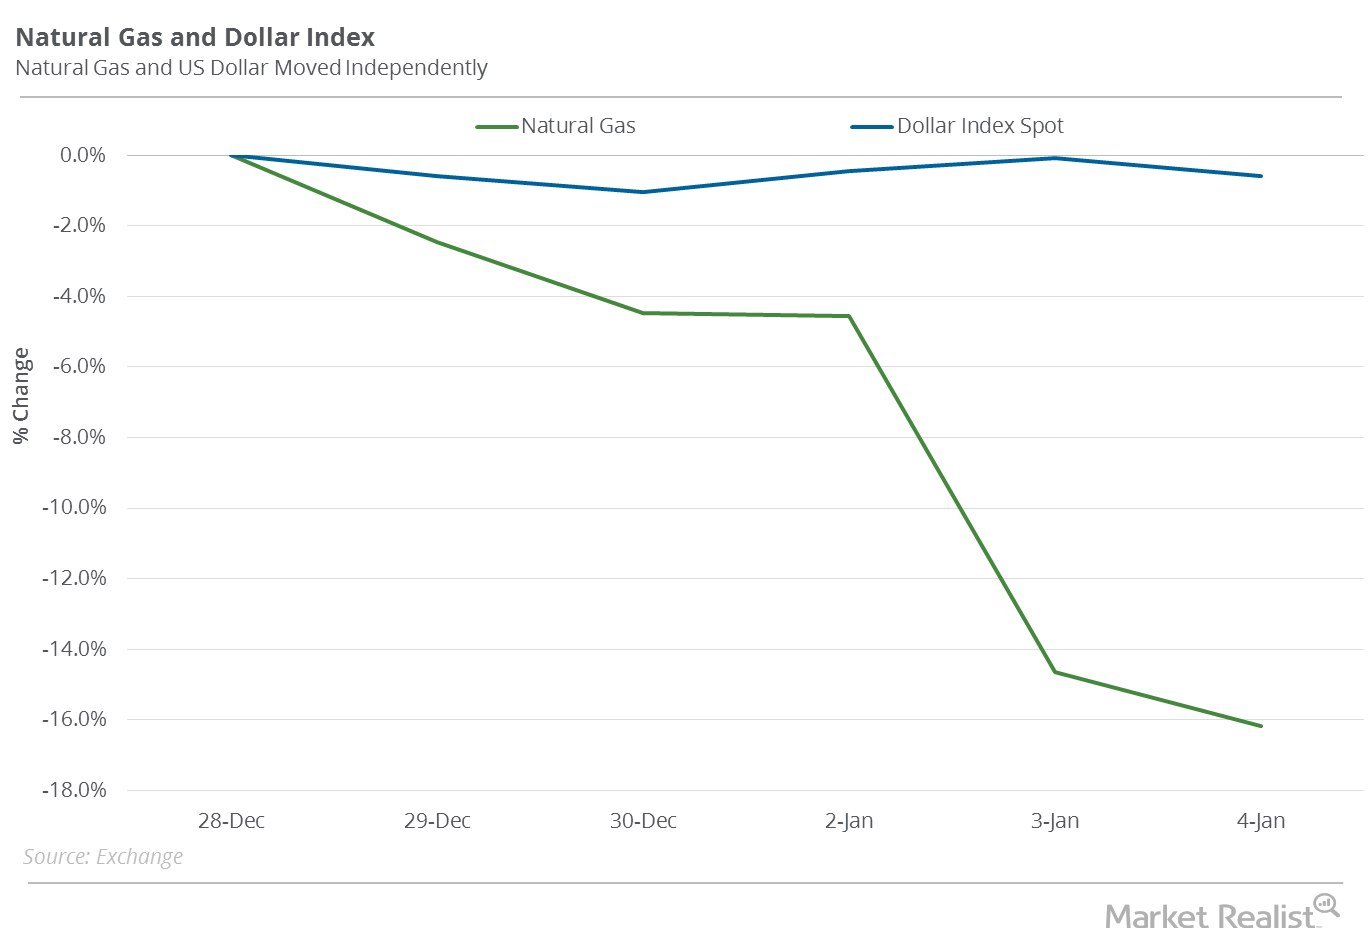
Does the US Dollar Impact Natural Gas Prices?
In the past four trading sessions, natural gas futures and the US Dollar Index moved in opposite directions one out of four times.

Does the Rising Dollar Impact Natural Gas Prices?
From December 14 to December 21, 2016, natural gas (UNG) (DGAZ) January futures rose 0.1%. The US Dollar Index (UUP) (UDN) rose 1.2% during that period.

Will the Stronger Dollar Influence Natural Gas Prices?
From March 3 to December 14, the US Dollar Index and natural gas prices moved in opposite directions based on the closing prices in 108 trading sessions.

How Did Regional Natural Gas Inventories Move Last Week?
Lower natural gas prices have a negative impact on the profitability of oil and gas producers such as EXCO Resources (XCO), WPX Energy (WPX), and Antero Resources (AR).

Natural Gas Bulls: Should You Watch Dollar Movements?
Between October 12 and October 19, 2016, natural gas November futures fell ~1.2%. The US Dollar Index was flat during this period.

Is Fed Fear Gripping Natural Gas Prices?
From May 2–August 31, the US Dollar Index and natural gas prices moved in opposite directions based on the closing price in 43 out of 85 trading sessions.

Is the US Dollar Impacting Natural Gas Prices?
On May 2, 2016, the US Dollar Index closed at 92.6—its lowest level year-to-date. Between May 2 and August 24, the US Dollar Index rose by ~2.3%,

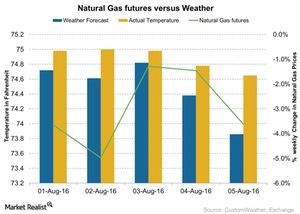
How Weather Could Impact Natural Gas Prices
In the week ended August 5, 2016, temperatures were higher than the forecast for the week. That boosted natural gas prices on August 3.

US Natural Gas Inventories Could Pressure Natural Gas Prices
The larger-than-expected rise in US natural gas inventories weighed on natural gas prices on July 14 and July 15.

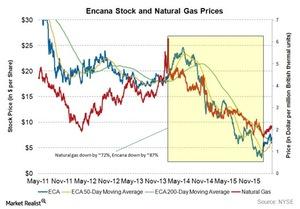
Encana: The Effect of Declining Natural Gas Prices
In this series, we’ll take a look at the effect of declining natural gas prices on Encana. We’ll also cover its May 17 Presentation for Investors on its Montney Resource Play.

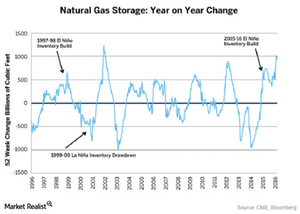
How Do El-Niño and La-Nina Impact Natural Gas Prices?
When El-Niño occurs, it keeps the sea surfaces warmer. This causes milder-than-normal cold temperatures across the sea and some parts of the US.

Less-Than-Expected Rise in Natural Gas Inventory Supported Prices
The US natural gas inventory rose by 15 Bcf (billion cubic feet) to 2,493 Bcf for the week ended March 18, 2016.

Natural Gas Prices Rose on Less-Than-Expected Rise in Inventories
April natural gas futures contracts trading on NYMEX (New York Mercantile Exchange) rose by 1.1% and closed at $1.81 per MMBtu (million British thermal units) on March 24, 2016.

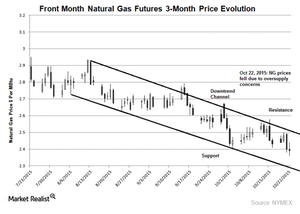
Will Natural Gas Prices Hit New Lows?
Cold winter weather could drive natural gas prices higher. But on the other hand, record natural gas stocks will push natural gas prices lower.