Natural Gas Prices Are Trading above Key Moving Averages
US natural gas inventories are 25% higher than their five-year average. High natural gas inventories could also limit the upside for US natural gas prices.
Nov. 20 2020, Updated 12:45 p.m. ET

Supply and demand balance 
Based on the U.S. Energy Information Administration’s forecasts for US natural gas production and consumption figures, production will exceed demand by 3.0 Bcf (billion cubic feet) per day in 2016 and 3.6 Bcf per day in 2017. The increase in the supply-demand gap could limit the upside for US natural gas prices.
US natural gas inventories are 25% higher than their five-year average. High natural gas inventories could also limit the upside for US natural gas prices.
Moving averages
US natural gas prices were trading above their 20-day, 50-day, and 100-day moving averages of $2.6 per MMBtu, $2.4 per MMBtu, and $2.3 per MMBtu, respectively, on June 30, 2016. This indicates a bullish trend in natural gas prices.
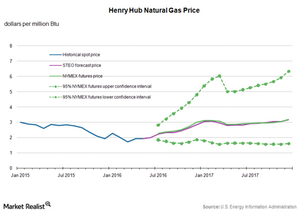
The EIA forecasts that natural gas prices will trade lower than $3.00 per MMBtu through the end of 2016. However, technical indicators like RSI (relative strength indicator) suggest that natural gas is overbought.
US natural gas price forecast  
The EIA added that US natural gas prices will average $2.29 per MMBtu in 2016 and $3.05 per MMBtu in 2017. The EIA might revise the natural gas forecast in the next Short-Term Energy Outlook report considering the hot summer weather. The World Bank forecasts that US natural gas prices will average $2.5 per MMBtu in 2016 and $3 per MMBtu in 2017.
The ups and downs in natural gas prices affect oil and gas exploration and production companies like Newfield Exploration (NFX), Range Resources (RRC), Cimarex (XEC), and Ultra Petroleum (UPL). Prices also affect ETFs like the VelocityShares 3x Inverse Natural Gas ETN (DGAZ) and the PowerShares DWA Energy Momentum Portfolio (PXI).
For related analysis, visit Market Realist’s Energy and Power page.
