Direxion Daily S&P Oil & Gas Exp. & Prod. Bear 3X Shares
Latest Direxion Daily S&P Oil & Gas Exp. & Prod. Bear 3X Shares News and Updates

Oil’s Contango: Supply–Demand Fears Could Impact the Market
On October 3, 2017, US crude oil (USL) (OIIL) November 2018 futures settled $0.33 higher than the November 2017 futures.
Brent-WTI Spread: Will US Oil Exports Rise Further?
On October 24, 2017, Brent crude oil (BNO) active futures were $5.86 above WTI crude oil active futures.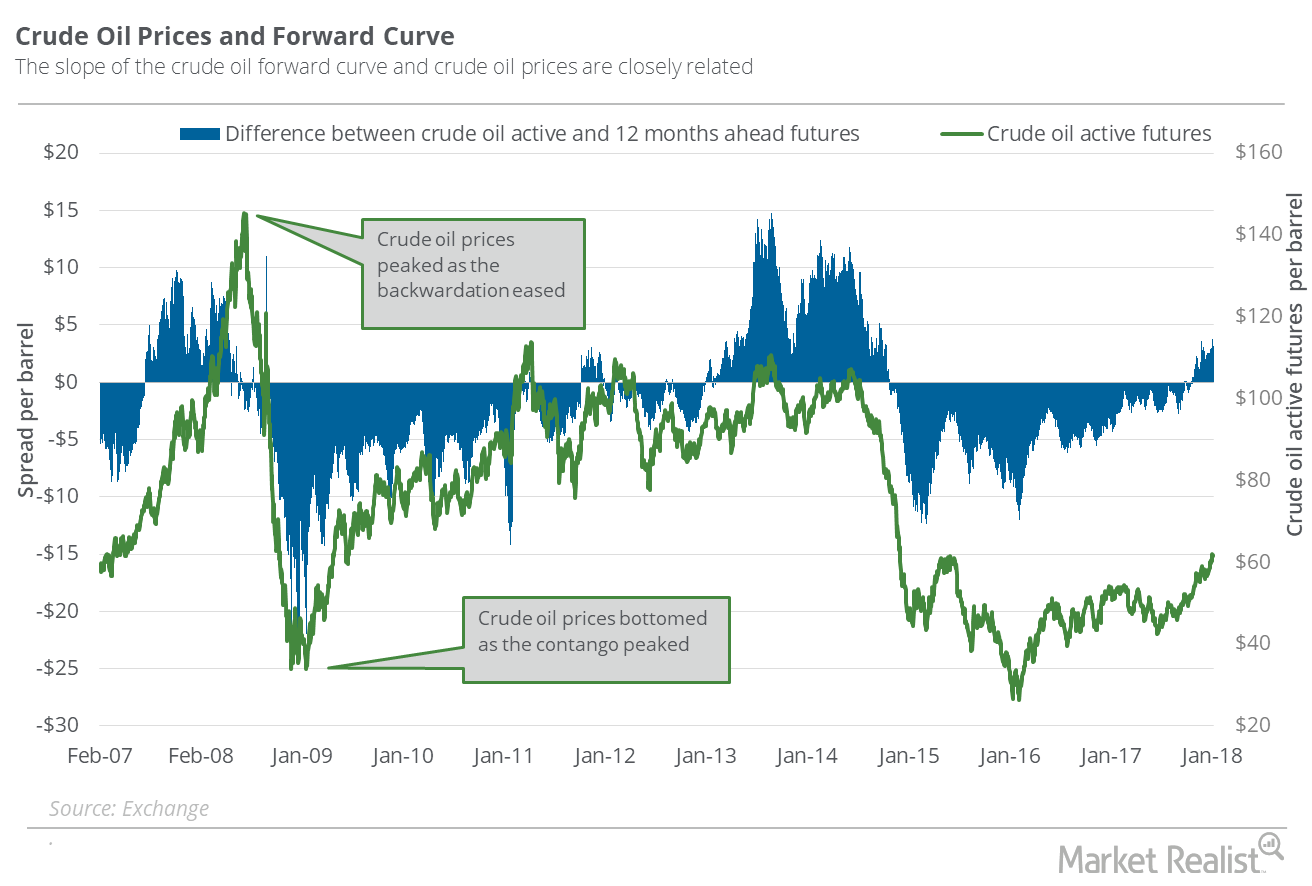
Are Traders Confident about the Oil Supply-Demand Balance?
Between December 29, 2017, and January 8, 2018, the premium and the oil prices rose. The market expects a tightening supply-demand balance for oil in 2018.
Natural Gas: Are Winter Demand Fears Rising?
On January 2, 2018, natural gas (UNG) (BOIL) (FCG) February 2018 futures settled $0.025 less than February 2019 futures.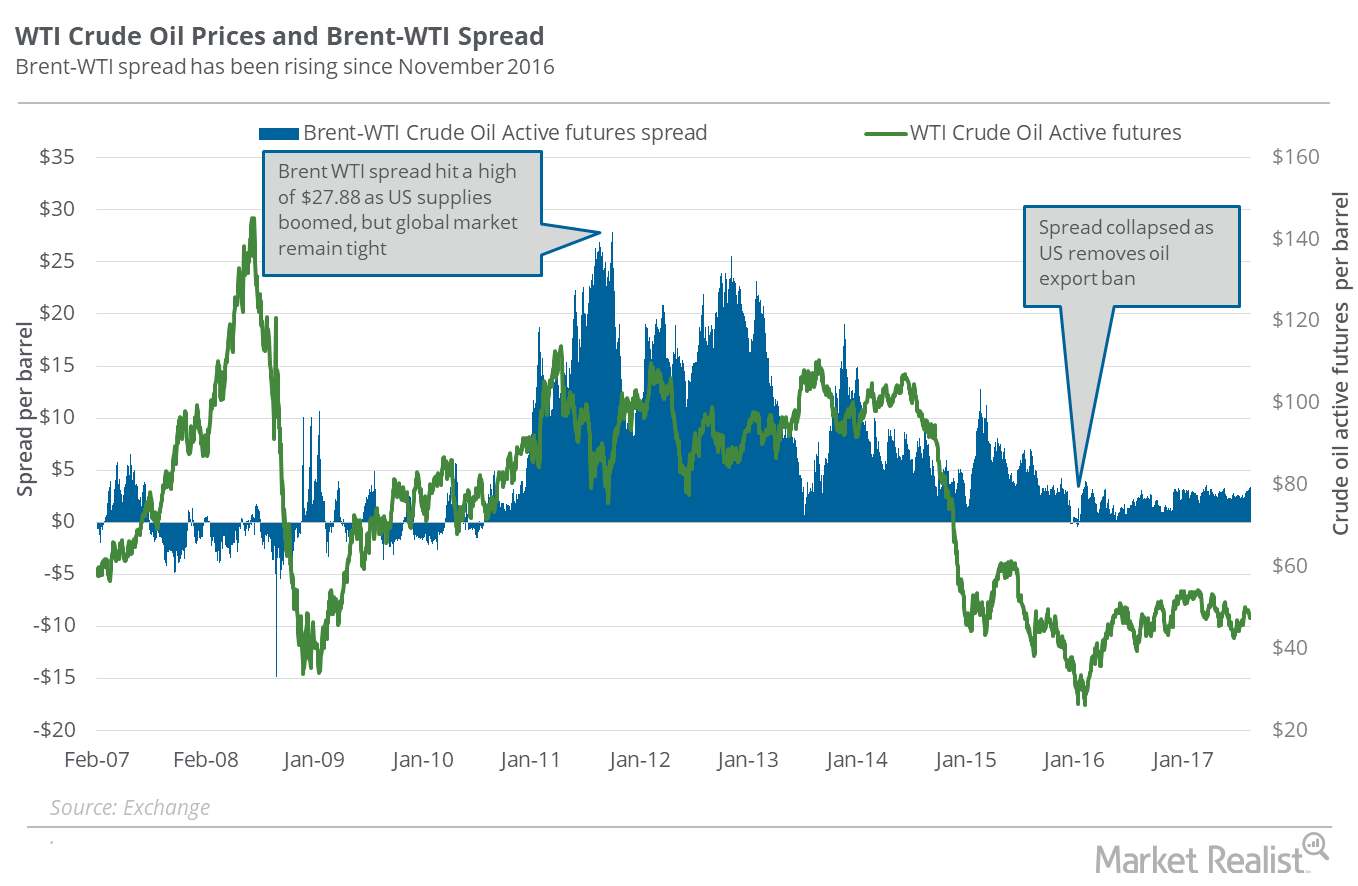
What the Brent–WTI Spread Indicates
On August 15, Brent crude oil active futures were trading $3.25 more than the WTI crude oil active futures. On August 8, the spread stood at $2.97.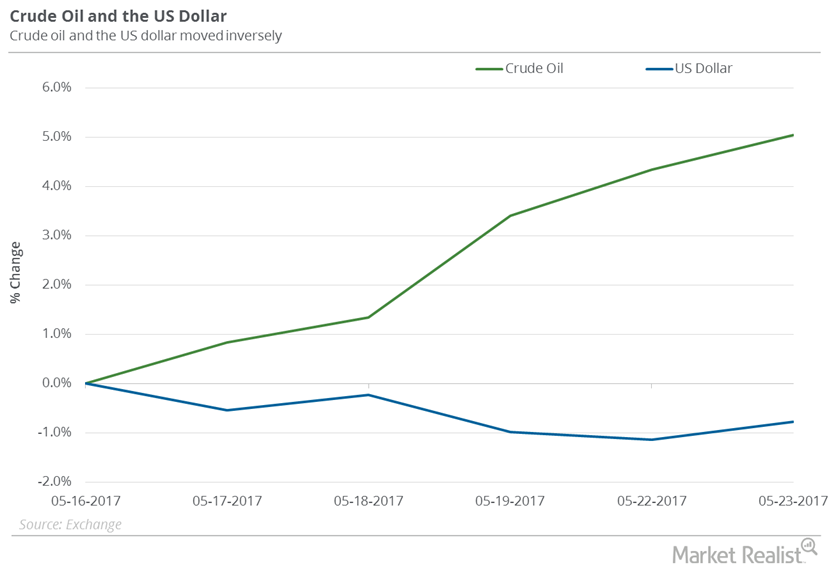
How the Dollar Is Affecting Oil
US crude oil (DBO) (USL) (OIIL) July futures rose 5% between May 16 and May 23, 2017.
Are Natural Gas Supplies Overtaking Demand?
Futures spread On September 27, 2017, natural gas (FCG) (GASL) (BOIL) 2018 November futures traded $0.04 lower than November 2017 futures. That is, the futures spread was at a discount of $0.04. On September 20, 2017, the futures spread was at a discount of $0.10. Between September 20 and 27, 2017, natural gas November futures […]
Why the Brent-WTI Spread Could Make Global Oil Supplies Rise
On October 17, 2017, Brent crude oil (BNO) active futures closed $6 above the WTI (West Texas Intermediate) crude oil futures.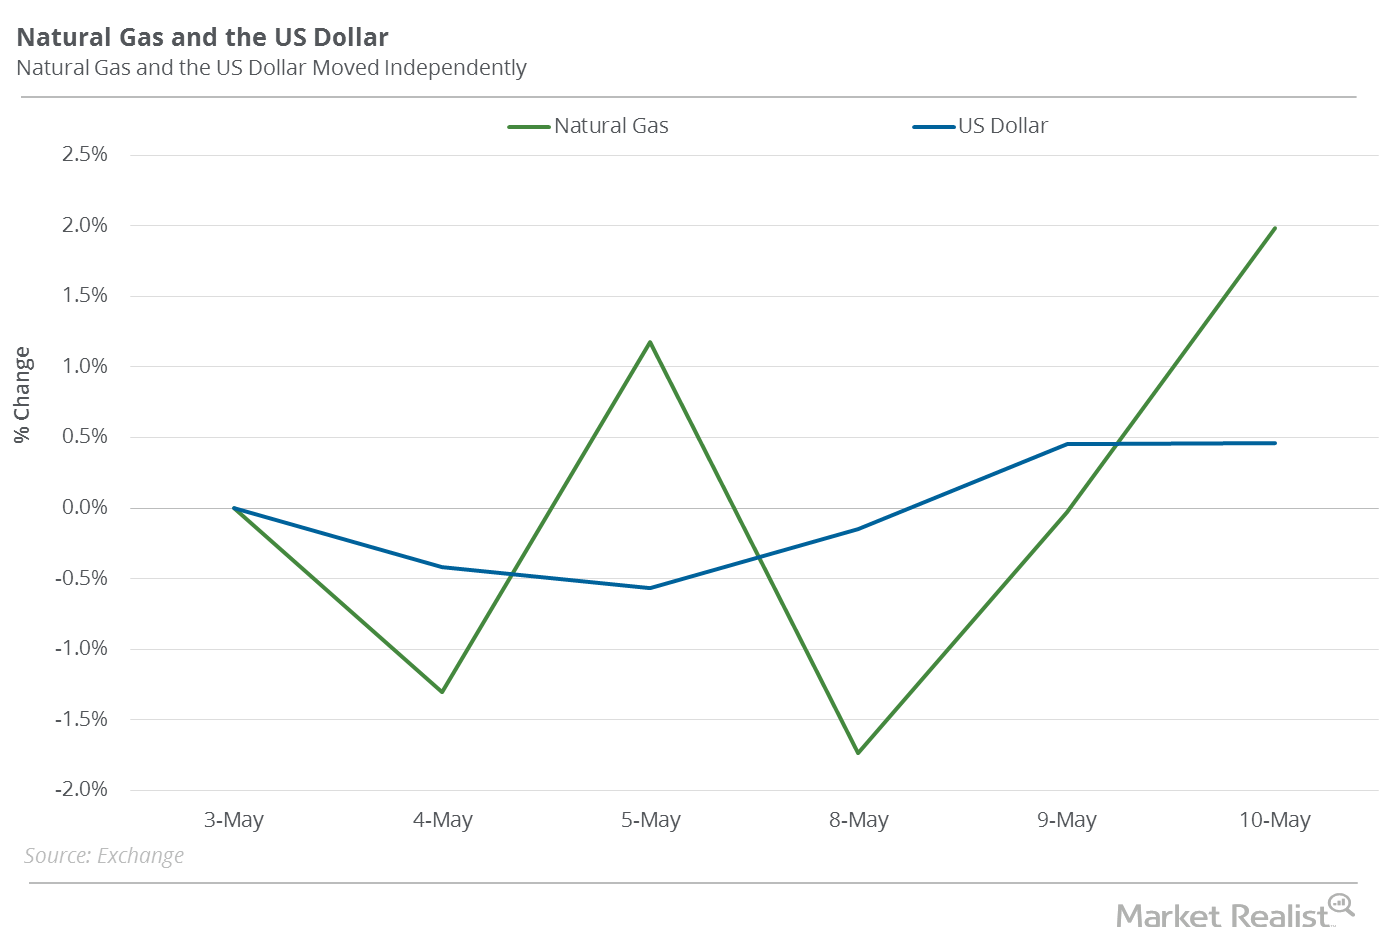
Natural Gas Prices Are Impacted by the US Dollar
Between May 3 and May 10, 2017, natural gas (GASX) (FCG) (GASL) June futures rose 2%. The US dollar (UUP) (UDN) (USDU) rose 0.5% during that period.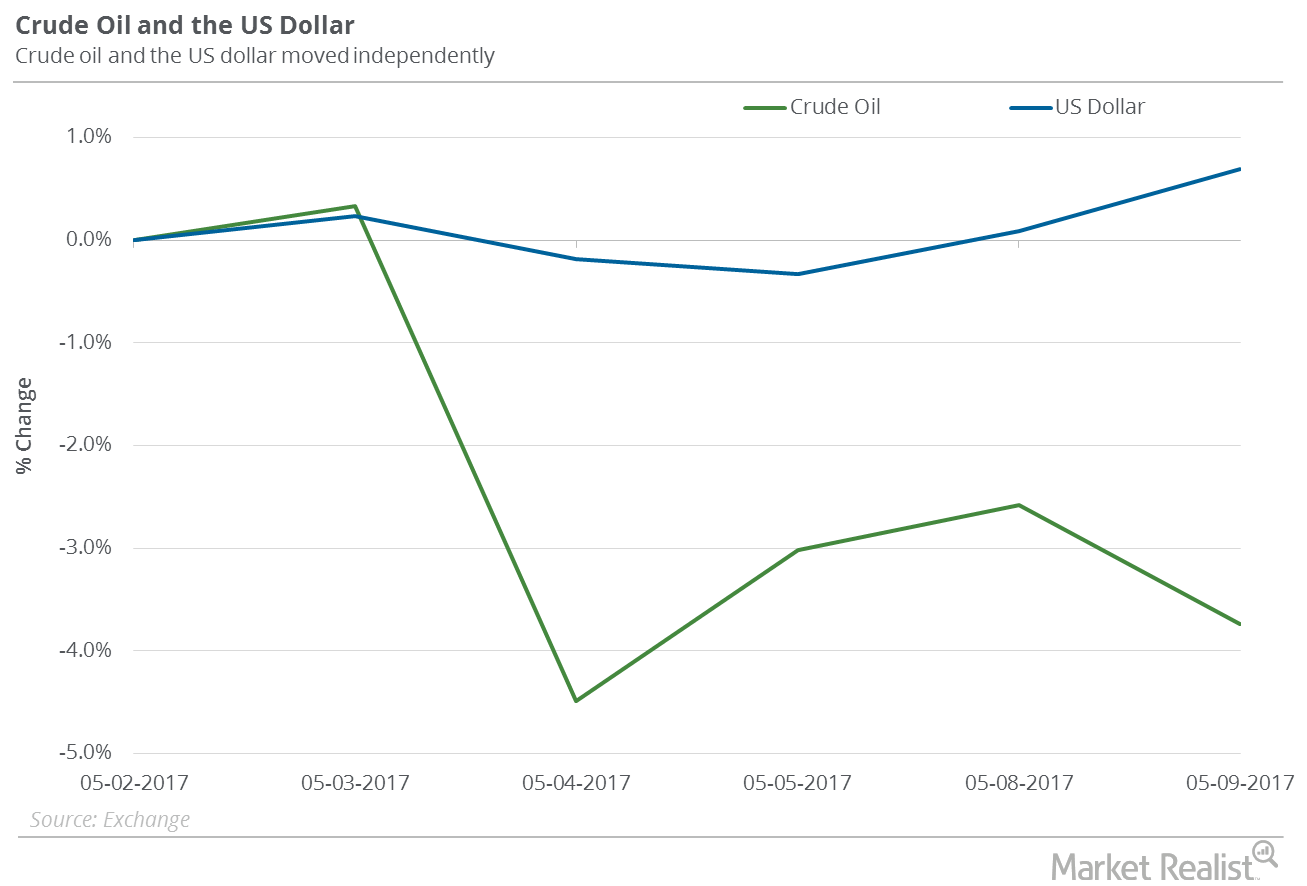
Oil Bulls, Don’t Worry About the Rising US Dollar
US crude oil futures contracts for June 2017 delivery fell 3.7% between May 2, and May 9, 2017, while the US Dollar Index rose 0.7%.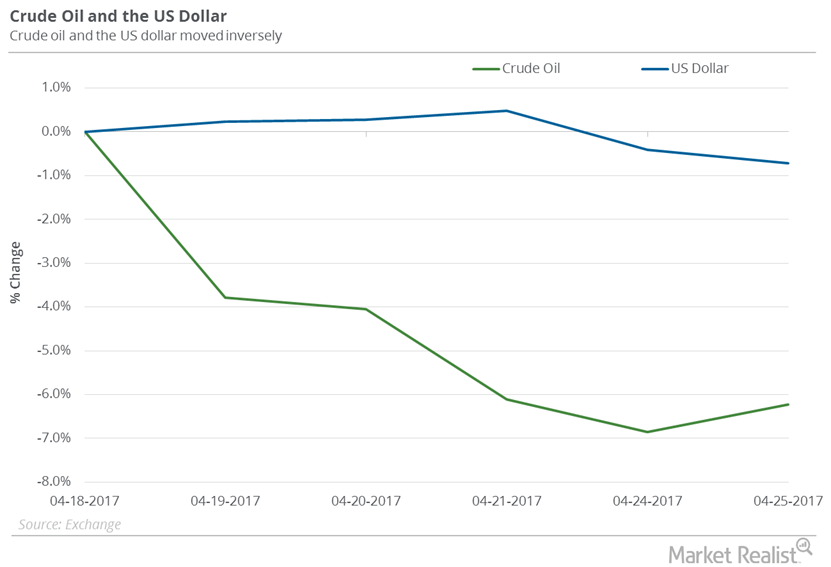
How the US Dollar Could Be Crucial to Oil Investors
US crude oil futures contracts for June delivery fell 6.2% between April 18, 2017, and April 25, 2017. Meanwhile, the US Dollar Index fell 0.7%.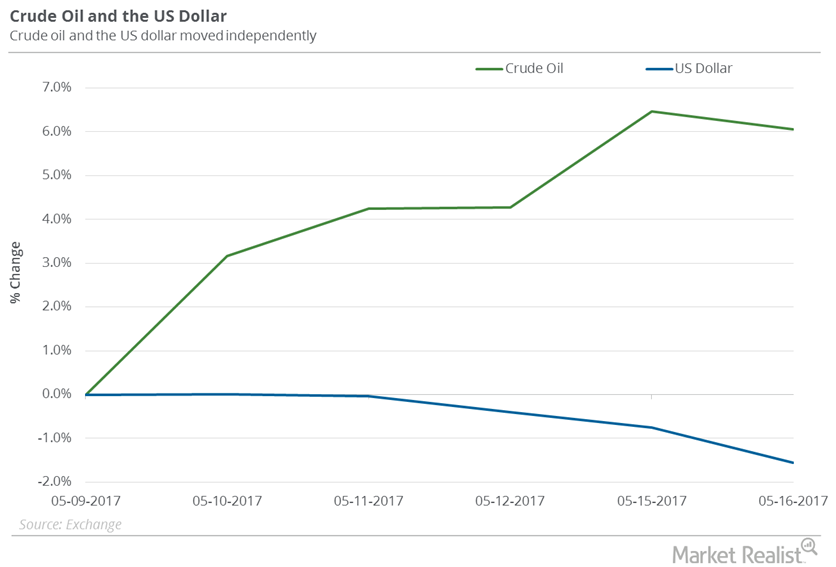
How the Dollar Could Impact Oil’s Recovery
US crude oil (DBO) (USL) (OIIL) futures contracts for June 2017 delivery rose 3.7% between May 10 and May 17, 2017.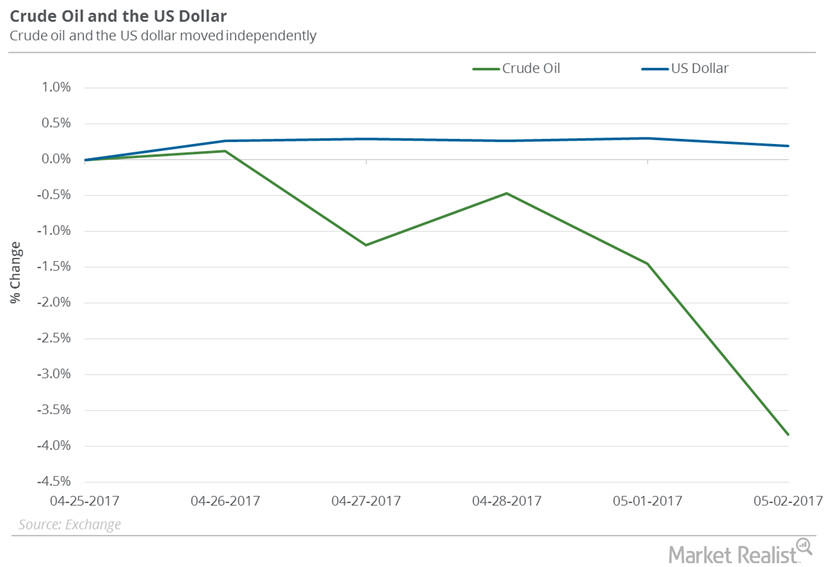
Did the US Dollar Impact Oil Prices Last Week?
US crude oil (DBO) (USL) (OIIL) futures contracts for June 2017 delivery fell 3.8% between April 25, 2017, and May 2, 2017.
Futures Spread: Is the Natural Gas Market Turning Bullish?
On September 20, 2017, natural gas (FCG) (BOIL) October 2018 futures closed $0.10 below its October 2017 futures.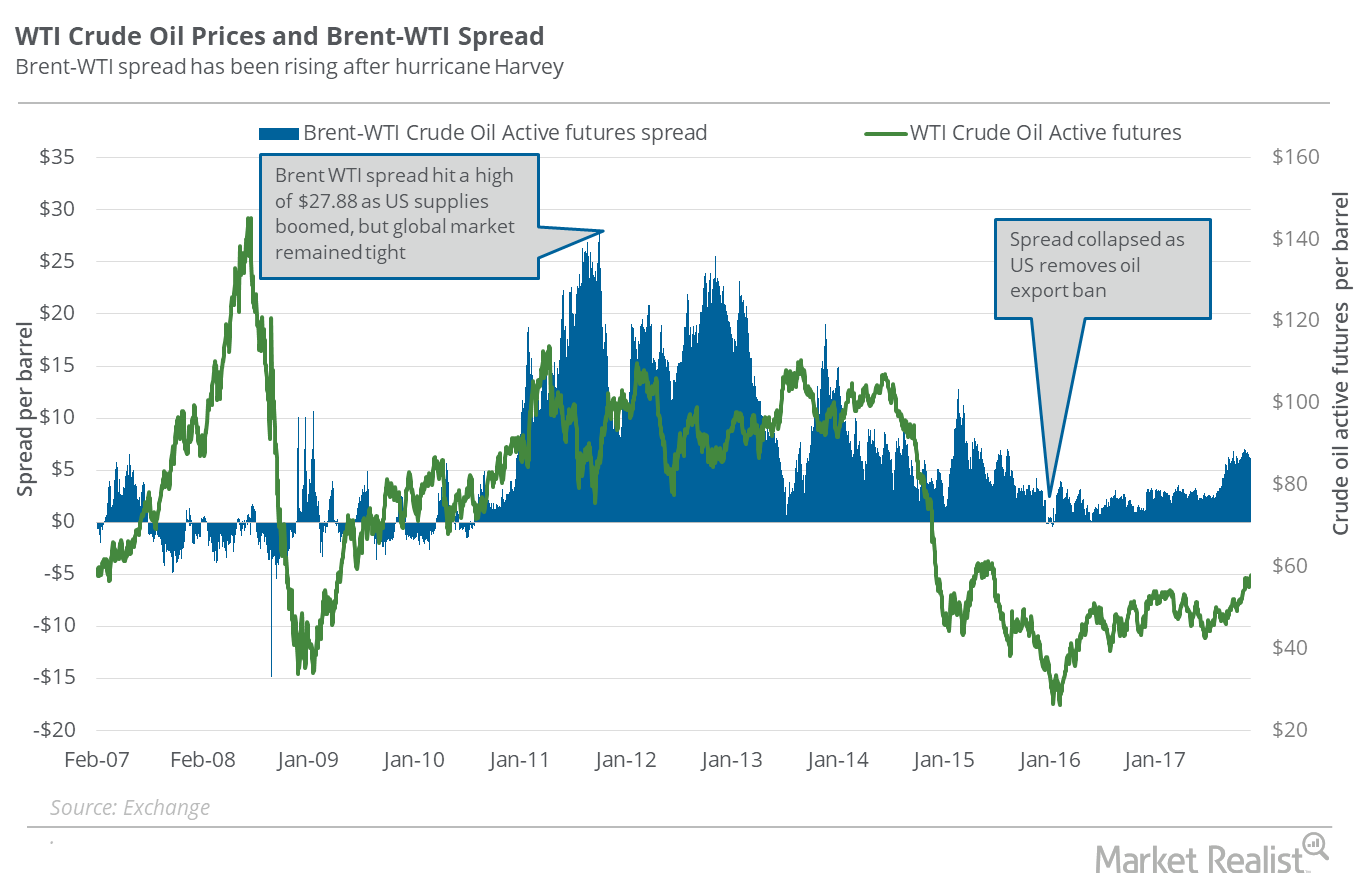
Is WTI Crude Oil Outdoing Brent?
On November 21, Brent crude oil (BNO) active futures closed $5.74 above US crude oil (USO)(UCO) active futures. In other words, the Brent-WTI (West Texas Intermediate) spread was $5.74.
WTI Crude Oil Is Rising Faster than Brent
On November 28, 2017, Brent crude oil (BNO) active futures closed at $5.62 higher than US WTI crude oil (USO) (UCO) active futures.
Brent Is Outperforming WTI Crude Oil
On December 11, 2017, Brent crude oil (BNO) active futures settled $6.7 more than WTI (West Texas Intermediate) crude oil (USO) (UCO) active futures.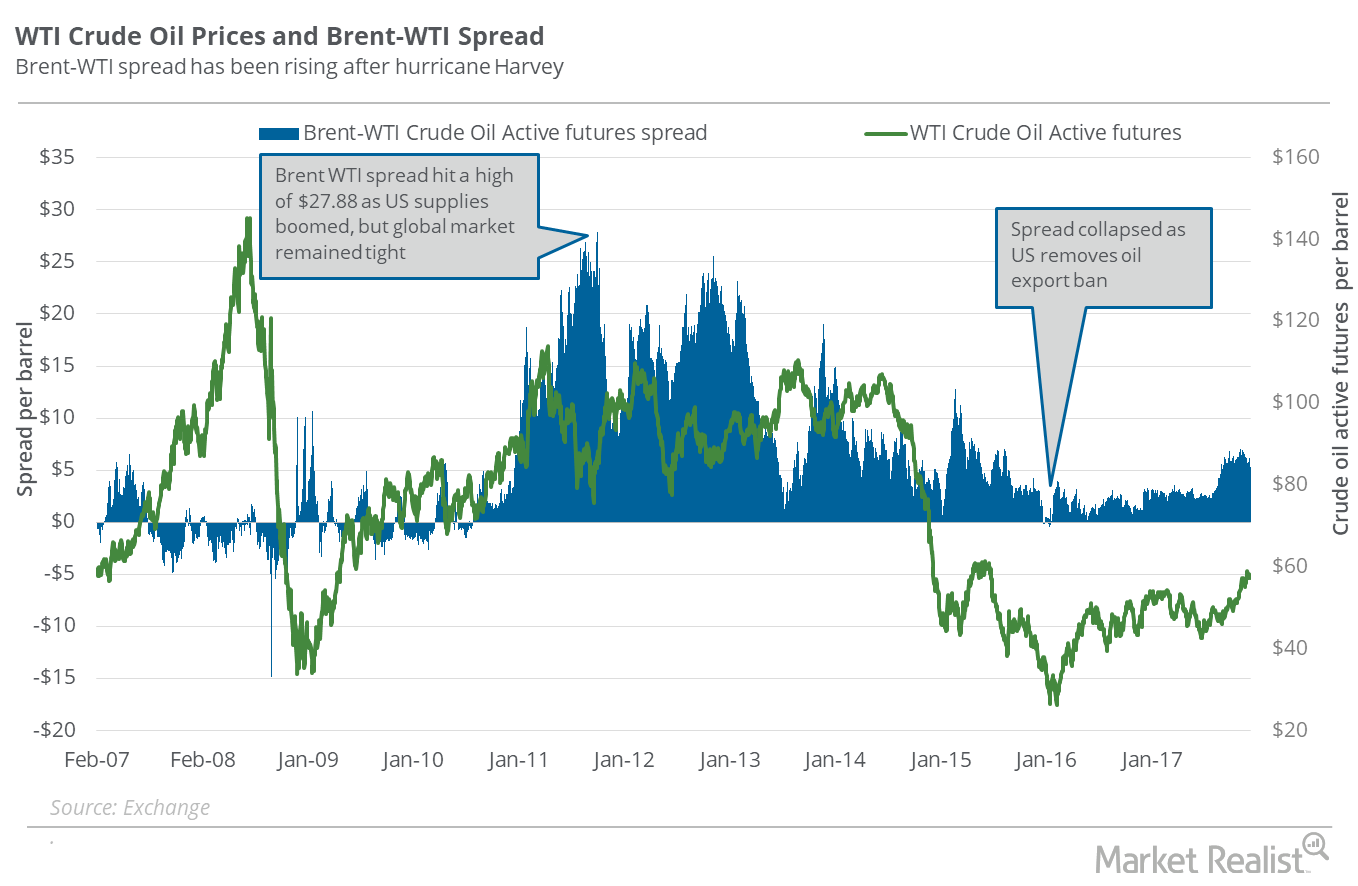
Oil Traders Should Watch US Oil Exports
On December 5, 2017, Brent crude oil (BNO) active futures were priced $5.24 higher compared to WTI crude oil (USO) (UCO) active futures.
Futures Spread: Does It Signal End of Oil’s Oversupply Concern?
On October 17, 2017, US crude oil (USO) (OIIL) December 2018 futures traded $0.46 below the December 2017 futures.
What the Natural Gas Futures Spread Tells Us about the Current Sentiment
On September 6, 2017, the futures spread was at a discount of $0.06, but on September 8, 2017, the futures spread shifted to a premium.
US Crude Oil Exports Could Be at a Tipping Point
On October 31, 2017, Brent crude oil (BNO) active futures were ~$7 above US crude oil (UCO) futures.
Comparing WTI’s and Brent’s Performance
The Brent-WTI spread On December 18, 2017, Brent crude oil (BNO) active futures’ premium to WTI (West Texas Intermediate) crude oil (USO) (UCO) active futures was $6.30. On December 11, 2017, the Brent-WTI spread was $6.70. On December 11, 2017, the shutdown of the Forties Pipeline System boosted Brent oil prices. That day, the spread expanded […]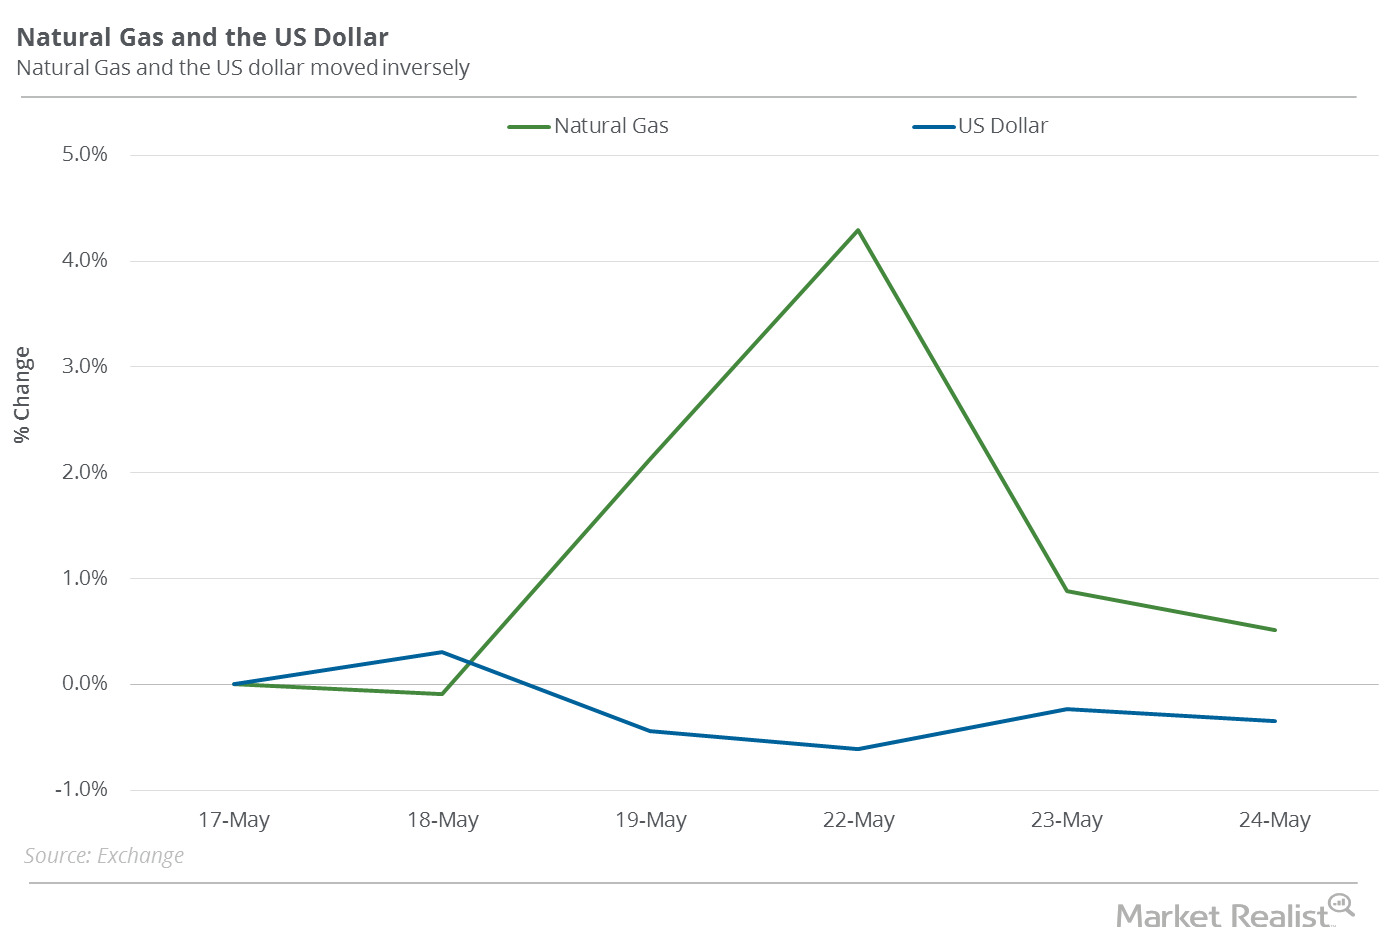
Recent Fall in the US Dollar: Crucial for Natural Gas?
Natural gas (GASX) (FCG) (GASL) July futures rose 0.5% on May 17–May 24, 2017. During this period, the US dollar (UUP) (UDN) (USDU) fell 0.3%.
US Crude Oil Exports: Will They Affect OPEC’s Production Cut Deal?
On November 7, 2017, the difference between Brent crude oil (BNO) active futures and US crude oil (USO) active futures, or the Brent-WTI (West Texas Intermediate) spread, was $6.50.
Is Natural Gas Pricing in Colder Weather?
On January 23, 2018, natural gas February 2018 futures settled $0.34 above February 2019 futures.
US Oil Exports Could Threaten International Oil Prices
In the week ending January 12, 2018, US crude oil exports were at ~1.25 MMbpd—234,000 barrels per day more than the previous week.
Natural Gas Market Could Be Pricing In a Supply Deficit
On January 16, 2018, the gap between natural gas’s February 2018 futures and February 2019 futures was $0.07, or the futures spread.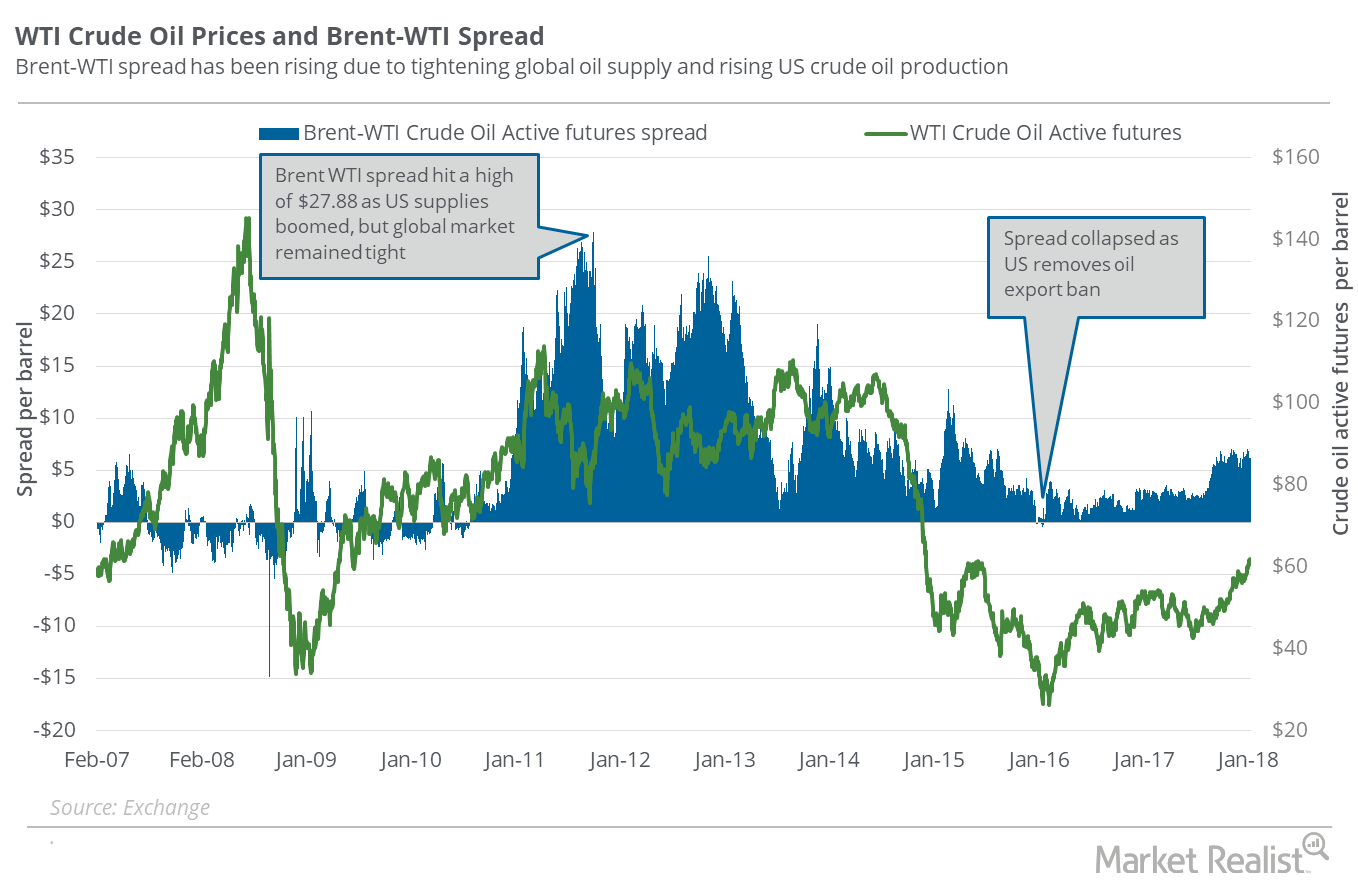
US Oil Exports Are Crucial for Oil Prices in 2018
On January 8, 2018, Brent crude oil (BNO) active futures were $6.05 stronger than WTI (West Texas Intermediate) crude oil (USO) (UCO) active futures.
Should Oil Traders Follow US Oil Exports in 2018?
On December 29, 2017, the price difference between Brent crude oil (BNO) active futures and WTI (West Texas Intermediate) crude oil (USO) (UCO) active futures was $6.45.
Natural Gas: Have Oversupply Concerns Eased?
On December 19, natural gas (UNG)(BOIL)(FCG) January 2018 futures closed $0.31 below its January 2019 futures.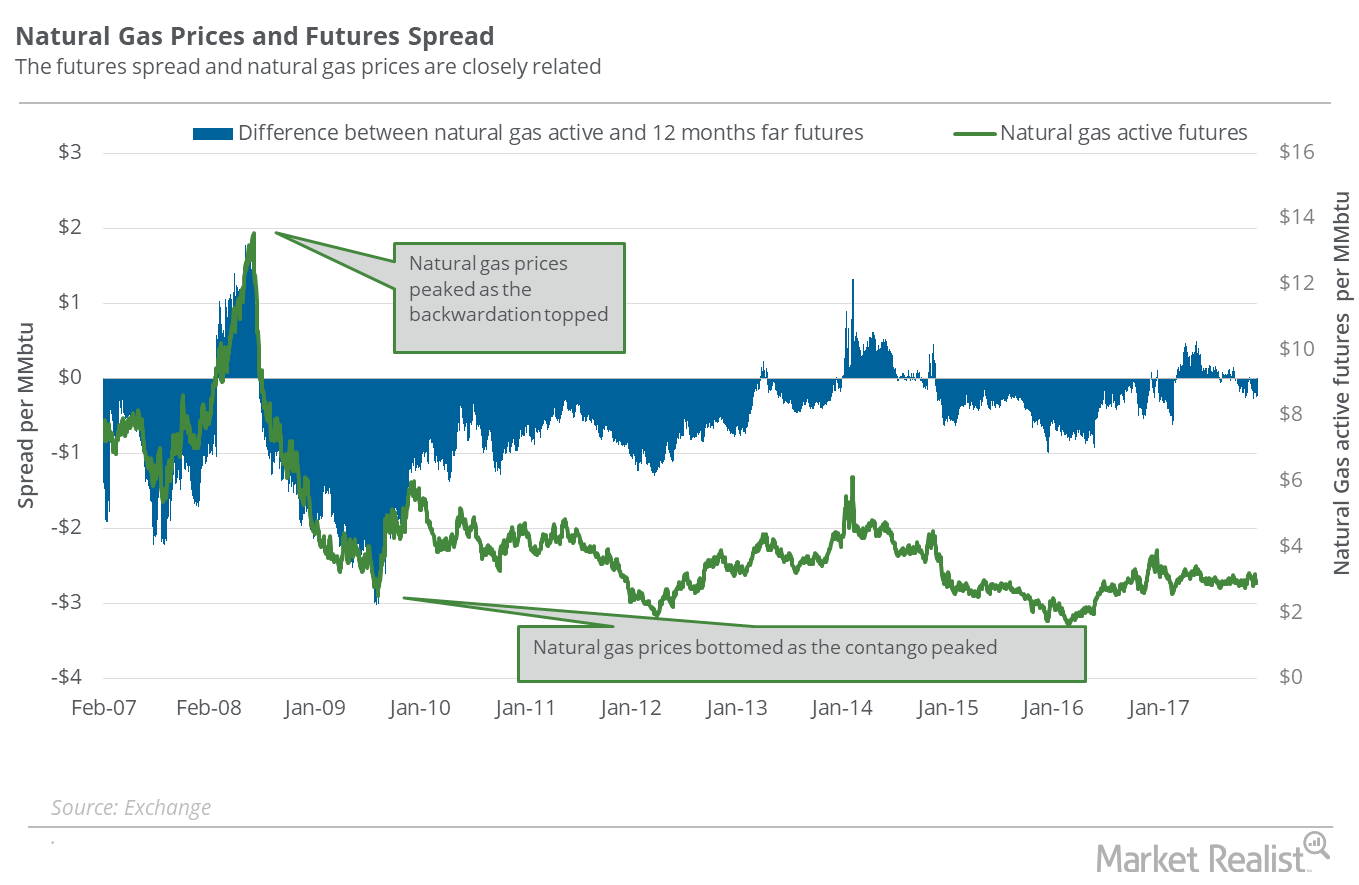
Are Natural Gas Supply Fears Rising?
On December 6, natural gas (UNG)(BOIL) January 2018 futures traded at a discount of ~$0.24 to January 2019 futures. This price difference between January 2018 futures and January 2019 futures is called the “futures spread.”
Are Oversupply Concerns Gripping Natural Gas Prices?
On November 22, natural gas (UNG)(BOIL) January 2018 futures closed at a discount of ~$0.2 to January 2019 futures.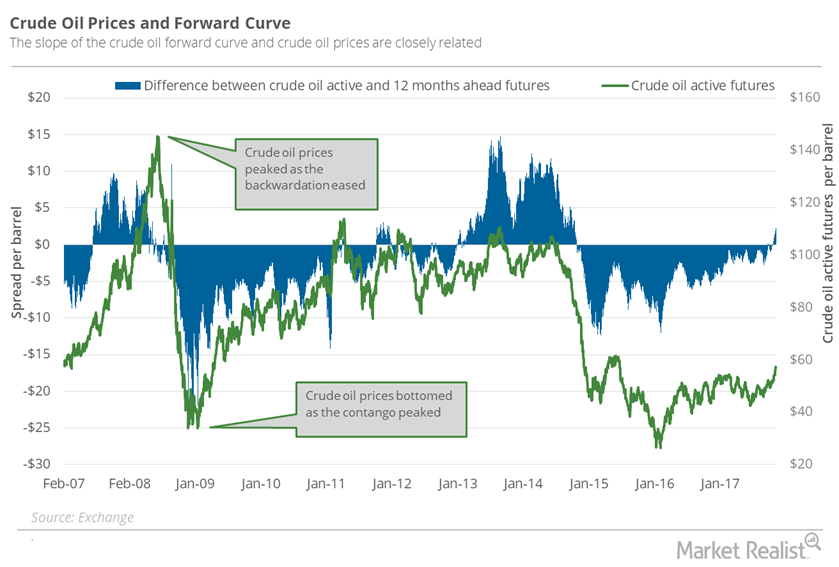
Futures Spread: Is the Oil Market Tightening?
On November 7, 2017, US crude oil (OIIL) December 2018 futures settled $2.08 below the December 2017 futures.
Understanding the Natural Gas Futures Spread: Are Oversupply Concerns Rising?
On November 1, natural gas December 2018 futures settled $0.22 above December 2017 futures. On October 25, the futures spread was at a premium of $0.11.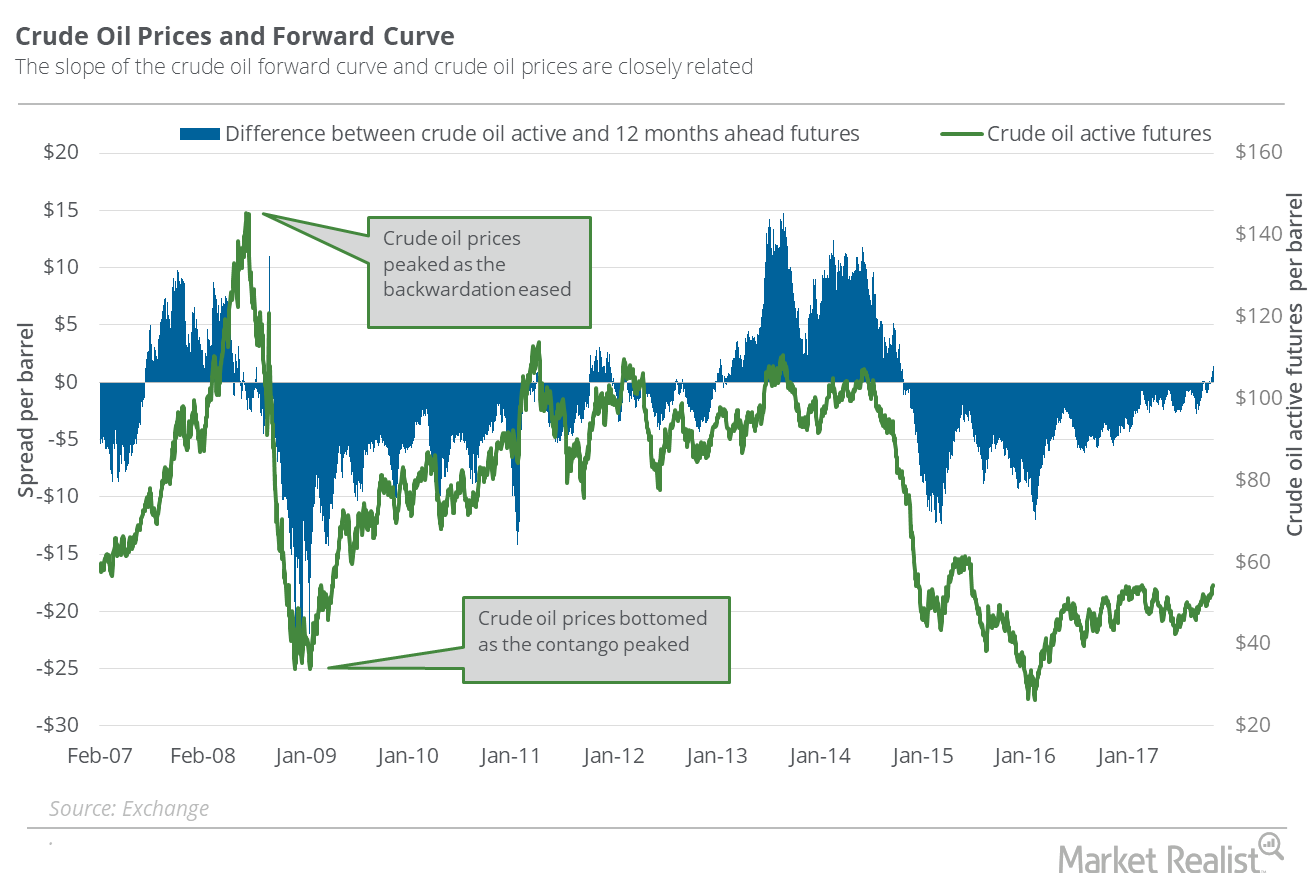
Is the Oil Market Balancing?
On October 31, 2017, US crude oil (USO) December 2018 futures settled $1.4 below December 2017 futures.
Understanding the Natural Gas Futures Spread—And What It Means for Prices
On October 25, 2017, natural gas December 2018 futures closed $0.11 above the December 2017 futures.
Reading the Natural Gas Futures Spread: Rising Oversupply Concerns
On October 11, 2017, the futures spread was at a premium of $0.13. Between then and October 18, natural gas November futures fell 1.2%.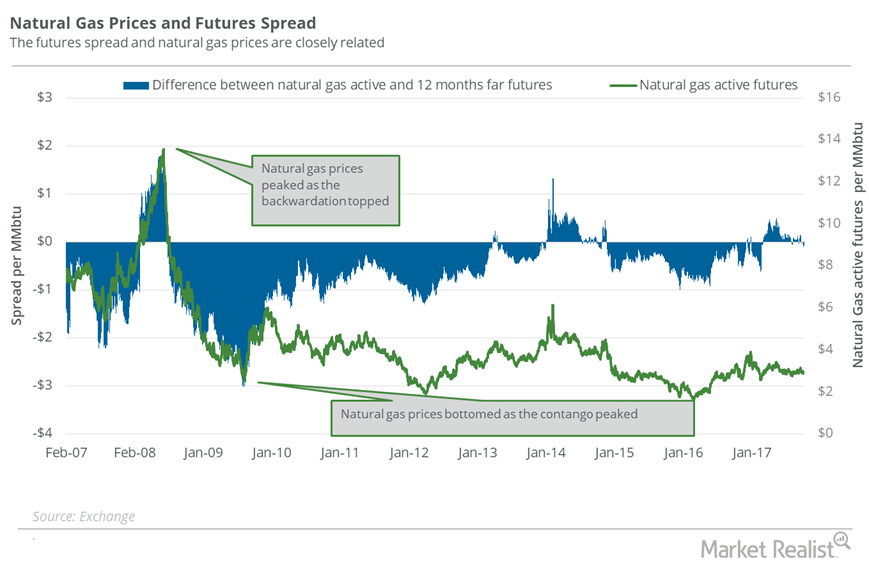
Why the Natural Gas Futures Spread Is Concerning Markets
When the futures spread is at a premium, or the premium rises, it could hamper the rise in natural gas prices.
Futures Spread: A Look at Natural Gas Supply–Demand Concerns
On October 4, 2017, natural gas (UNG) (GASL) November 2018 futures traded $0.08 above the November 2017 futures.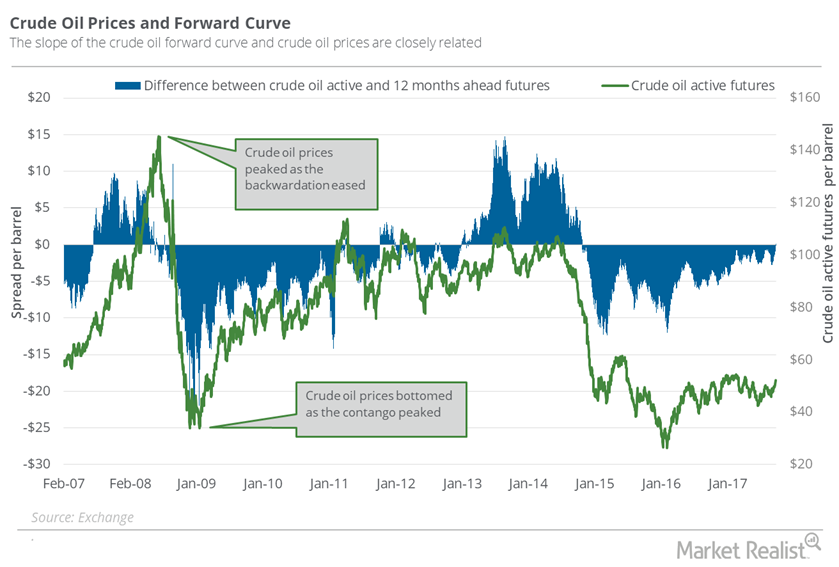
Understanding the Oil Futures’ Forward Curve
On September 26, 2017, US crude oil November 2017 futures traded just $0.14 below the November 2018 futures.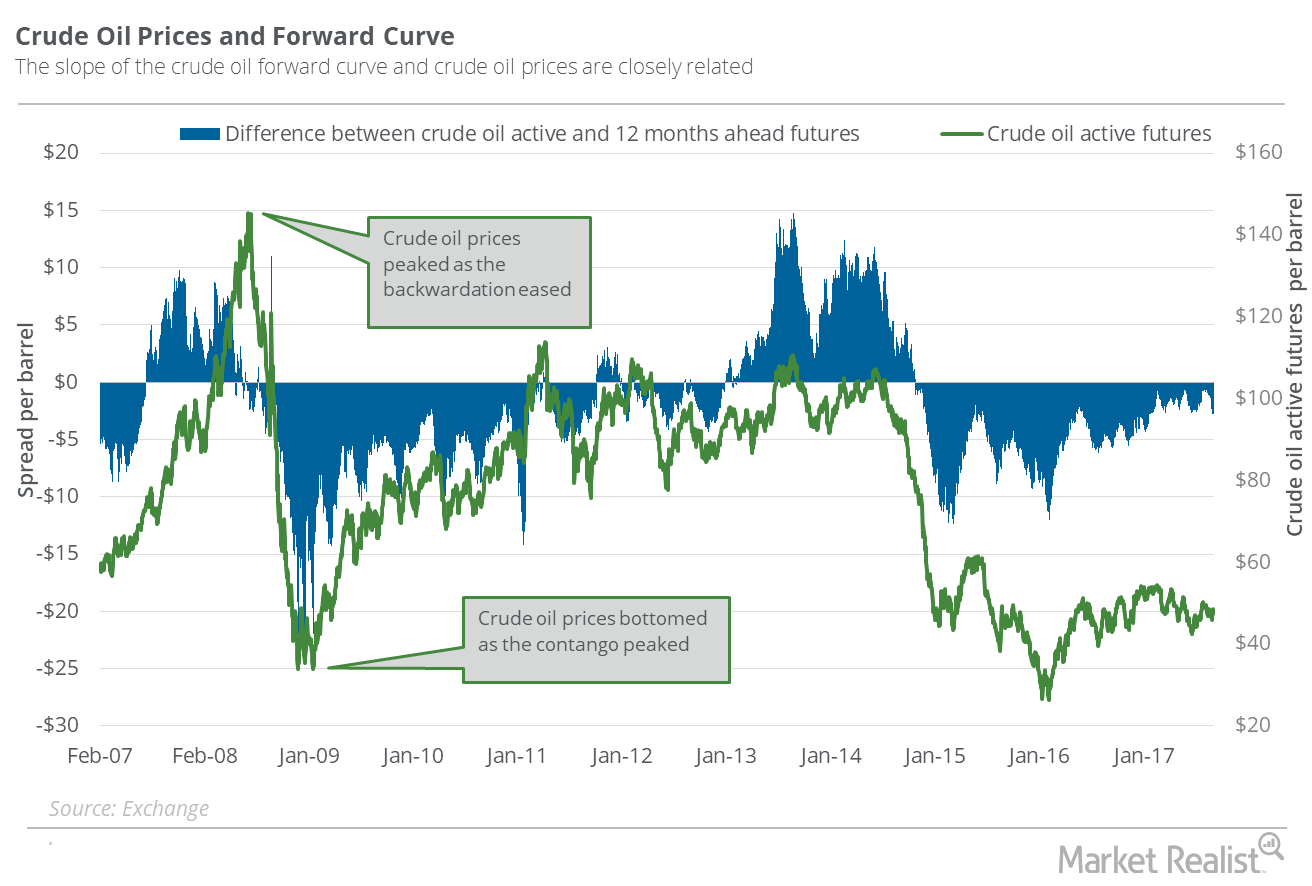
Have Oil Supply Glut Concerns Relaxed since Harvey?
On September 5, US crude oil October 2018 futures traded at a premium of $1.94 to October 2017 futures. On August 29, the premium was at $2.37.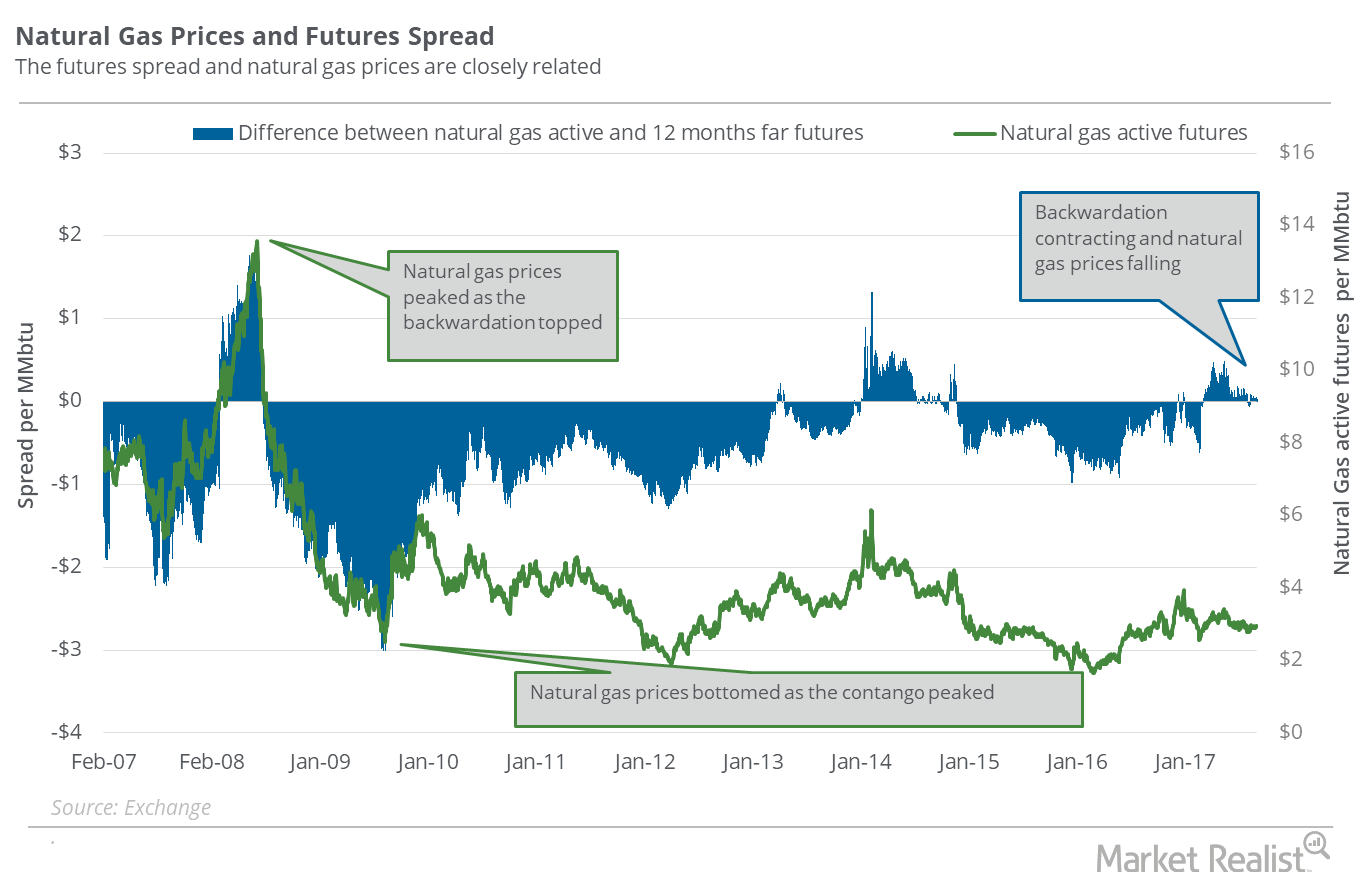
Natural Gas: Analyzing the Futures Spread
On August 30, 2017, natural gas October 2018 futures traded at a discount of ~$0.03 to October 2017 futures.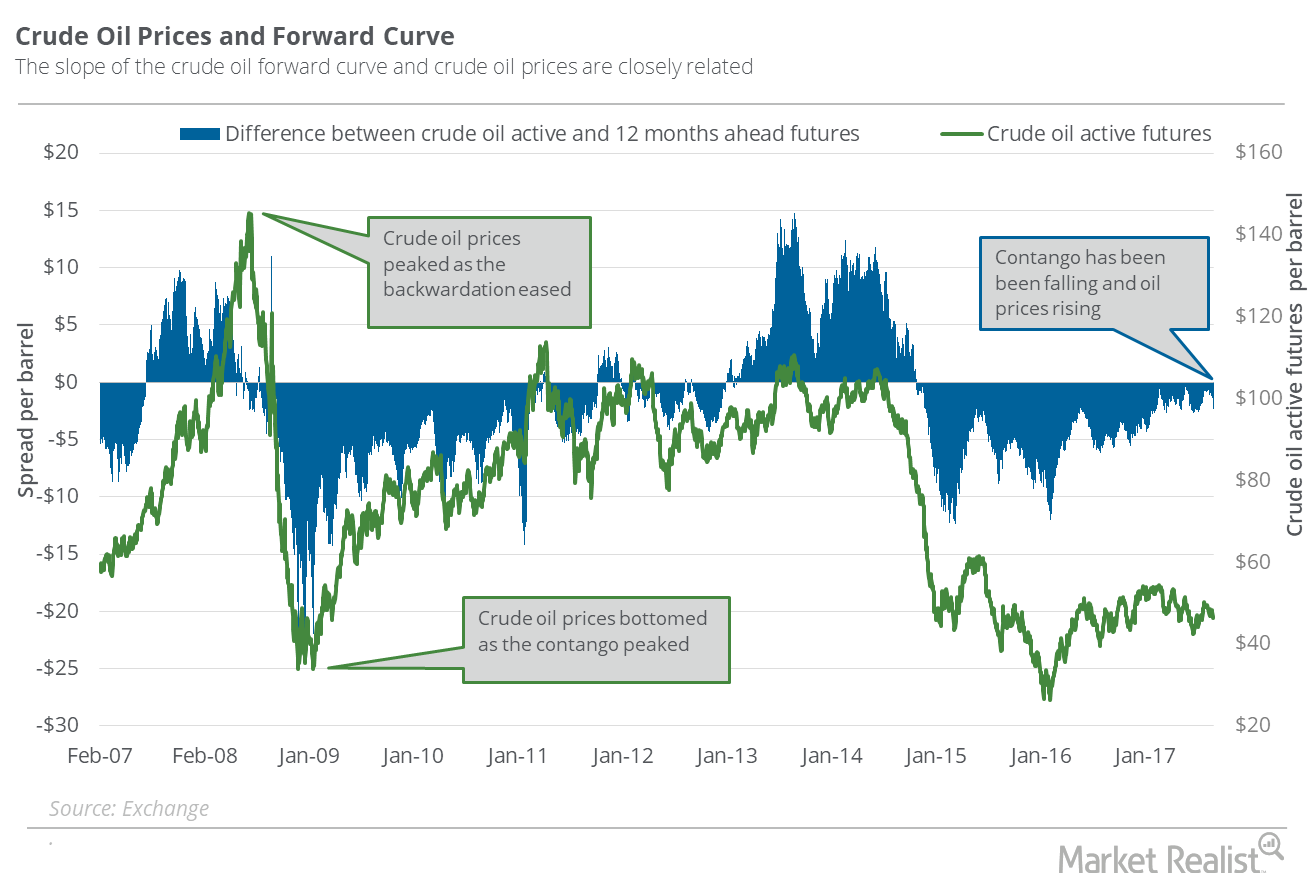
Oil’s Futures Spread: Have Supply Glut Concerns Increased?
On August 29, 2017, US crude oil (USL) October 2018 futures traded at a premium of $2.37 to October 2017 futures.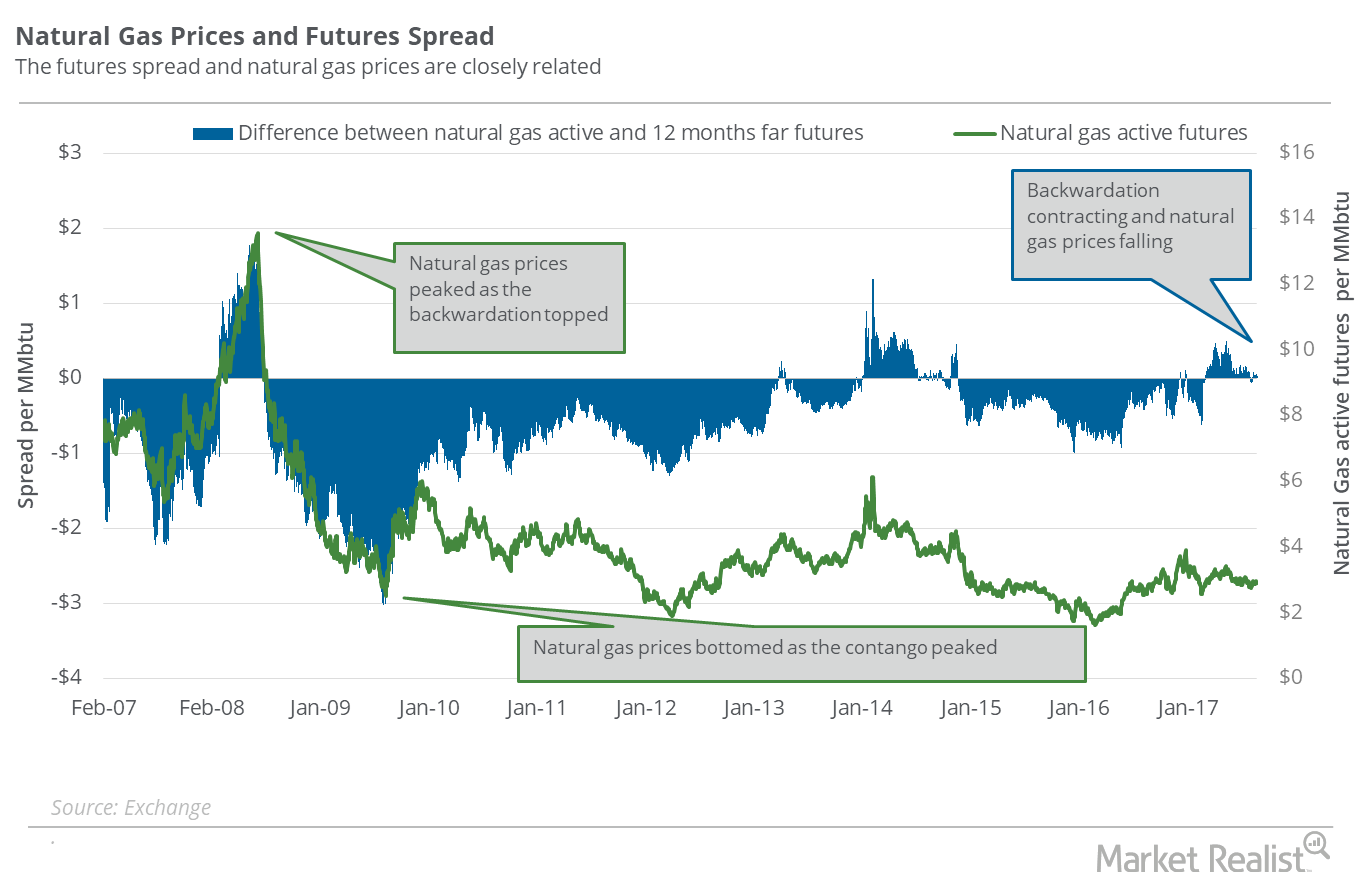
Natural Gas Futures Spread: Analyzing Supply-Glut Concerns
On August 23, 2017, natural gas September 2018 futures traded at a discount of $0.03 to September 2017 futures.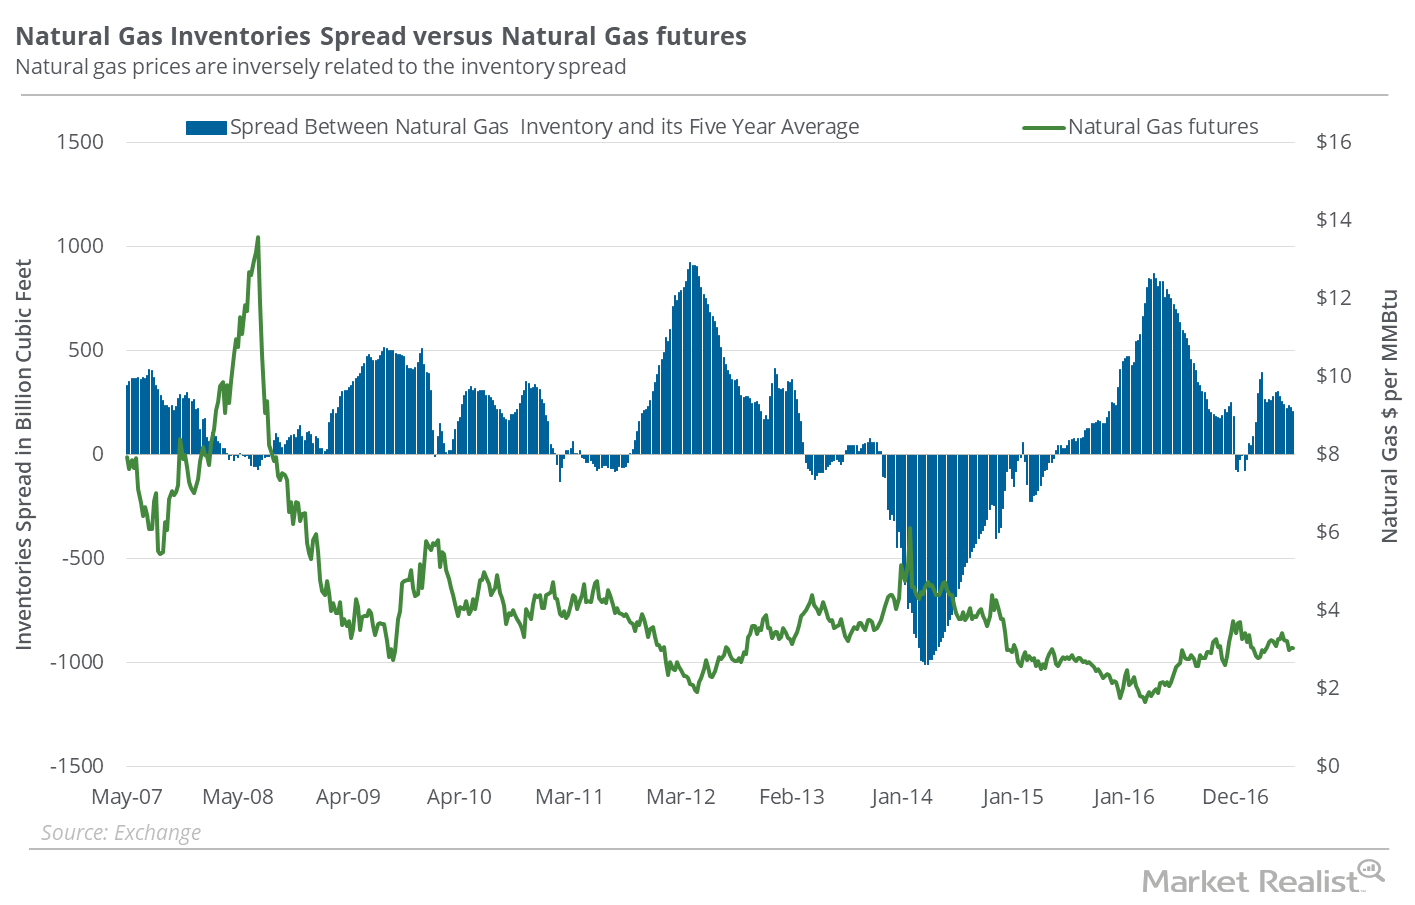
Why the Natural Gas Inventory Spread Supports Its Recent Recovery
In the week ended June 16, 2017, natural gas inventories rose 61 Bcf (billion cubic feet) to 2,770 Bcf based on EIA data released on June 22, 2017.
Natural Gas Inventories Spread: Savior for Natural Gas Bulls?
The EIA reported that natural gas inventories rose by 78 Bcf (billion cubic feet) to 2,709 Bcf in the week ending June 9, 2017.
What’s in the Natural Gas Inventory Spread—Bears?
In the week ended June 2, 2017, natural gas inventories rose by 106 Bcf.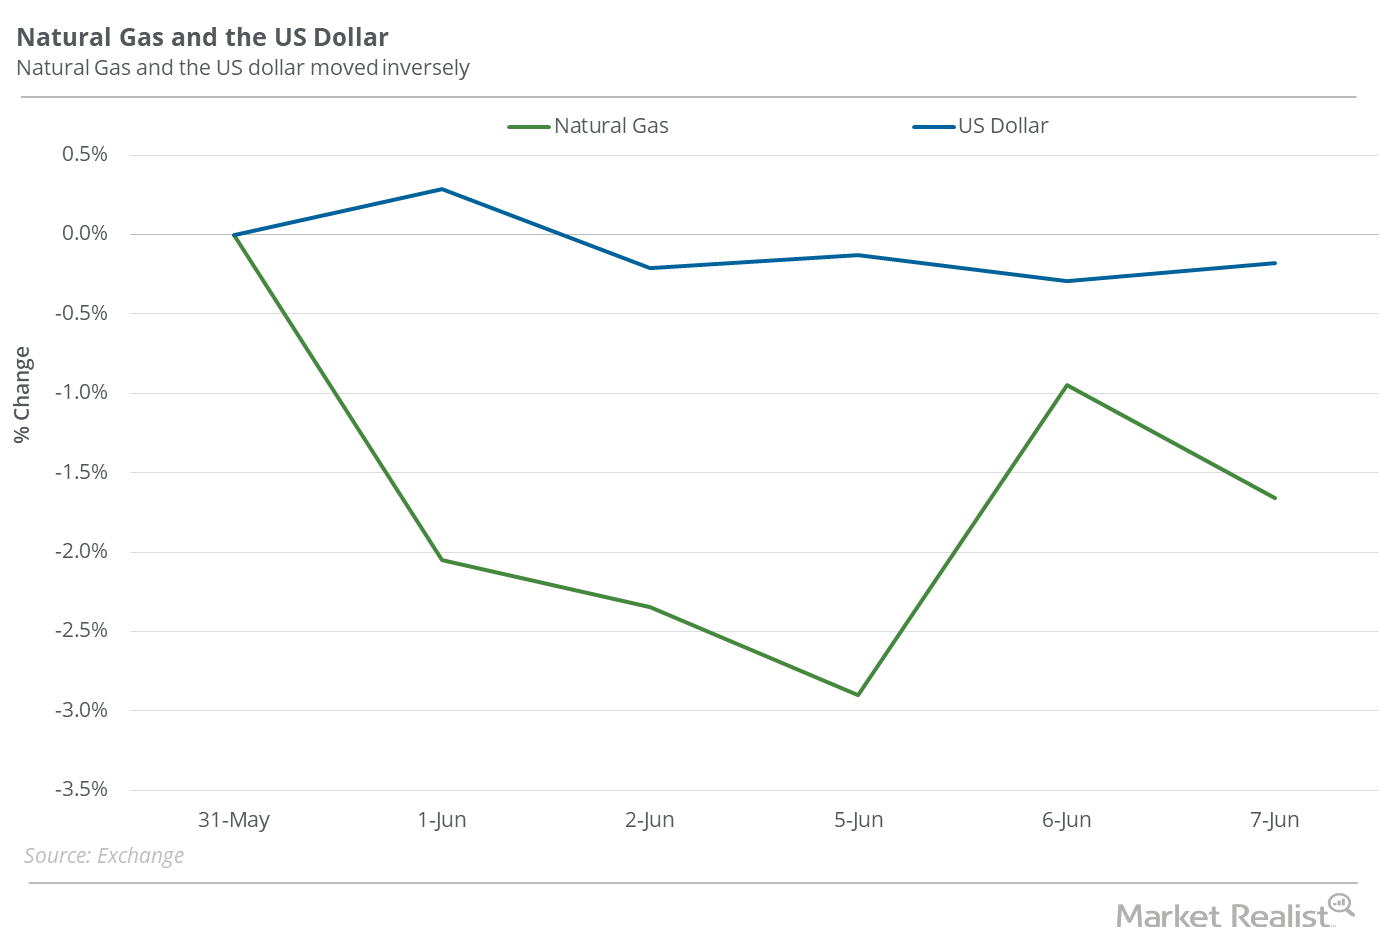
Is Natural Gas Reacting to the US Dollar?
Between March 3, 2016–June 7, 2017, natural gas active futures rose 84.1% while the US dollar fell 0.8%.
Chart in Focus: The Natural Gas Inventory Spread
Between January 27–June 7, 2017, natural gas active futures fell 10.9%. Natural gas inventories moved above their five-year average in the week ended January 27, 2017.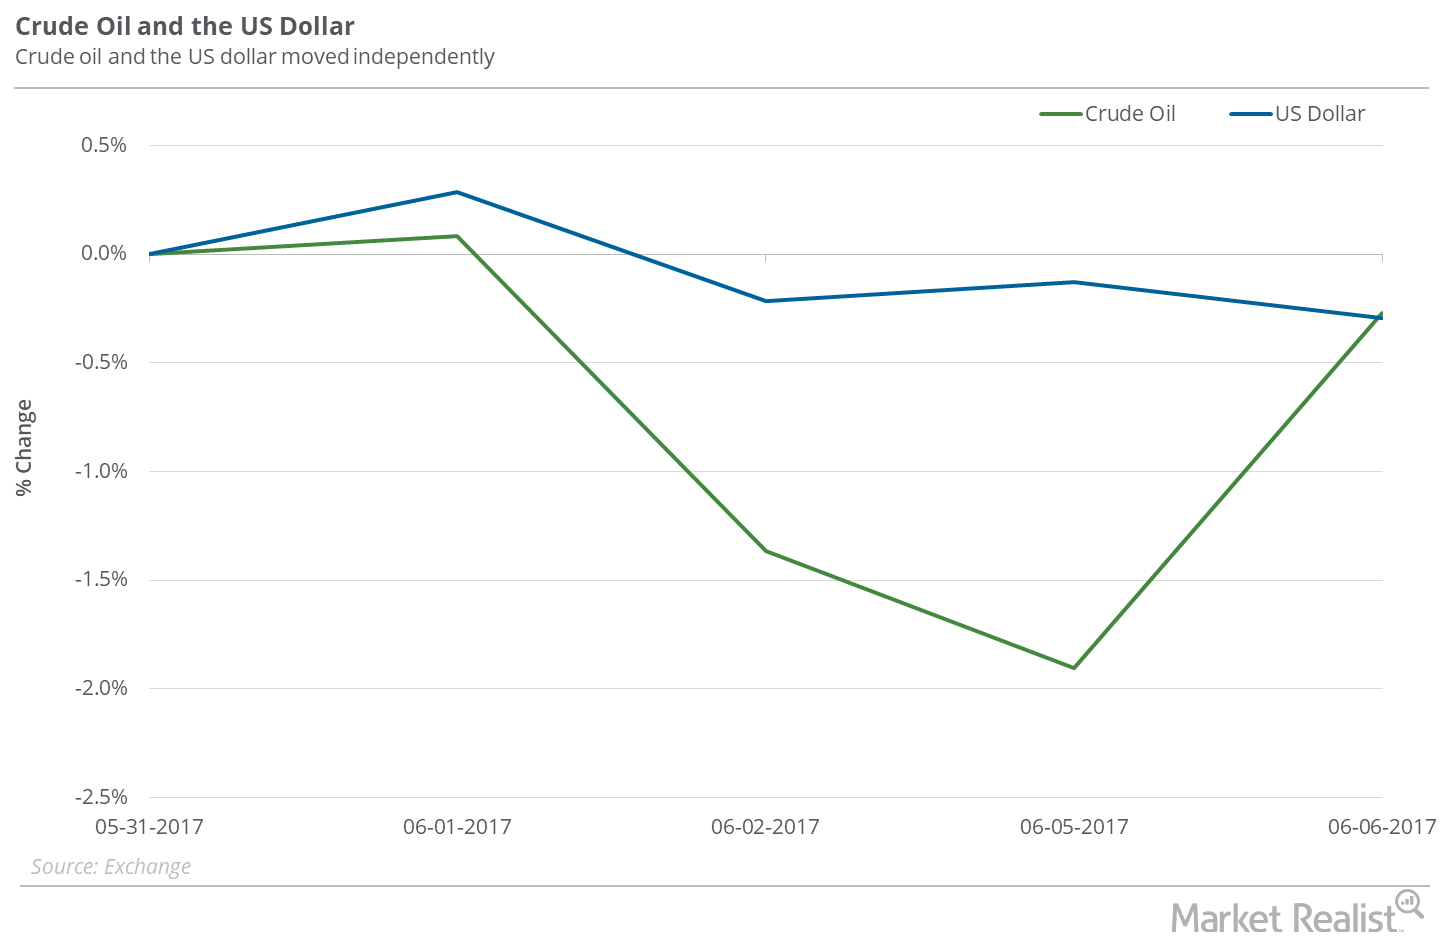
Is Crude Oil Ignoring the Falling Dollar?
Between May 30 and June 6, 2017, the US dollar (UUP) (USDU) (UDN) fell 0.7%, and crude oil (USO) (OIIL) July futures fell 3%.