Under Armour Inc
Latest Under Armour Inc News and Updates
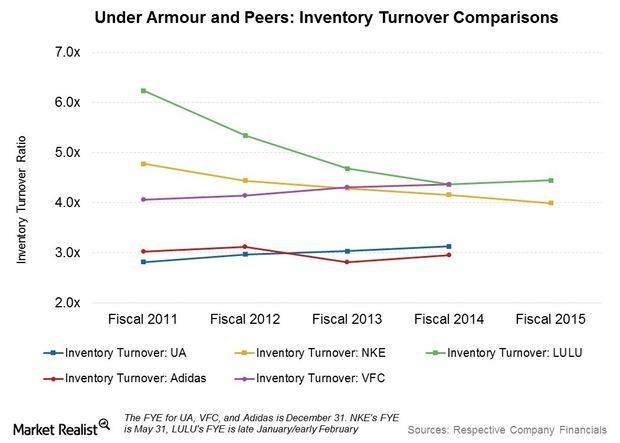
What’s Different about Under Armour’s Inventory Management?
Under Armour (UA) anticipates higher inventory growth over the next few quarters. It has made a number of changes on the inventory and supply chain side.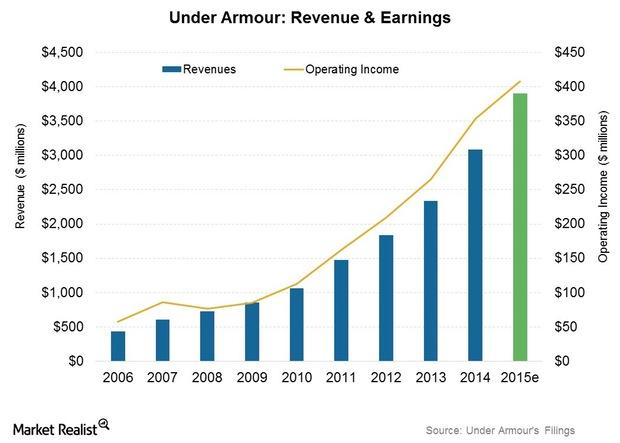
Under Armour Projects a ~26% Revenue Growth Rate for 2015
Under Armour is scheduled to declare its earnings for 4Q15 and full-year 2015 on January 28, 2016. It has projected revenue of $3.9 billion for 2015.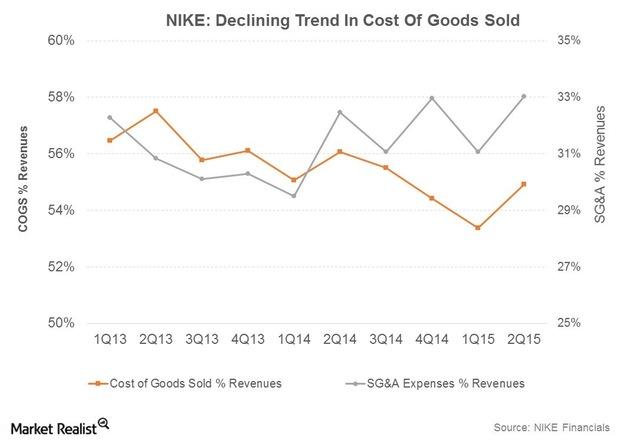
Reasons for NIKE’s Rising Profitability
NIKE is working to improve its profitability, as its margins trail industry peers such as Lululemon Athletica (LULU) and VF Corporation (VFC).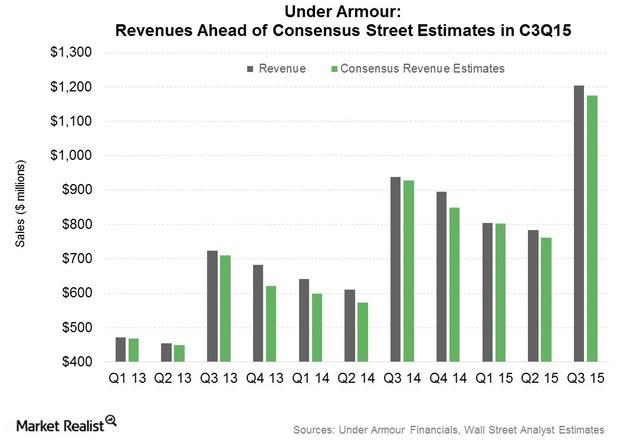
China Drove 3Q15 Sales Growth for Under Armour, Nike, and Adidas
This was a record quarter for Under Armour, with sales breaching the $1 billion mark for the first time.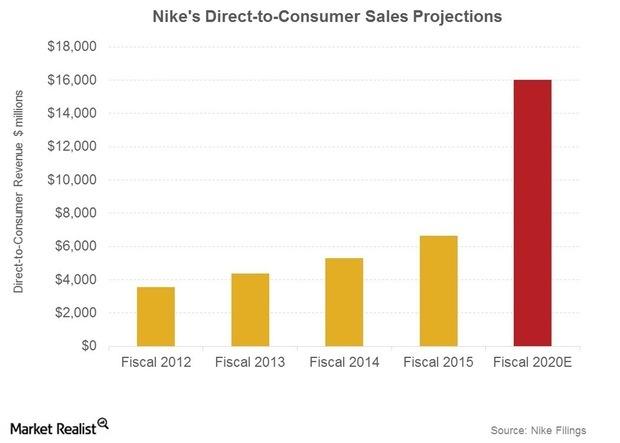
Why Nike Is Projecting Explosive Growth in Retail and Web Sales
Nike’s rival Adidas (ADDYY) is targeting over 2 billion euros from web sales by 2020, as detailed in its latest five-year plan unveiled in March 2015.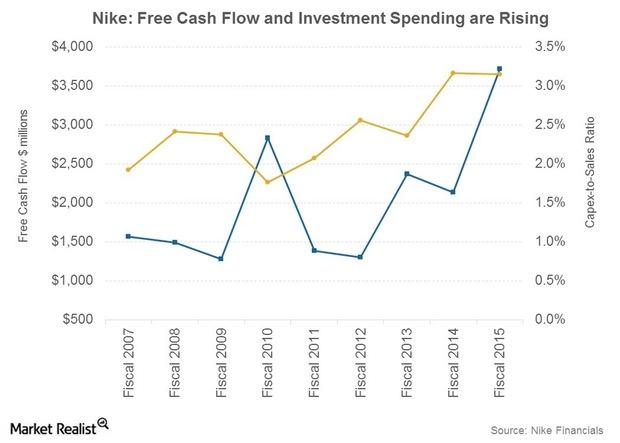
Nike’s Free Cash Flow Outlook and Projected Growth Investments
Nike expects to grow its Free Cash Flow, or FCF, at a faster pace compared to net income over the next five years through fiscal 2020. In fiscal 2015, FCF grew by ~74%.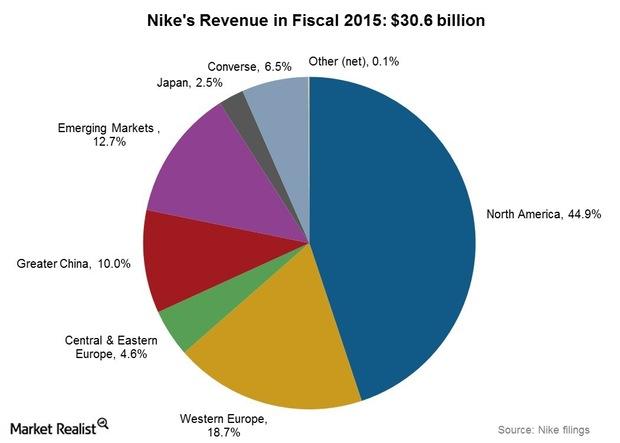
Can Nike Grow North American Sales to $20 Billion by 2020?
Performance for Nike and peers has been strong in North America over the past few years. The sports gear category has benefited from the improving US economy.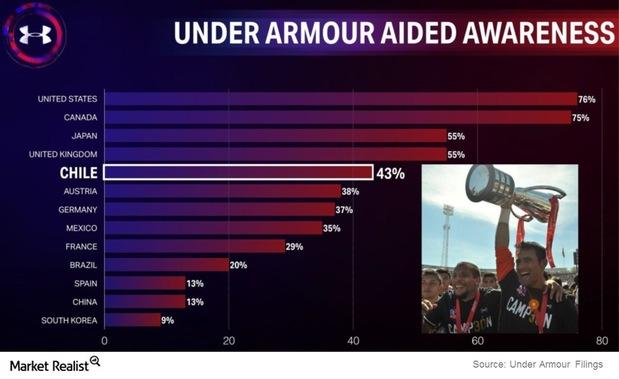
Why Under Armour Unveiled a Blueprint for International Expansion
Under Armour’s (UA) international operations are among its fastest-growing businesses.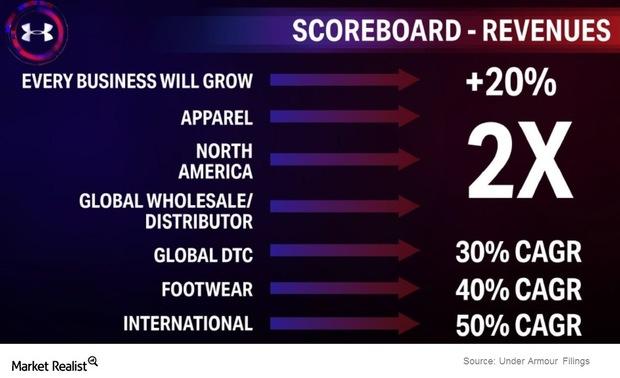
Analyzing Under Armour’s Latest Growth Updates
Under Armour is a growth company. In this series, we’ll discuss how the company plans to double its business in the next four years.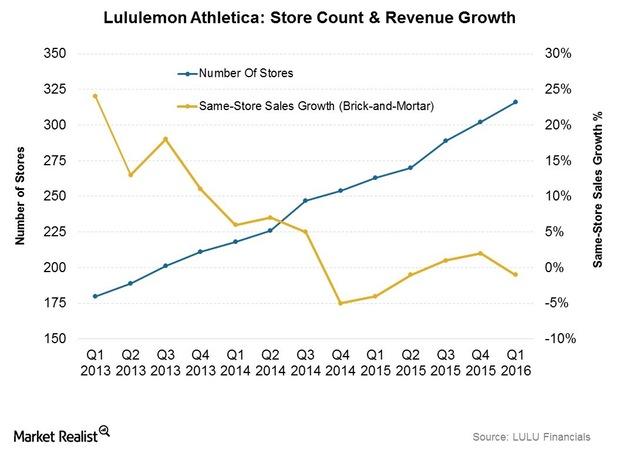
Analyzing Lululemon Athletica’s Revenue Performance this Year
Lululemon Athletica (LULU) reported revenue of $423.5 million in 1Q16, up 10% year-over-year.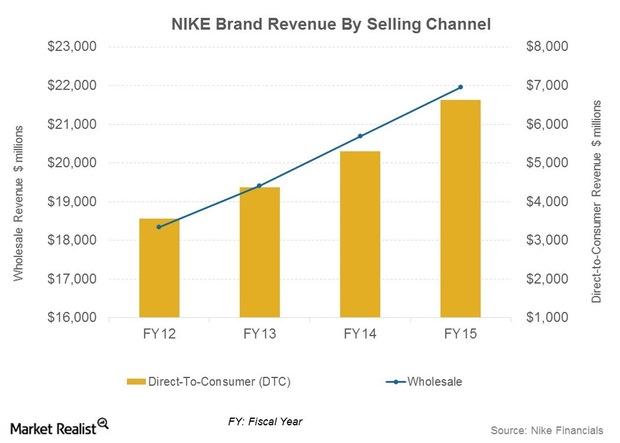
Why Nike Is Expanding Its Direct Retail Store Presence
Nike sales growth was fueled by new store openings, higher store comps, and growth in the e-commerce channel.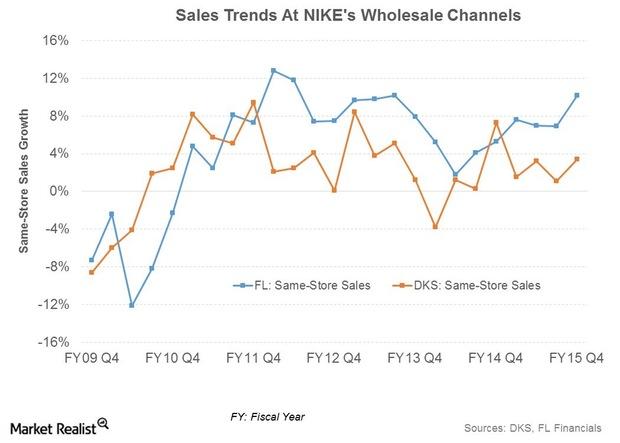
How Nike Benefits from Its Wholesale Partnerships
Nike (NKE) has a number of stores-within-stores, or exclusive standalone stores, partnering with retailers.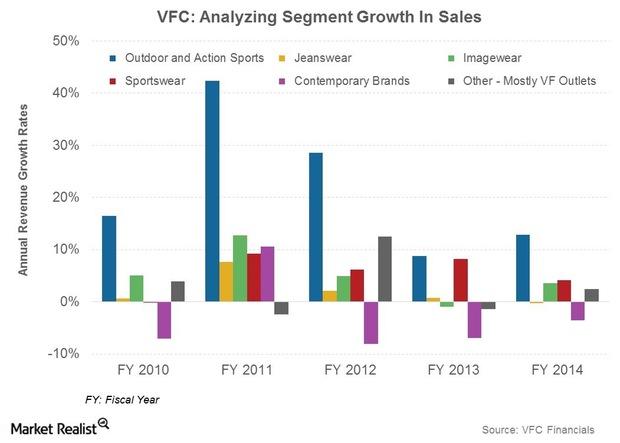
VF Corporation’s Big 3 And Other Brands In The Making
The company’s three major brands—The North Face, Vans, and Timberland—all reported double-digit growth rates in the quarter.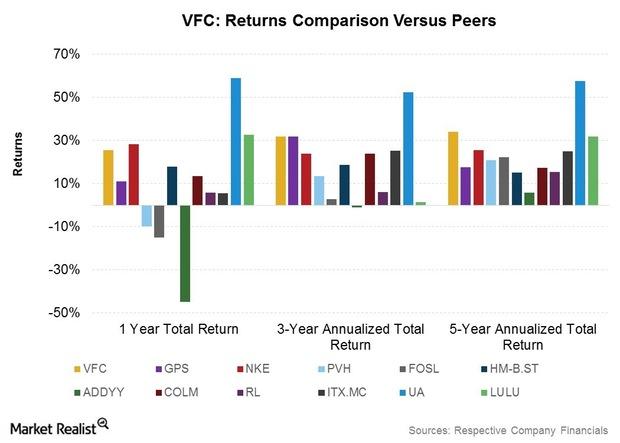
Shareholder Returns Analysis: Where VF Corp. Trumps Competitors
VFC’s total annualized returns to shareholders appear among the most consistent within its peer group for one-year, three-year, and five-year time periods.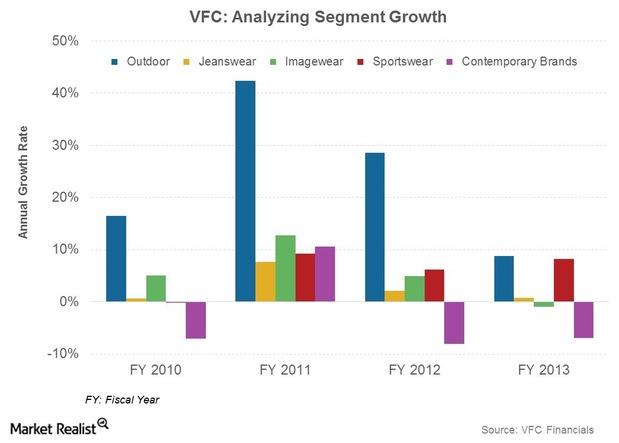
Making It To VF Corp.’s $2-Billion Brand Club
The North Face became VFC’s first brand to achieve $2 billion in sales in 2013. Timberland revenues are expected to come in at ~$1.7 billion in 2014.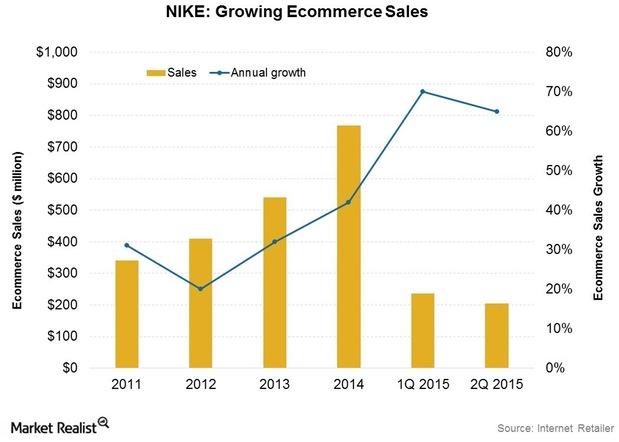
E-commerce: A Critical Growth Driver At NIKE
NIKE plans to grow DTC revenues to $8 billion by fiscal 2017, including e-commerce revenues of $2 billion. E-commerce grew 65% in 2Q15 to ~$205 million.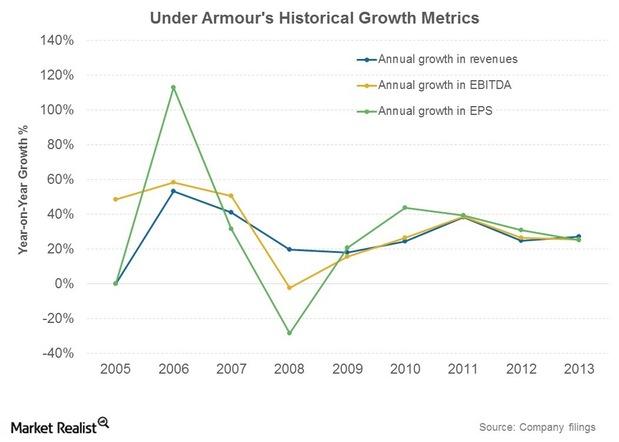
SWOT Analysis: Balancing Under Armour’s Strengths And Weaknesses
How strong is Under Armour’s business model? In the next parts of this series, you’ll read a SWOT analysis—looking at strengths, weaknesses, opportunities, and threats—of Under Armour, Inc. (UA). We’ll also compare the company to rival firms, the overall market, and the consumer discretionary (XLY) sector. In this part, we’ll cover the firm’s key strengths and weaknesses. […]
Why Lululemon Is Looking At A Global Store Footprint
LULU’s global store count was estimated at 289 at the end of 3Q15. Stores are company-owned, with most located in the US (201) and Canada (57).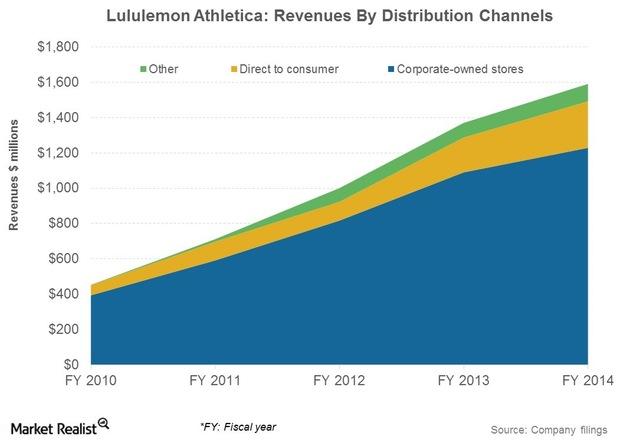
Why Lululemon’s Distribution Channels Are A Competitive Advantage
LULU’s sale through wholesale channels is much lower than its competitors VF Corporation, NIKE, and Under Armour. This is why LULU’s margins are higher.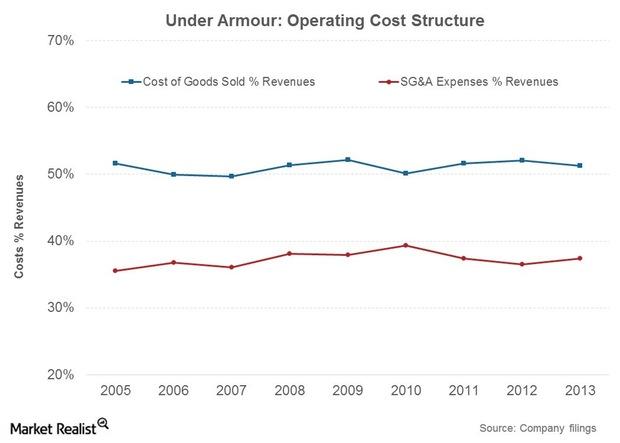
Under Armour’s Cost Profile And Outlook
Under Armour, Inc.’s cost of goods sold margins have been fairly steady over the years. SG&A costs are likely to trend higher in the near to medium term.
Lululemon Builds Brands Through Unique Marketing Strategies
For relatively new companies competing in an industry with many players, building a well-recognized and reputed brand is essential.
Overview: Lululemon’s Target Market And Product Assortment
Major product lines include fitness pants, shorts, tops and jackets. It also has a range of fitness-related accessories like bags, socks, and yoga mats.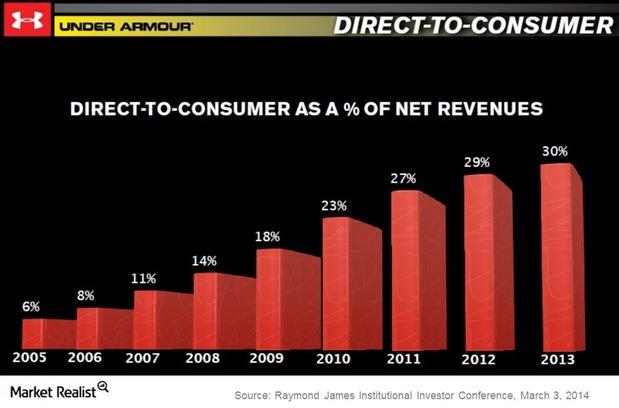
Under Armour revenues and retail presence
Wholesales represented 68% of Under Armour revenues in 2013. As a category, however, DTC sales have increased steadily over the years.
Porter’s 5 Forces: Under Armour And The Sportswear Industry
Porter’s 5 Forces, developed by Harvard Business professor M. Porter, is a model of analysis used to gauge the level of competition within an industry.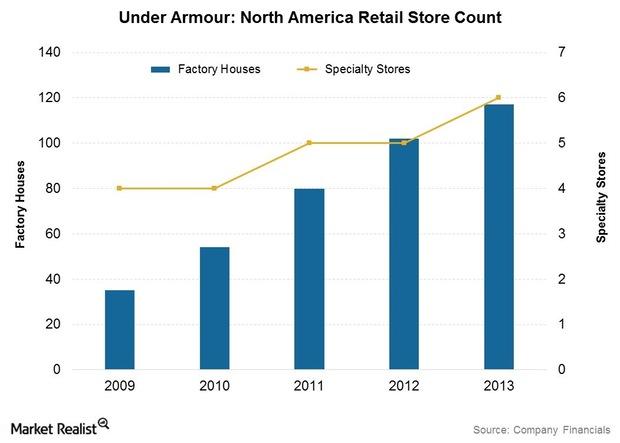
The Cogs In The Under Armour Supply Chain
Under Armour: Sourcing, manufacturing, and distribution decisions Under Armour, Inc. (UA) manufactures virtually nothing in-house. Production is outsourced to third-party manufacturers overseas. This is common practice in the apparel industry among companies including the The Gap, Inc. (GPS) and Fossil, Inc. (FOSL). These companies are held by the Consumer Discretionary Select Sector SPDR ETF (XLY), as are United Armour, or […]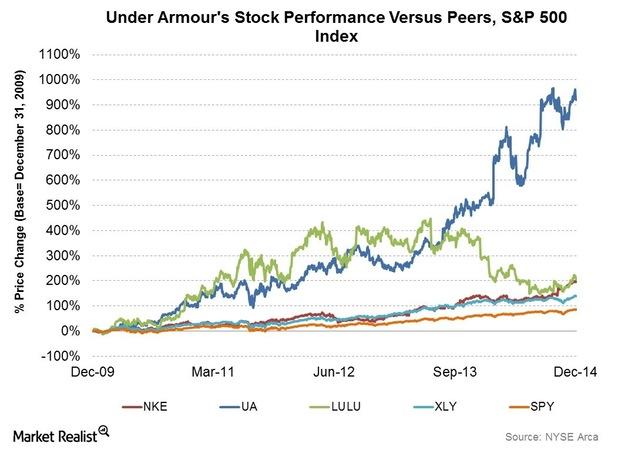
Understanding The Under Armour Growth Story
Under Armour’s stock price growth has been phenomenal—up by over 10x in the last five years. This dwarfs the ~200% increase seen by market leader NIKE.
