PowerShares Dynamic Large Cap Value ETF
Latest PowerShares Dynamic Large Cap Value ETF News and Updates
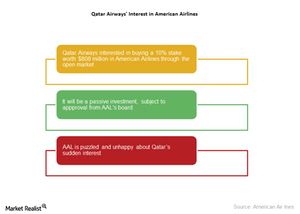
Why Is Qatar Airways Interested in American Airlines?
In the last week of June 2017, Qatar Airways’ CEO, Akbar Al Baker, disclosed the carrier’s interest in buying a 10% stake worth $808 million in American Airlines through the open market.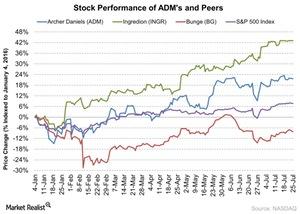
Archer Daniels Midland Stock Gained since Its 1Q16 Earnings
Archer Daniels Midland (ADM) is slated to report its 2Q16 results on August 2 before the market opens. The stock has gained 12% since its last quarter results.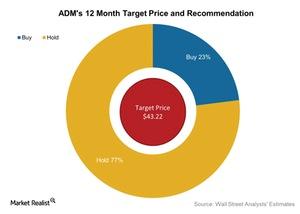
What Are Analysts’ Target Prices before ADM’s 2Q16 Results?
Around 77% of the analysts rate Archer Daniels Midland a “hold” and 23% gave it a “buy” rating. No analysts rated it as a “sell.”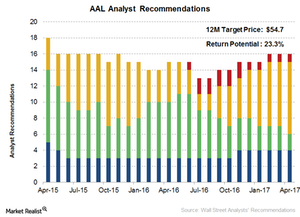
Fewer Analysts Recommend ‘Buys’ on American Airlines
Analysts’ “hold” ratings on American Airlines stock have risen significantly. Nine analysts, a total of 56.3%, now have “hold” ratings on the stock.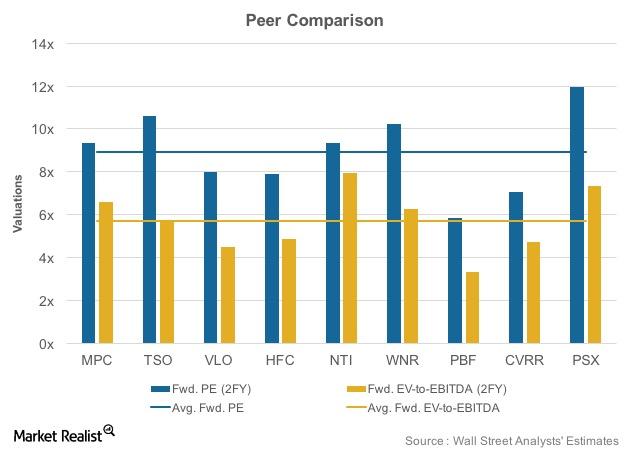
What Do Refining Stock Valuations Reveal?
With respect to the price-to-earnings ratio, larger players Marathon Petroleum (MPC), Tesoro (TSO), and Phillips 66 (PSX) trade higher than the average valuations.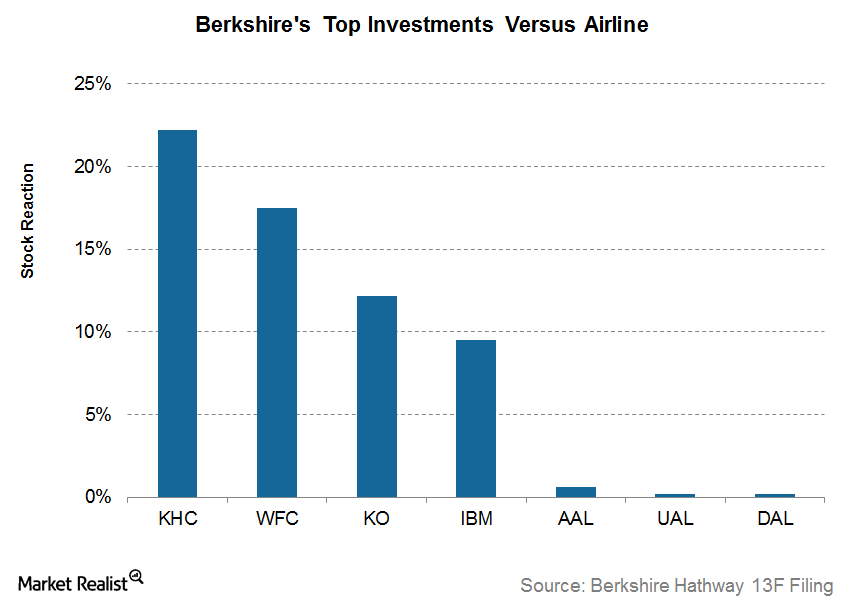
Why Is American Airlines Warren Buffett’s Top Pick?
Berkshire Hathaway’s (BRK.B) November 2016 13F filing attracted considerable interest for airline investors. The 13F revealed Warren Buffett’s new investments in the airline sector—a sector he had written off during the past decade.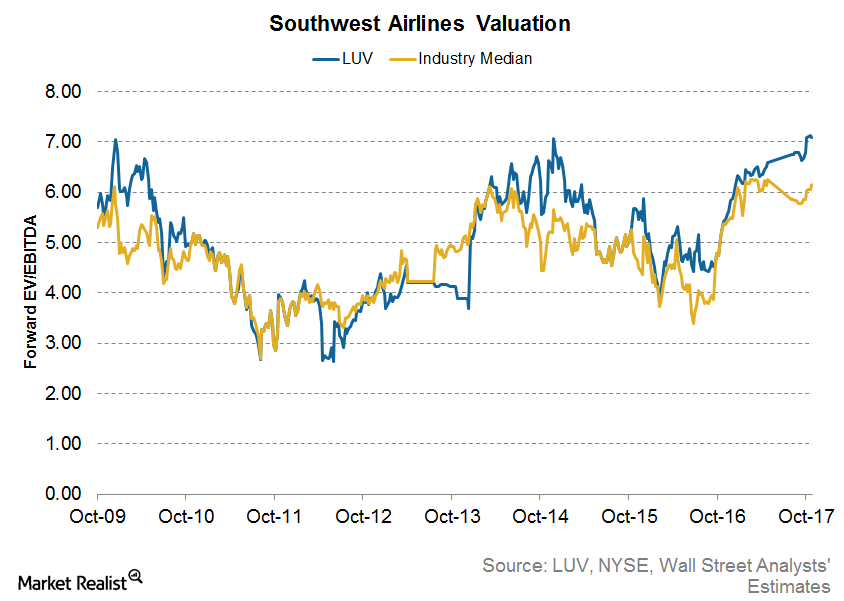
What Does Southwest Airlines’ Current Valuation Indicate?
Current valuation Southwest Airlines (LUV) has a forward EV-to-EBITDA[1. enterprise value to earnings before interest, tax, depreciation, and amortization] multiple of 7.1x. This is the highest multiple among the major airline carriers and is higher than its average valuation of 6.3x since September 2008. Peer comparisons American Airlines (AAL) is trading at a similar valuation […]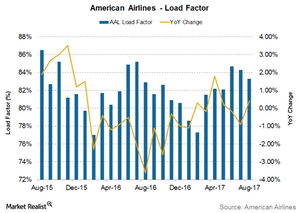
Could American Airlines’ Unit Revenues Decline in 2H17?
TK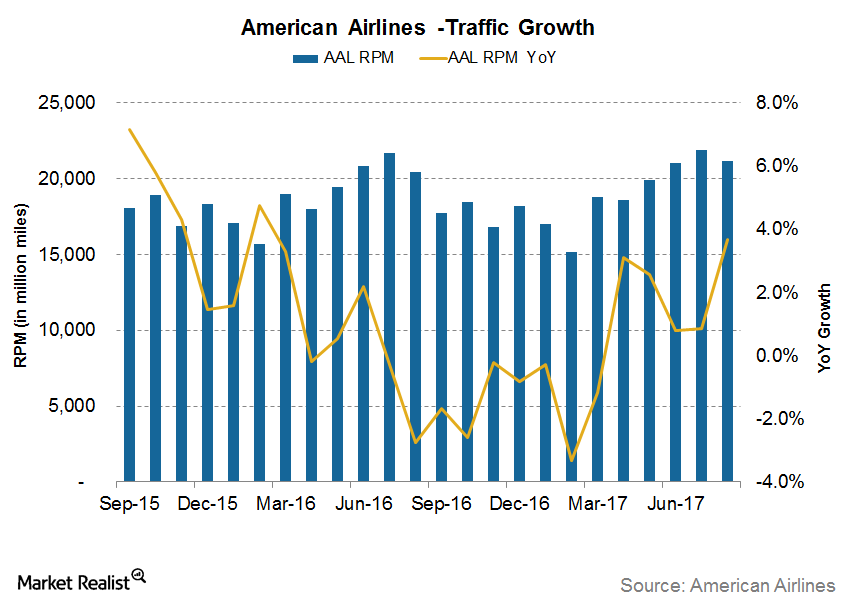
American Airlines’ Traffic Growth Exceeds Its Capacity Growth
For August 2017, AAL’s international traffic increased 6.9% year-over-year. Year-to-date, its international traffic has increased 5.5% YoY.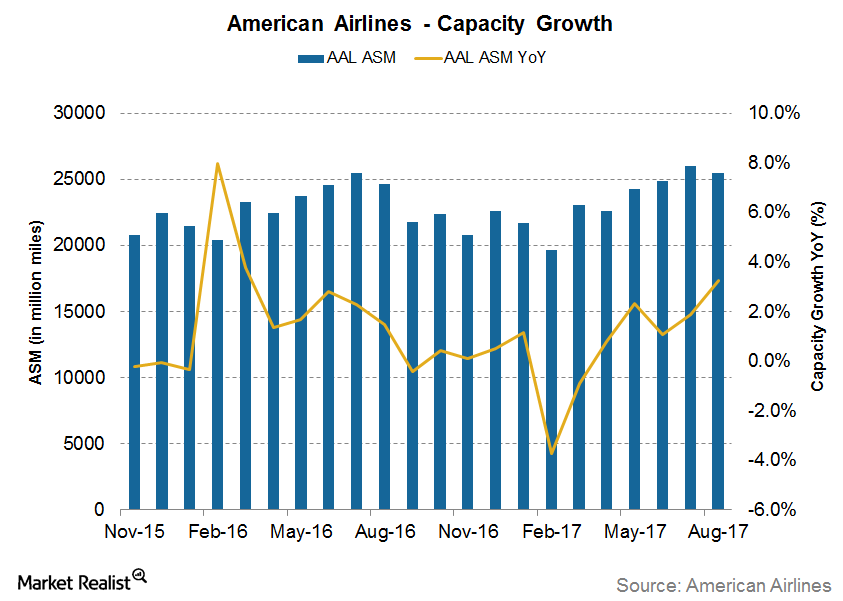
American Airlines’ Capacity Outpaced Its Legacy Peers in August
American Airlines’ (AAL) capacity grew 3.2% year-over-year in August, significantly higher than its 0.4% year-over-year growth reported in the previous seven months.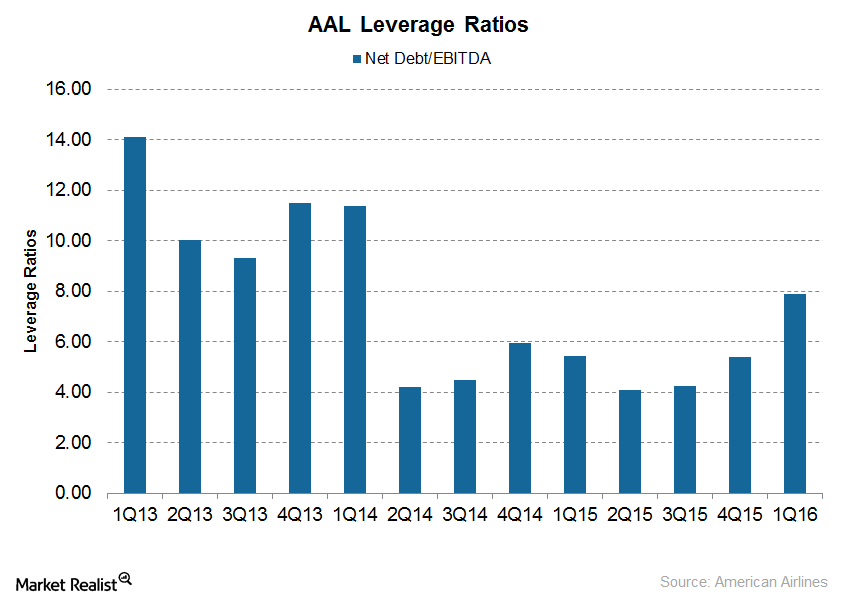
Why Investors Should Be Concerned about American Airlines’ Debt
AAL has paid little attention to its total debt, which rose from $20.8 billion at the end of 2015 to $24.3 billion at the end of 2016 and $24.5 billion at the end of 1Q17.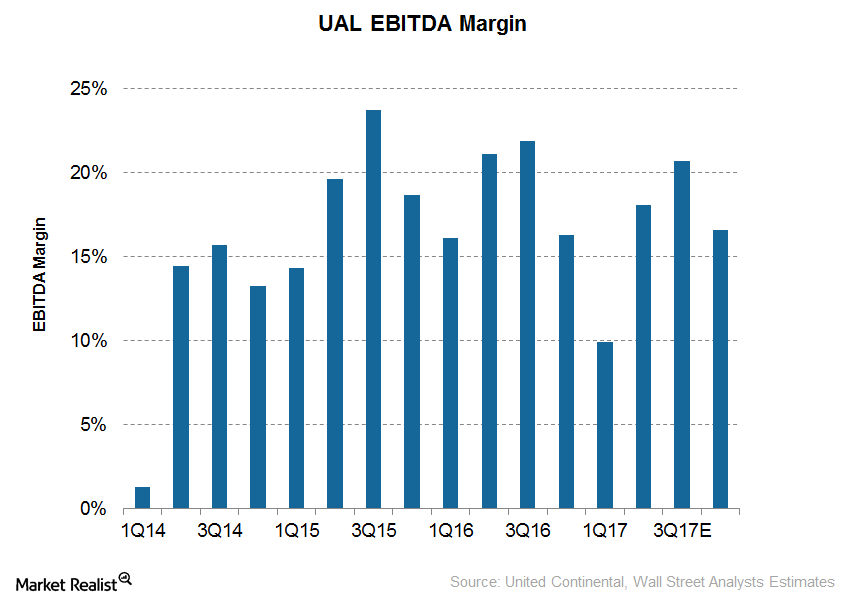
Can United Continental Improve Its Margins in 2017?
United Continental’s (UAL) EBITDA is expected to fall 10% to $1.8 billion.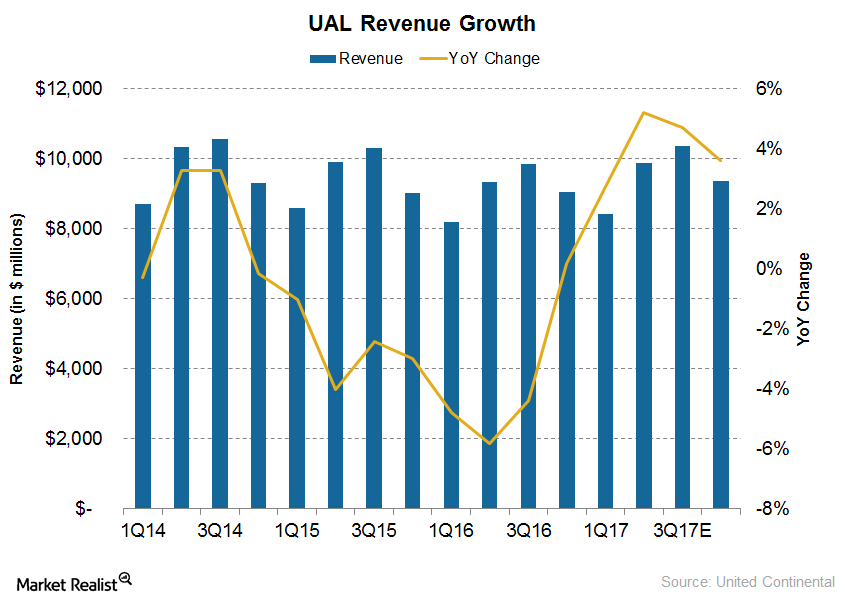
Will United Continental Meet Increased Capacity Growth Guidance?
At the start of the year, United announced its plan to grow its capacity by 0%–1%, in line with GDP growth expectations.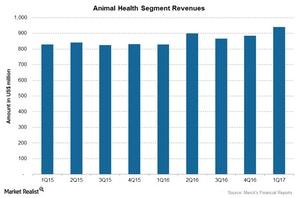
Merck & Co.’s Animal Health Segment’s 1Q17 Revenues
The global revenues from Merck’s Animal Health business totaled $939 million during 1Q17—13% growth over 1Q16.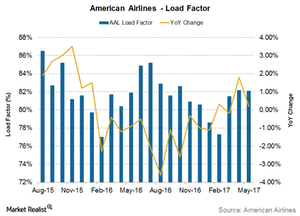
Why American Airlines Improved Its Unit Revenue Guidance for 2Q17
AAL’s utilization rose 0.3% YoY (year-over-year) in February, then by 1.8% YoY in April and 0.2% YoY in May.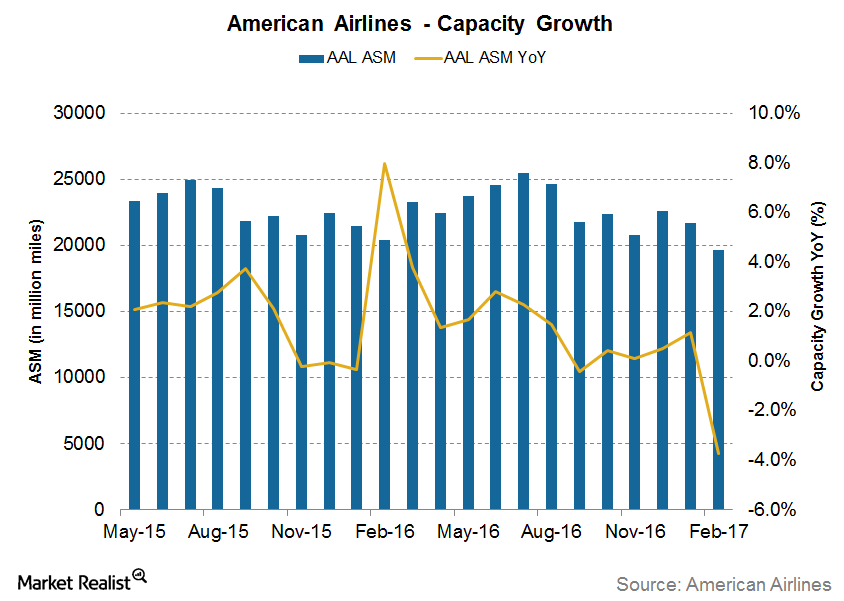
Will American Follow United Continental in High Capacity Growth?
For May 2017, American Airlines (AAL) reported a 2.3% YoY (year-over-year) growth in capacity—its highest growth so far in 2017.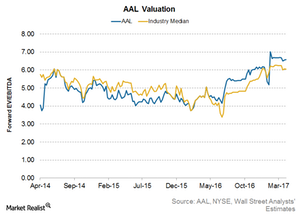
American Airlines’ Valuation: What’s Priced In?
Currently, American Airlines (AAL) is valued at 6.6x its forward EV-to-EBITDA ratio (enterprise value to earnings before interest, tax, depreciation, and amortization).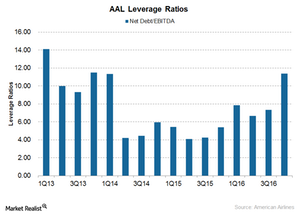
Why American Airlines Has Higher Debt Compared to Its Peers
As opposed to most other airlines that have been reducing their debts, American Airlines’ (AAL) debt has risen, partly due to its focus on completing its integration with US Airways.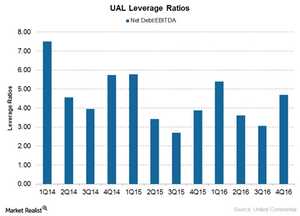
United Continental’s Debt: What You Need to Know
For 2016 overall, United Continental (UAL) has generated $5.5 billion in operating cash flow and $1.9 billion in free cash flow.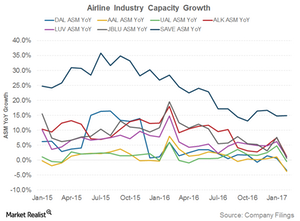
United’s Increased Capacity Growth: Should Investors Worry?
Airlines have long been known as capital destroyers. In times of profitability (such as now), they increase capacity to an extent that can’t be filled.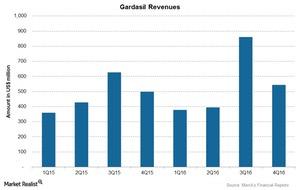
This Is Driving Merck’s Vaccines Business
The Gardasil franchise is Merck’s (MRK) leading vaccines franchise.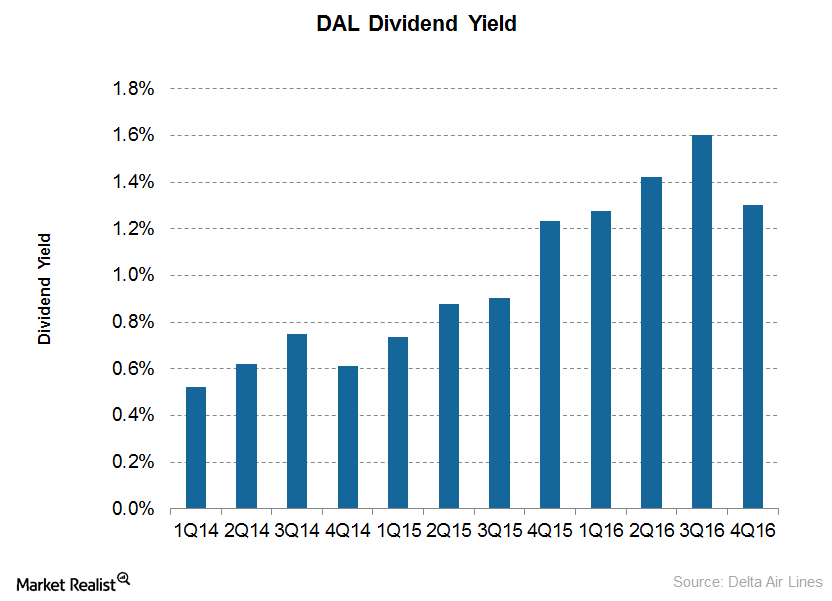
Can Delta Air Lines Increase Its Dividend Payouts in 2017?
Delta Air Lines started paying dividends only in 2013, and it’s one of the few airlines that pay dividends.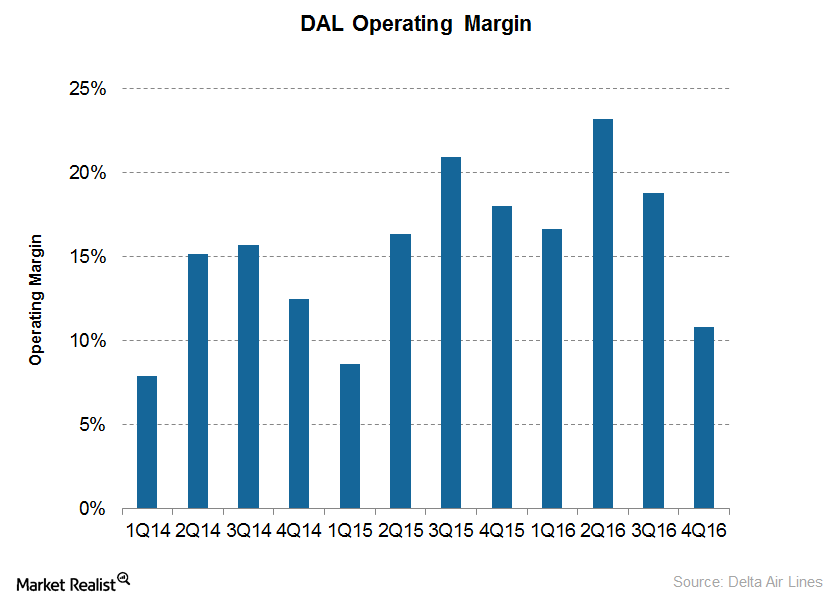
Will Delta Air Lines’ Fuel Costs Keep Falling in 2017?
Until 3Q16, Delta Air Lines (DAL) had managed to keep its costs flat if not decreasing. However…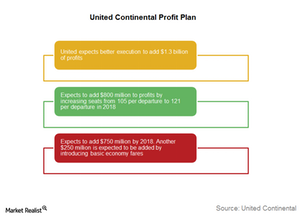
How Does United Continental Plan to Improve Margins?
United expects to add $800 million to profits by increasing seats from 105 per departure to 121 per departure in 2018.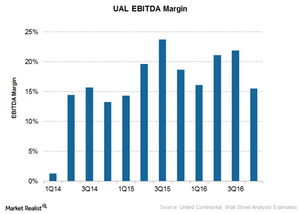
Will United Continental’s Margins Improve in 2017?
For 4Q16, analysts are expecting United Continental’s (UAL) EBITDA to fall 26% to $1.4 billion.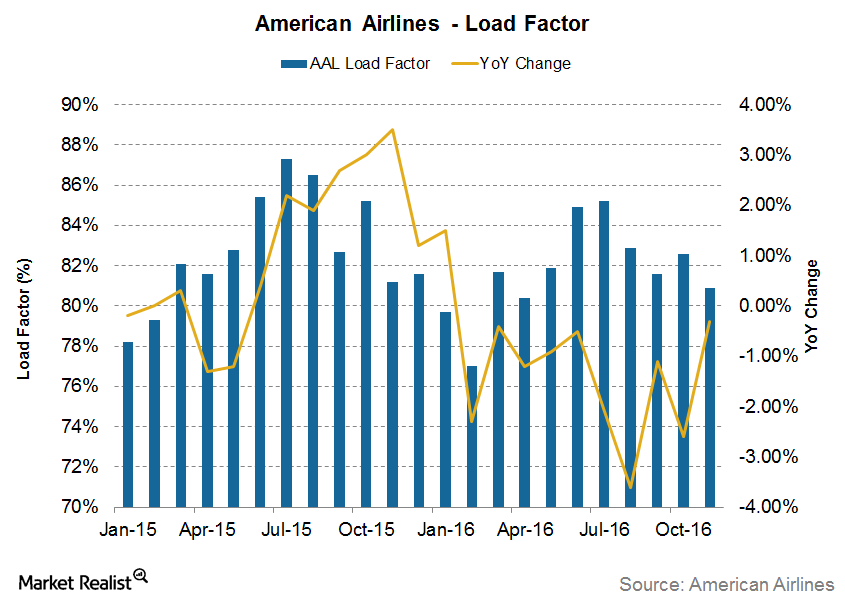
Will American Airlines’s Unit Revenues Continue to Decline?
For November 2016, American Airlines’s (AAL) load factor fell 0.3% and year-to-date 2016, its load factor fell 1.3%.
American Airlines’s Traffic Growth Lags Capacity Growth
In November 2016, American Airlines’s (AAL) traffic fell 0.2% year-over-year, slightly lagging its capacity growth in the same period. Year-to-date, AAL’s traffic has increased 0.3%.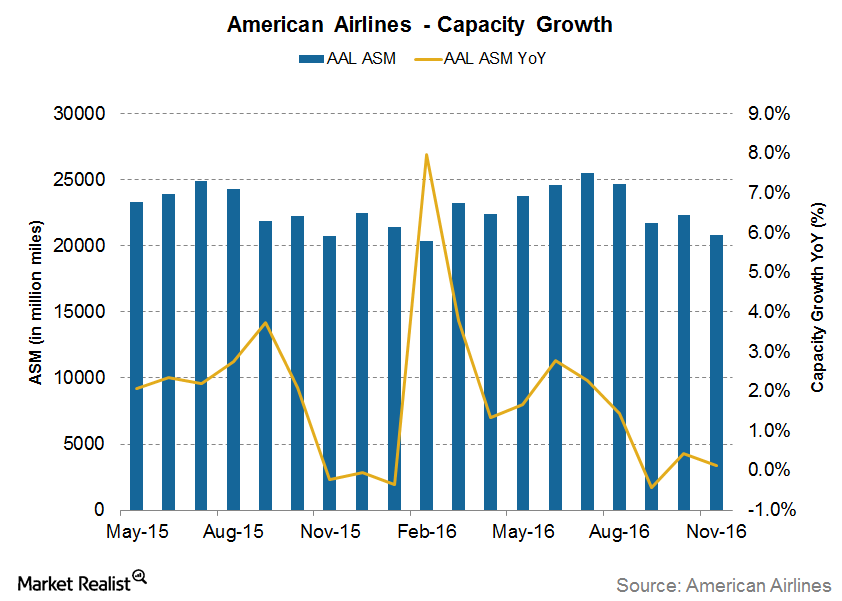
Is American Airlines’s Capacity Growth Finally Slowing Down?
American Airlines’s (AAL) capacity grew 0.1% year-over-year in November 2016, similar to the growth seen during most of 2016. Year-to-date, AAL’s capacity has grown 1.9%.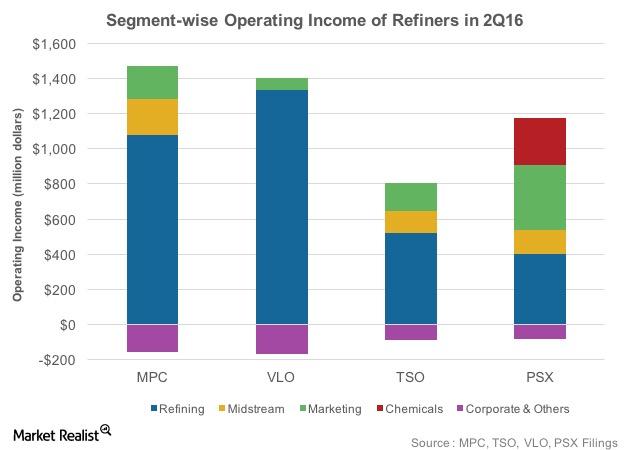
How PSX’s Operating Income Differs from Those of MPC, VLO, TSO
Refiners such as PSX, MPC, VLO, and TSO are now focusing on diversifying their earnings models to shield themselves from the volatile refining environment.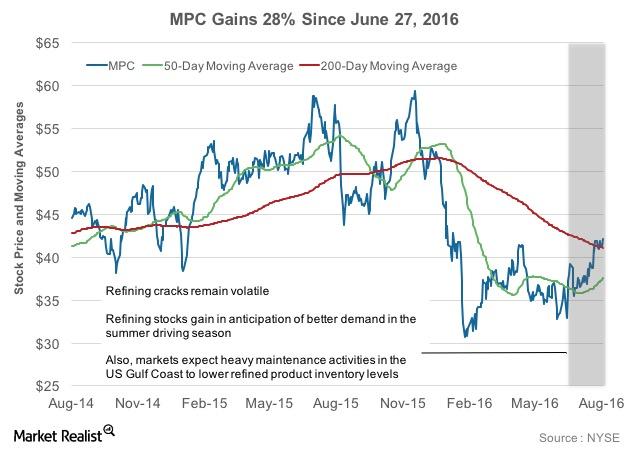
Marathon Petroleum’s Stock Performance: Up by 28% since June 30
Since the end of June, Marathon Petroleum’s (MPC) stock has risen by 28%. MPC has crossed over its 50-day and its 200-day moving averages during this period.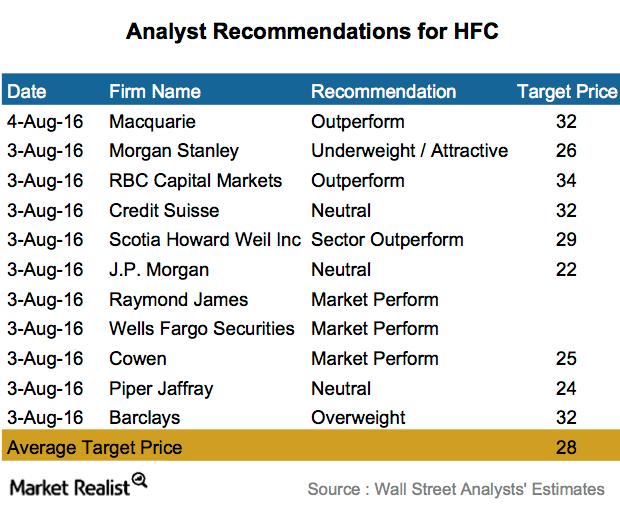
What Are Analysts’ Recommendations for HollyFrontier?
The analysts’ survey shows that six out of the 11 companies surveyed rated HollyFrontier (HFC) as “neutral” or “market perform.”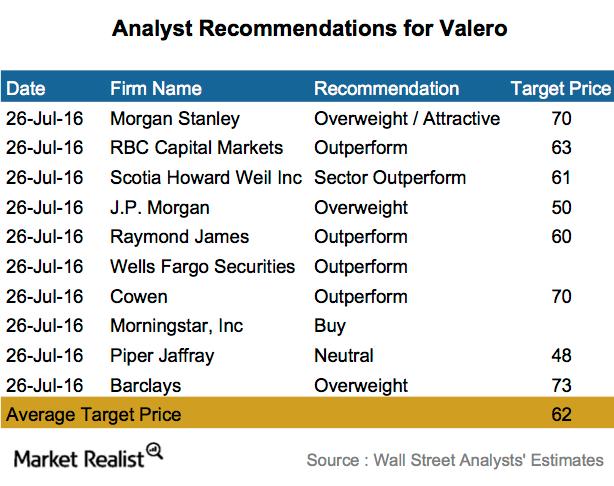
What Do Analysts Recommend for Valero after 2Q16 Earnings?
Nine out of ten companies surveyed rated Valero (VLO) a “buy,” “overweight,” or “outperform.”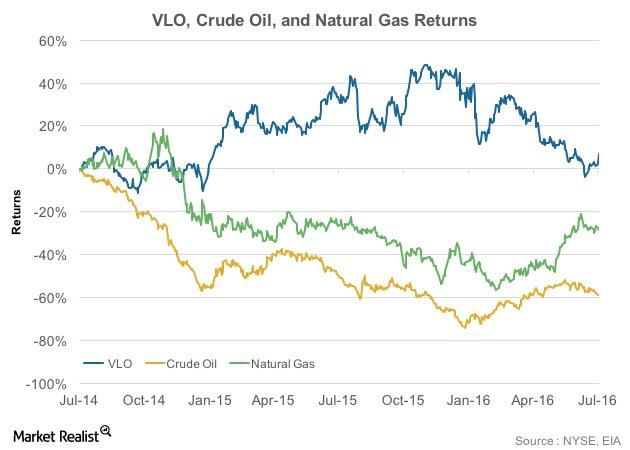
Valero’s Stock Rose 4.7% Following Its Earnings Release
Valero Energy (VLO) announced its results on July 26, 2016, before the market opened.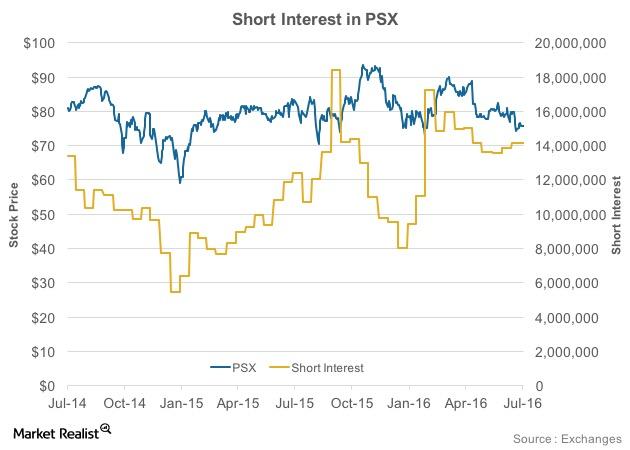
What Does an Analysis of PSX’s Short Interest Reveal?
Since mid-February 2016, Phillips 66 (PSX) has witnessed an 18% fall in its short interest.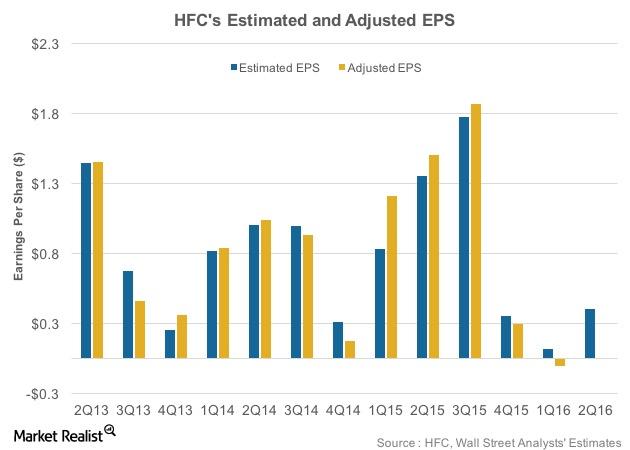
HollyFrontier’s 2Q16 Earnings Expected to Outshine Those of 1Q16
Wall Street analysts expect HollyFrontier to post EPS of $0.35, which is 76% lower than its 2Q15 adjusted EPS.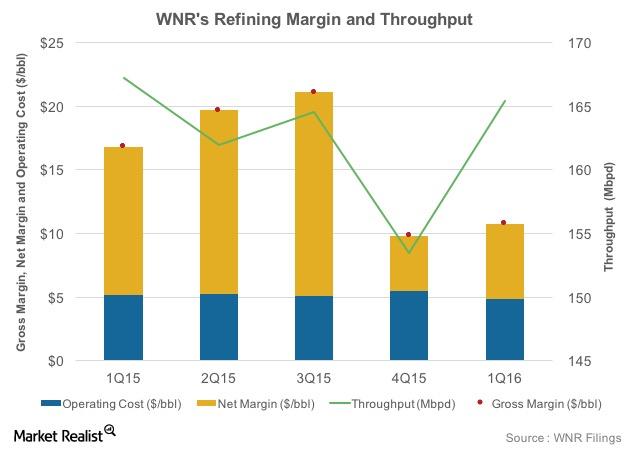
Will WNR’s Refining Margin Trend Higher This Quarter?
Western Refining (WNR) recorded a fall in gross refining margins, from $16.80 per barrel in 1Q15 to $10.80 per barrel in 1Q16.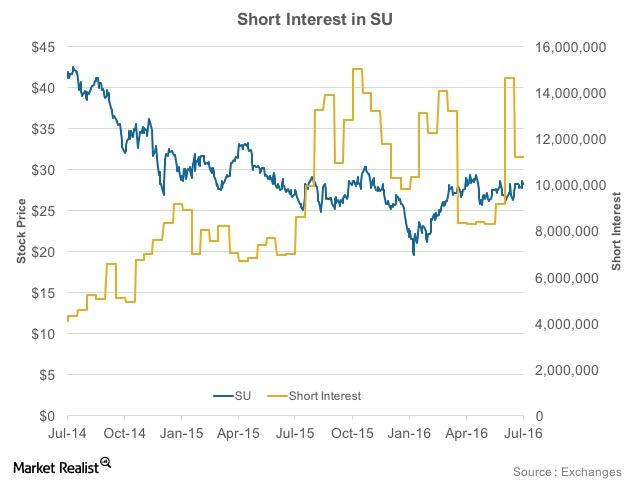
What Does Suncor’s Short Interest Analysis Reveal?
Suncor Energy (SU) has witnessed a 34% rise in its short interest since April 2016.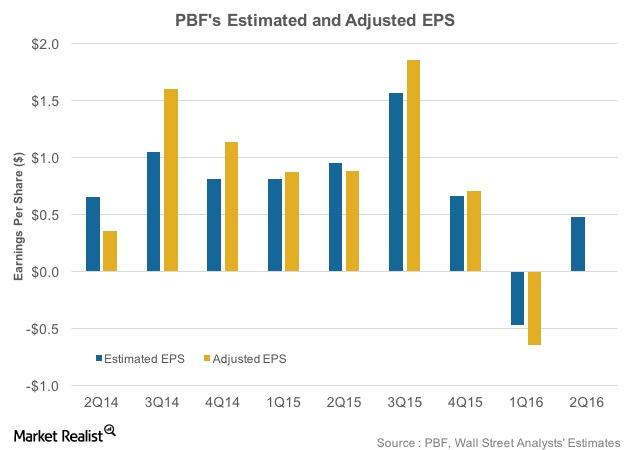
What Do Analysts Expect from PBF Energy’s 2Q16 Earnings?
In 1Q16, PBF Energy’s revenues surpassed Wall Street analyst estimates by 12%. PBF’s 1Q16 adjusted EPS was -$0.65, as compared to the estimated -$0.47.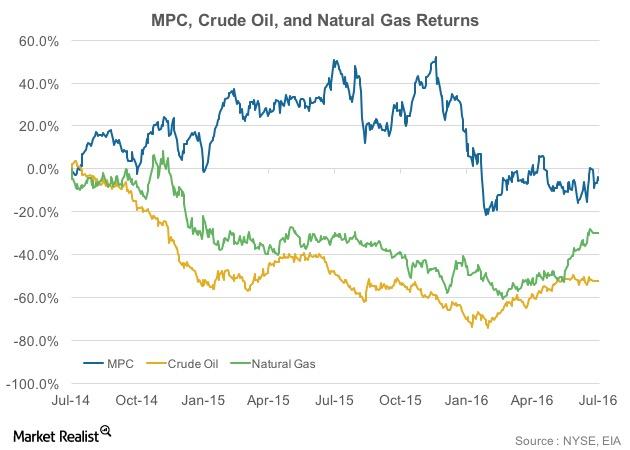
How Has Marathon Petroleum Stock Performed Pre-Earnings?
Between July 2014 and November 2015, Marathon Petroleum (MPC) stock rose 51%. But after that, the stock fell until early 2016.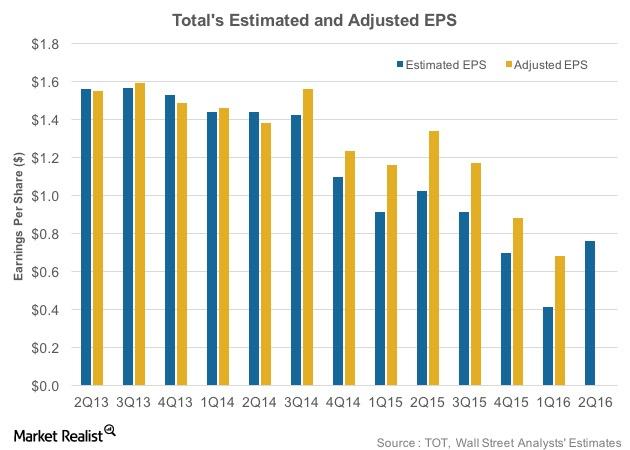
Total’s 2Q16 Earnings Outlook: Will It Beat Estimates?
Total SA (TOT) is expected to post its 2Q16 results on July 28, 2016. In 1Q16, TOT’s revenues of $27.5 billion surpassed Wall Street estimates.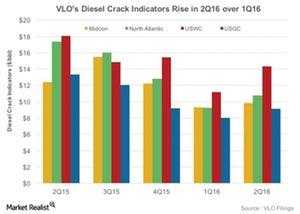
What Can We Expect from Valero’s Diesel Crack Indicators in 2Q16?
Valero’s diesel crack indicators have been rising in 2Q16 compared to 1Q16. The US West Coast, where VLO has 0.3 MMbpd refining capacity, saw the largest rise of $3.20 per barrel.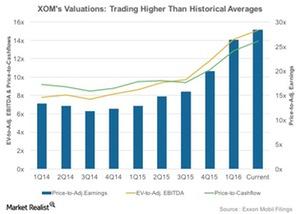
Why ExxonMobil’s Valuations Are Higher Than Historical Averages
ExxonMobil’s price-to-earnings (or PE) ratio has generally shown an uptrend in the past two years. In 1Q16, the stock traded at a PE of 26.4x.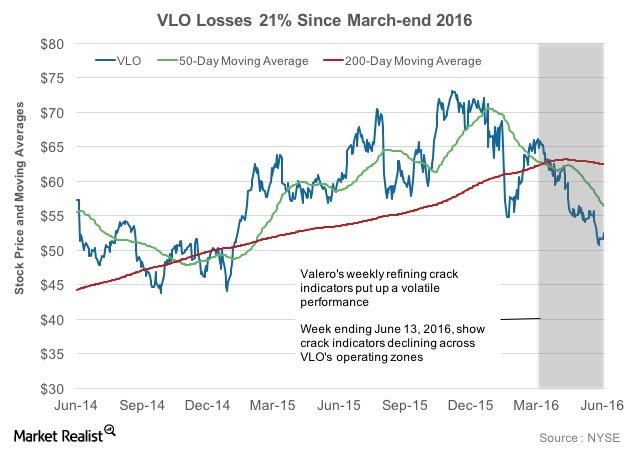
Why Has Valero Stock Fallen 21% since the End of March?
Amid stock price volatility, Valero rose 20% from February 8–March 28, 2016, and crossed over its 50-day and 200-day moving averages.