SSgA SPDR Gold Shares
Latest SSgA SPDR Gold Shares News and Updates
How Global Indicators Are Affecting Precious Metals
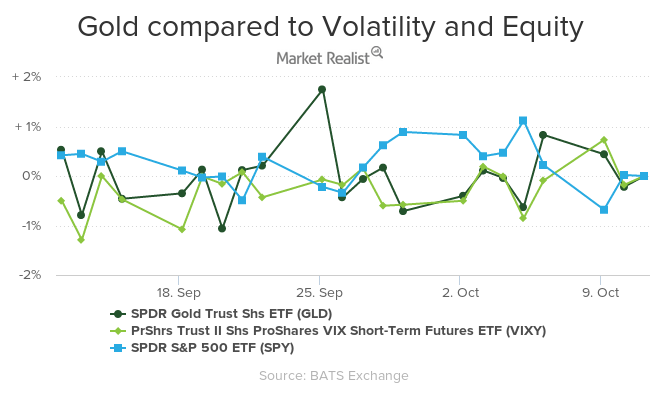
Gold reached its two-week high price of $1,294.5 an ounce on Tuesday, October 10, and ended the day at $1292.1 per ounce.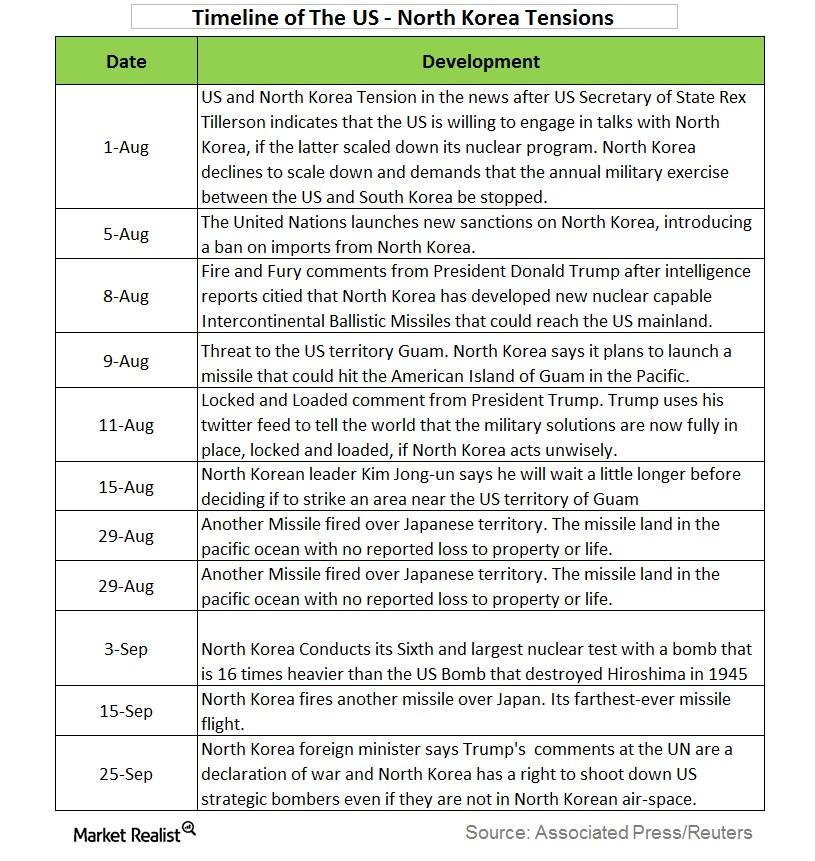
Effects of the North Korea–US Tension on Investors
Rising North Korea tensions In the last two months, tensions between the United and North Korea have continued to escalate, with both sides refusing to back down. North Korea has initiated a series of missile and nuclear tests, worsening tension in the region, and the US president has responded to these tests with strong warnings. […]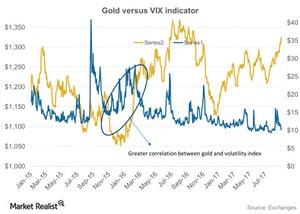
How North Korea Has Affected the Precious Metal Market
Precious metals have been buoyed by tension in North Korea. If North Korea does another missile test, it could prompt investors to move to haven assets such as gold, silver, Treasuries, and major currencies.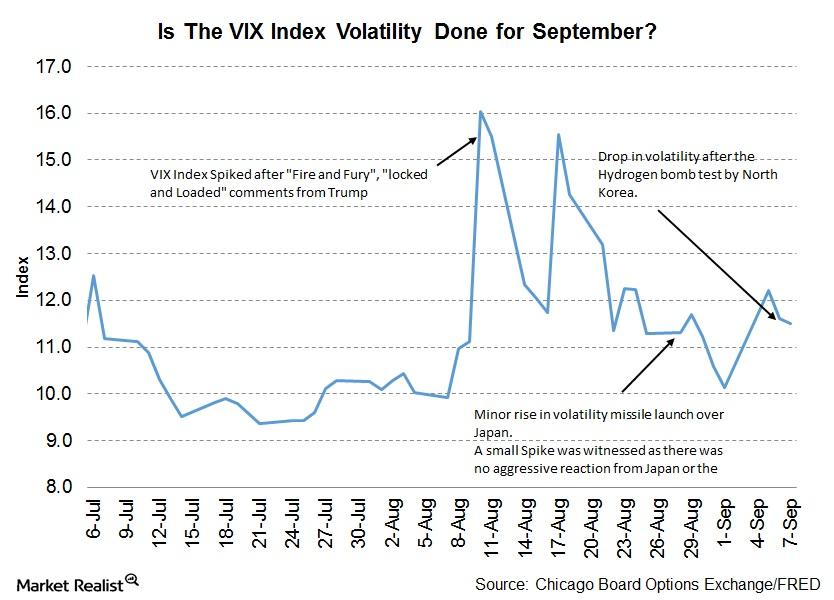
More Temporary Relief from North Korea Tensions?
This week volatility (VXX) has continued to stick to its trend of sudden spikes and then dropping immediately.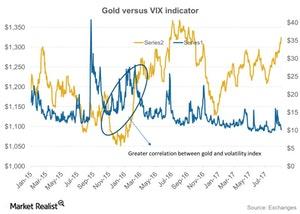
How Gold Is Coping amid Market Turmoil
Precious metals have maintained upward movement over the past month as geopolitical tensions hover.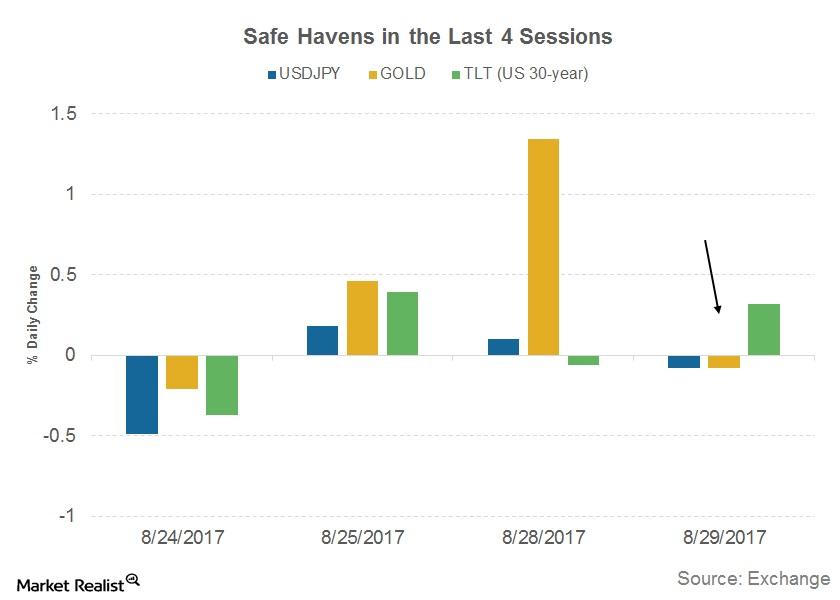
North Korea Tensions: Will Demand for Safe Havens Rise?
In the financial markets, there are a few financial assets whose demand increases dramatically in times of uncertainty.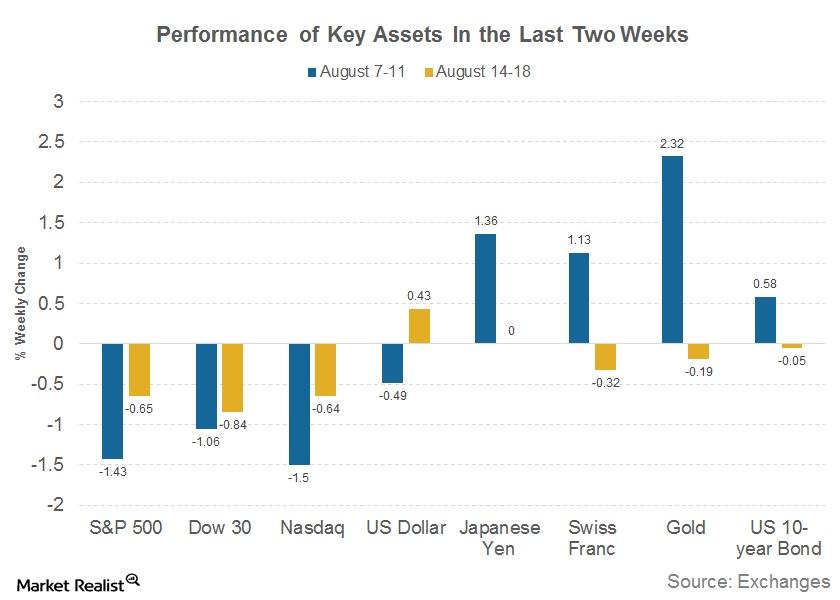
Washington or Wyoming: What Will Drive Markets This Week?
The last two weeks have been eventful for financial markets (SPY).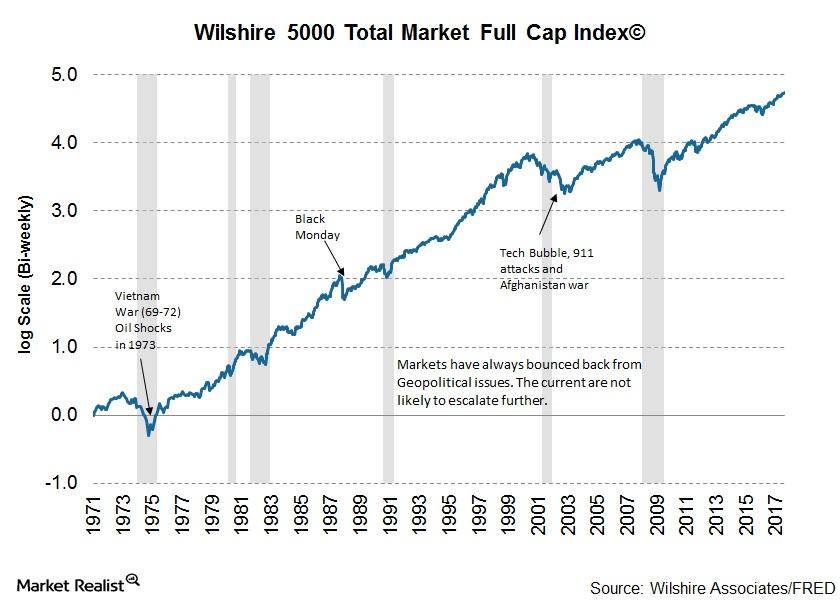
Do Financial Markets Have Another Tense Week Ahead?
Equity markets in the US and across the globe reported heavy losses as risk aversion set in.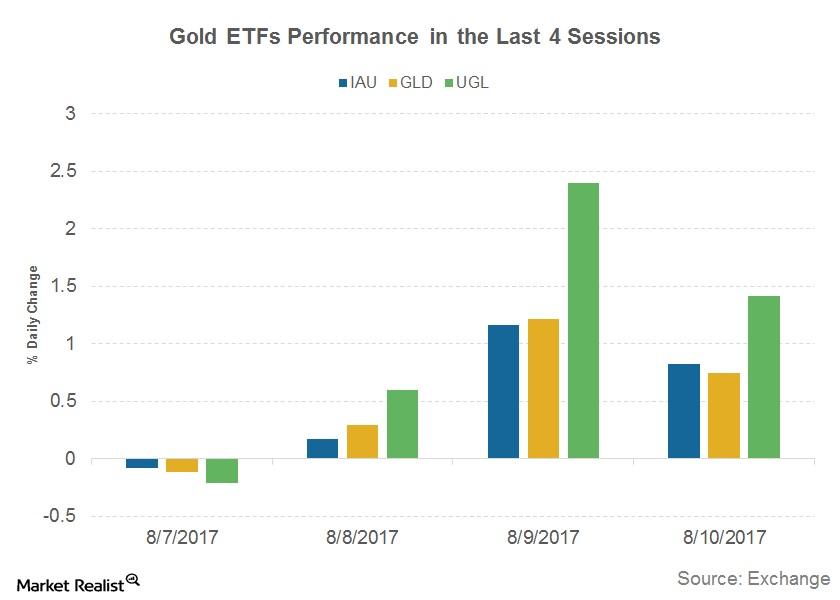
How Are Safe Havens Faring in This North Korea Fear?
The safe havens that benefit the most in times of uncertainty include gold (GLD) and U.S. Treasuries (GOVT).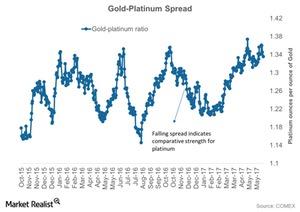
Gold-Platinum Ratio: Is Platinum a Long-Term ‘Buy’?
When reading the platinum market, it’s important to analyze the comparative performance of platinum and gold by using the gold-platinum ratio or spread.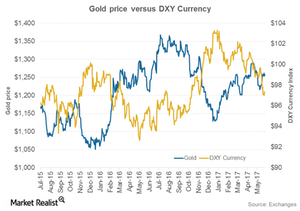
What’s the Correlation between the Dollar and Gold?
The rise in gold on June 6 also boosted the other three precious metals. Silver futures for August delivery were 1.4% higher for the day and closed at $17.6 per ounce.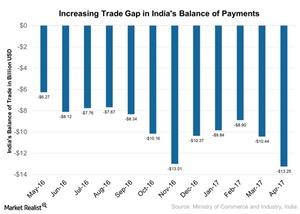
A Look at India’s Trade Gap and Its Economic Impact
India’s trade gap increased 173.5% on a year-over-year basis to ~$13.3 billion in April 2017, beating the market’s expectations of an ~$12.8 billion gap.
Gold and Other Precious Metals Fell on May 18
Gold futures for June expiration fell 0.47% and ended May 18 at $1,252.8 per ounce. The call implied volatility in gold rose to 11.3%.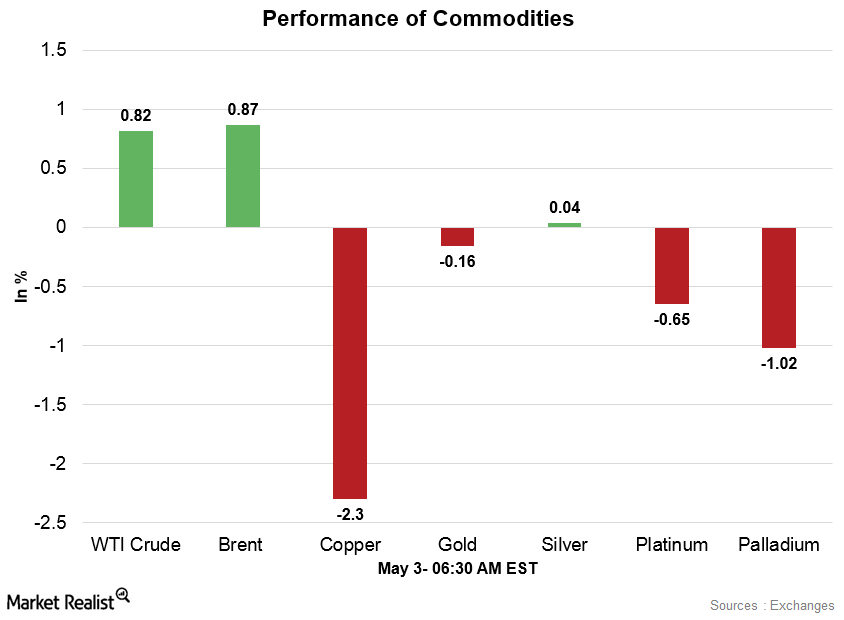
Crude Oil Is Stable amid Lower Inventory Levels
After falling to five-week low price levels on May 2, crude oil prices are stable in the early hours on May 3. The market opened higher on Wednesday.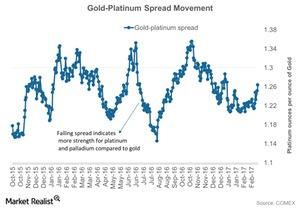
Platinum Is the Worst Performer So Far—Reading Its Spread
The gold-platinum spread was ~1.3 on April 26, 2017. The gold-platinum spread RSI on that day was 59.
Reading the Performances of Precious Metals in 1Q17
Precious metals had a bright first quarter, which ended March 31, 2017. Gold rose about 8.4%, marking its best quarter in almost a year.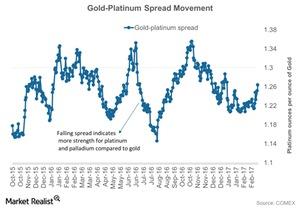
Where’s the Platinum Spread Headed in 2017?
Among the four precious metals, platinum has been the worst-performing precious metal and has seen a year-to-date rise of only 5.8%.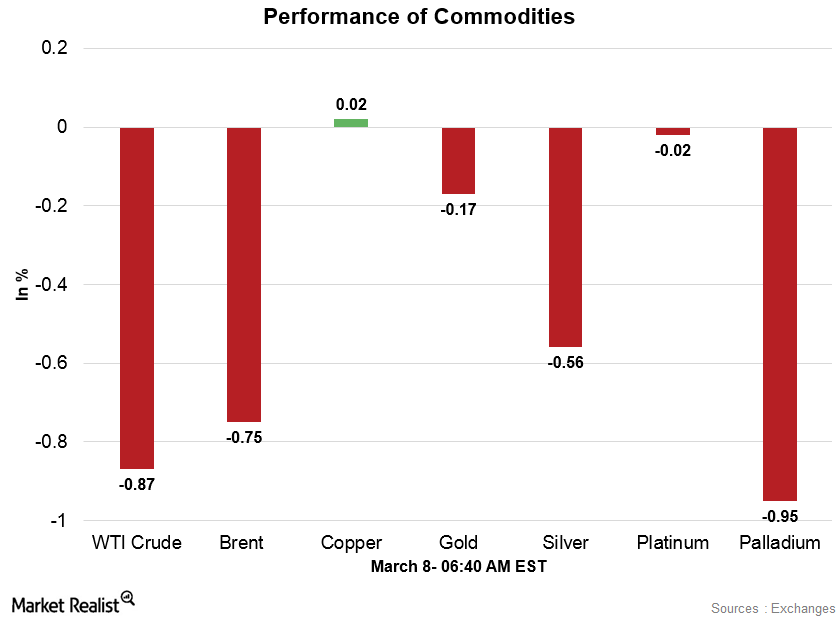
Commodities Are Weaker amid the Firmer Dollar
Gold (GLD) and silver (SLW) are weaker in the early hours due to the firmer dollar and expectations of a US interest rate hike in the Fed’s March meeting.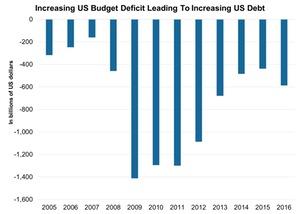
How Big Is the US Debt Compared to Other Nations?
Japan leads the nations with its rising debt-to-GDP ratio. The United States is in seventh place.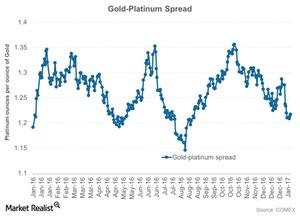
Where the Gold-Platinum Spread Is Headed
Platinum is known for its use in jewelry and as an autocatalyst for diesel-based automobile engines. The demand has been very fragile over the past few years.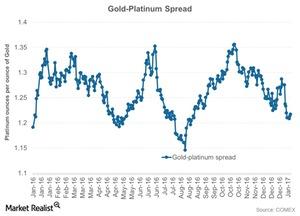
How the Gold-Platinum Spread Could Move More
The demand for platinum has been very fragile over the past few years, affected by the reduced market forecast for sales of diesel-based vehicles.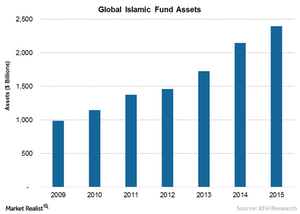
Will the Shari’ah Standard on Gold Be a Game-Changer?
In December, the AAOIFI and the WGC (World Gold Council) issued, for the first time, Shari’ah standard to deal with the use of gold (GDX) (GDXJ) as an investment in the Islamic finance industry.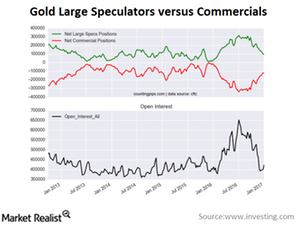
Reading Speculators’and Hedgers’ Positions in Gold
Large speculators and traders continued to reduce their bullish net positions in gold futures markets last week for the eighth consecutive week.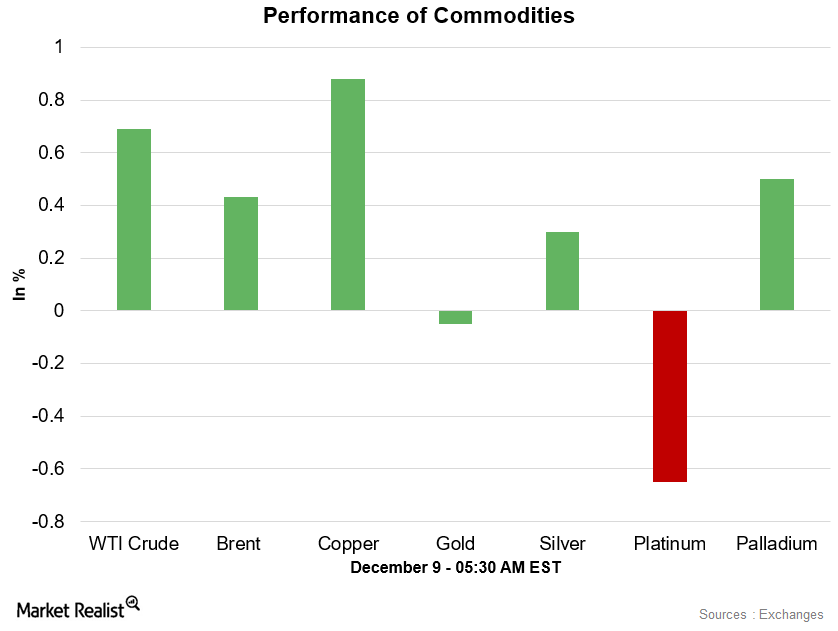
Crude Oil and Copper Are Stable, Gold Is Weaker on December 9
At 5:00 AM EST on December 9, the WTI crude oil futures contract for January 2017 delivery was trading at $51.21 per barrel—a rise of ~0.71%.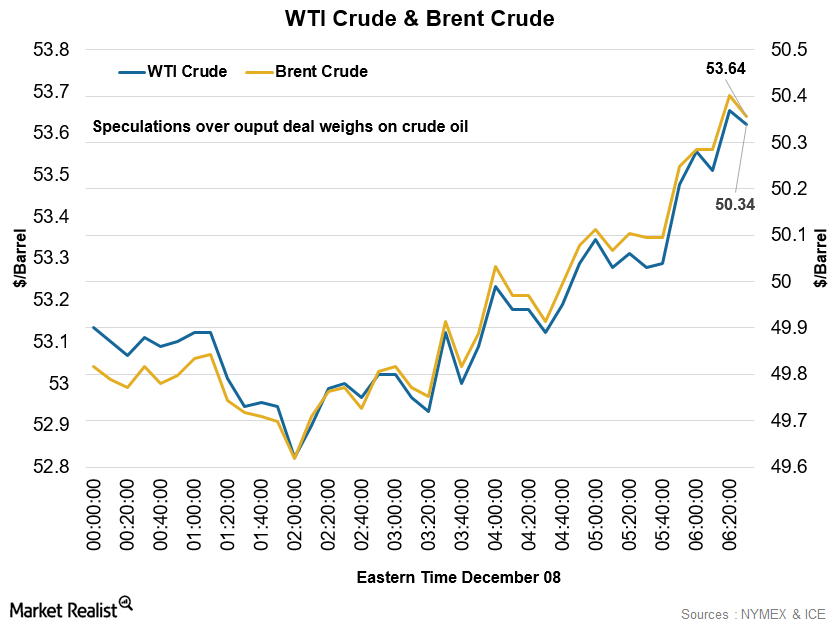
China’s Trade Data and the Weaker Dollar Support Commodities
Copper prices are stable in the early hours on December 8. China’s upbeat trade balance data are supporting the sentiment in the copper market.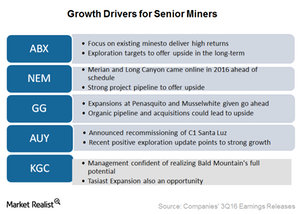
Which Gold Miners Offer Long-Term Production Growth?
Barrick Gold (ABX) slightly increased its 2016 production guidance to ~5.3 million to ~5.6 million ounces.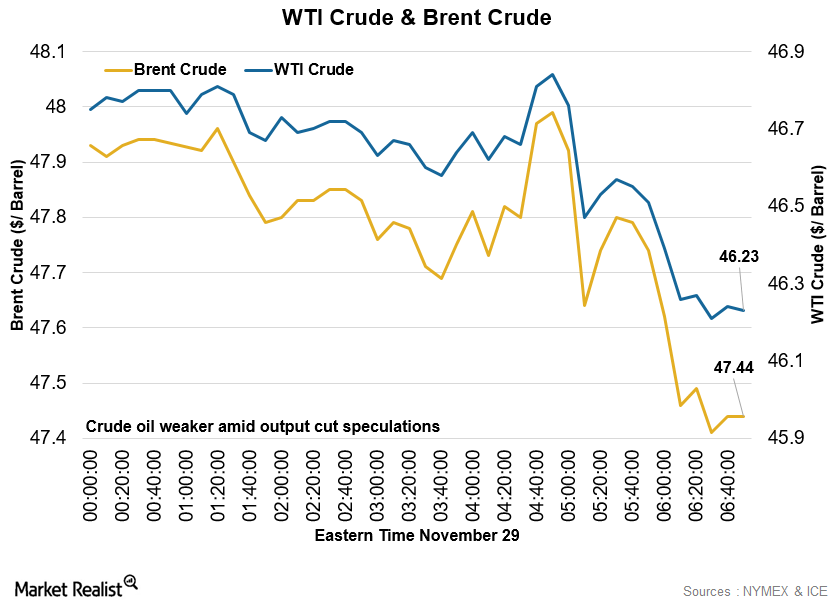
Early Morning Update: Crude Oil Fell, Metals Were Mixed
Crude oil prices are weaker early on November 29 amid speculations about the supply cuts. Russia confirmed that it wouldn’t attend OPEC’s meeting.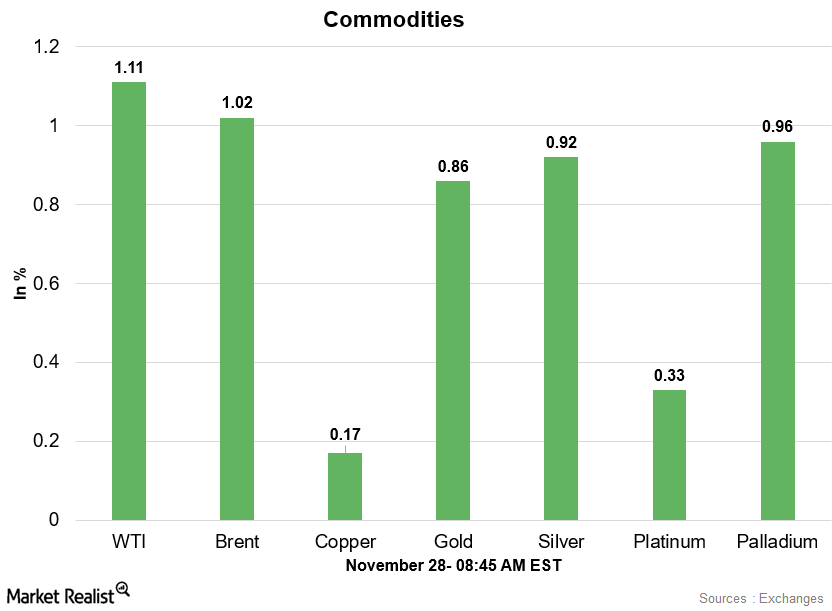
Early Morning Update: Energy, Metals, and Mining Sector
The market is also waiting for the weekly crude oil inventory reports from the U.S. Energy Information Administration and the American Petroleum Institute.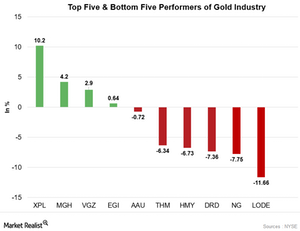
Companies in the Metals and Mining Sector Were Mixed
On November 7, the stocks related to base metals rose and precious metal miners weakened. DBB and XME rose 1.3% and 1.8%. GLD fell ~1.8%.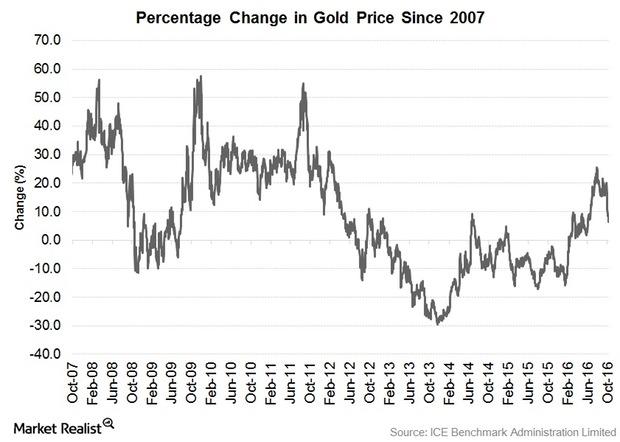
Gold and Gold Miners: Analyzing Recent Performance
Gold bullion ended September at $1,315.75 per ounce for a 0.5% gain while gold stocks experienced more positive returns. The NYSE Arca Gold Miners Index[1. NYSE Arca Gold Miners Index (GDMNTR) is a modified market capitalization-weighted index comprised of publicly traded companies involved primarily in the mining for gold] (GDMNTR) posted a 3.8% gain, while […]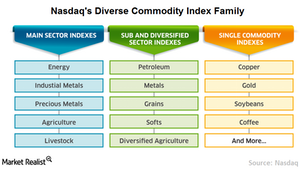
Nasdaq Commodity Index: Reflecting the Global Commodity Market
On the commodities side, we have broad-based commodity benchmark, the Nasdaq Commodity Index, aptly named.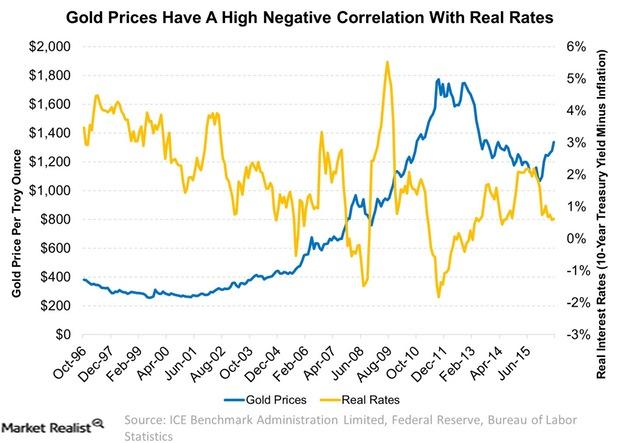
How the Fed’s Shifting Stance on Rates Affects Gold
The Fed’s Shifting Stance on Rates The summer doldrums came late this year for gold and gold stocks. Now that the U.K. Brexit decision is old news, the markets are again obsessed with the Federal Reserve’s (the “Fed”) shifting stance on rate decisions. Although the Fed’s tone had been dovish on rate increases following the […]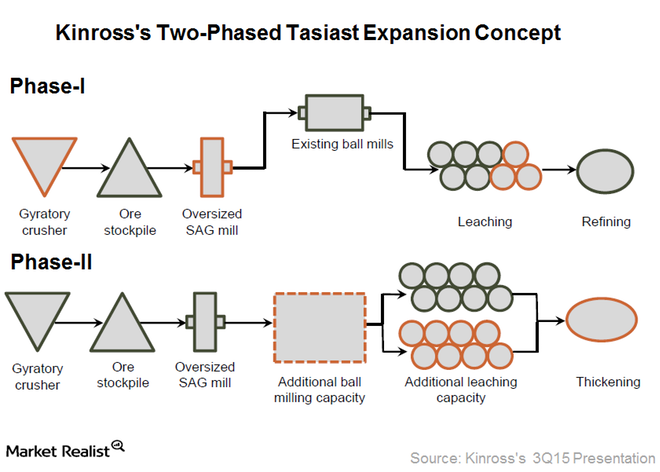
What Tasiast Mine Being Back in Full Swing Means for Kinross Gold
Kinross Gold (KGC) announced in June 2016 that it was temporarily halting its mining and processing activities at the Tasiast mine in Mauritania.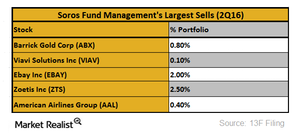
Why Did Soros Fund Management Reduce Its Holdings in Barrick Gold?
Billionaire investor George Soros, who said in April 2016 that gold was the only asset that could outperform in the current market environment, is now getting out of gold.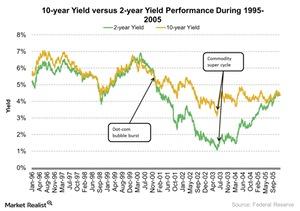
How Might Yields React to a Dot-Com Bubble Situation?
During the 1999–2002 dot-com bubble crisis, the US 2-Year Treasury yield fell by 74%. It made a high of 6.9% in May 2000 and a low of 1.8% in September 2002.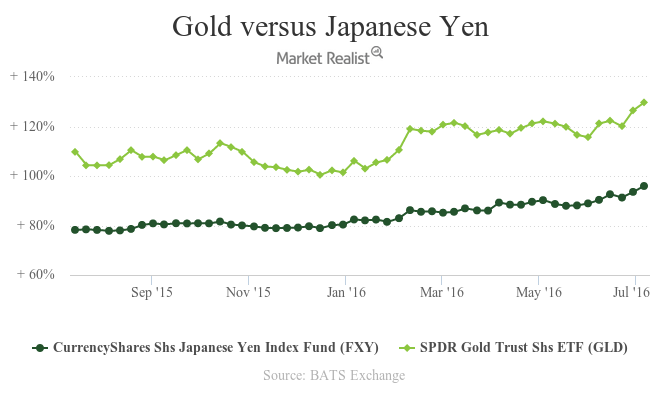
How Did the Japanese Yen Correlate with Gold?
The falling equity market took down the Japanese stock markets too.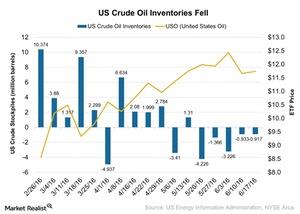
What Caused US Crude Oil Inventories to Fall Marginally?
According to the EIA’s report on June 22, 2016, US crude oil inventories fell by 0.92 MMbbls (million barrels) for the week ending June 17, 2016.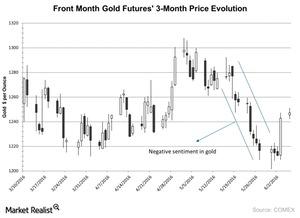
Why Hedge Funds Liquidated Some of Their Gold
Hedge funds increased their bets on gold as prices fell after gold’s gains in 1Q16. However, hedge funds and money managers curbed their bets on gold as it fell steadily in May.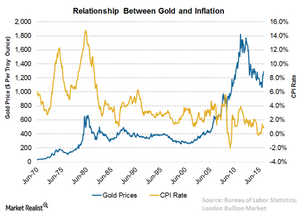
How Inflation Expectations Affect Gold Prices
In the 1990s and 2000s, when gold prices tracked inflation, although the correlation seems to be a bit weak compared to the 1970s and 1980s.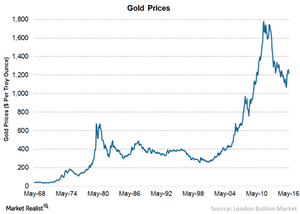
Why Predicting Gold Returns Is a Dubious Exercise
Generally, gold is viewed as a hedge against rapid inflation and lower interest rates. That makes it hard to value gold as there are no cash flows or earnings associated with it.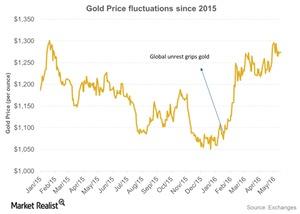
Why Is JPMorgan Chase Positive on Gold?
After seeing three straight years of losses, gold (GLD) performed extremely well at the beginning of 2016.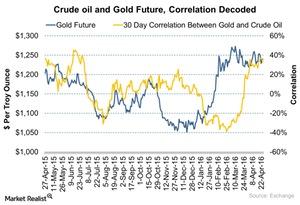
Gold and Crude Oil: How Does the Correlation Work?
Gold (GLD) can be considered an indicator of economic fear and inflation expectations. Driven by these fears, gold gains during equity market turmoil.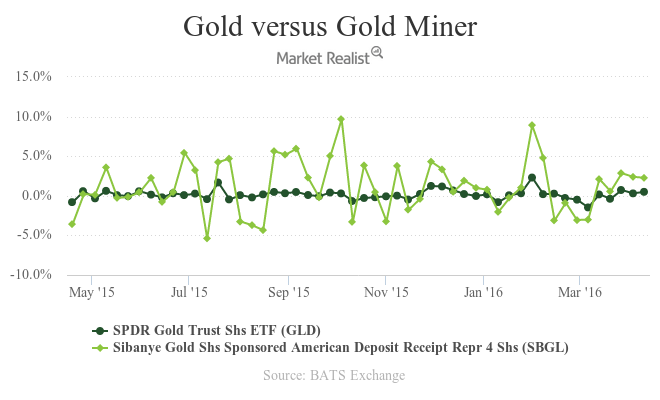
What’s Next for Gold Investors?
Gold gave steady returns to investors for the first two months of 2016 as unrest and instability continued in the markets. However, March started with some ups as well as downs for gold.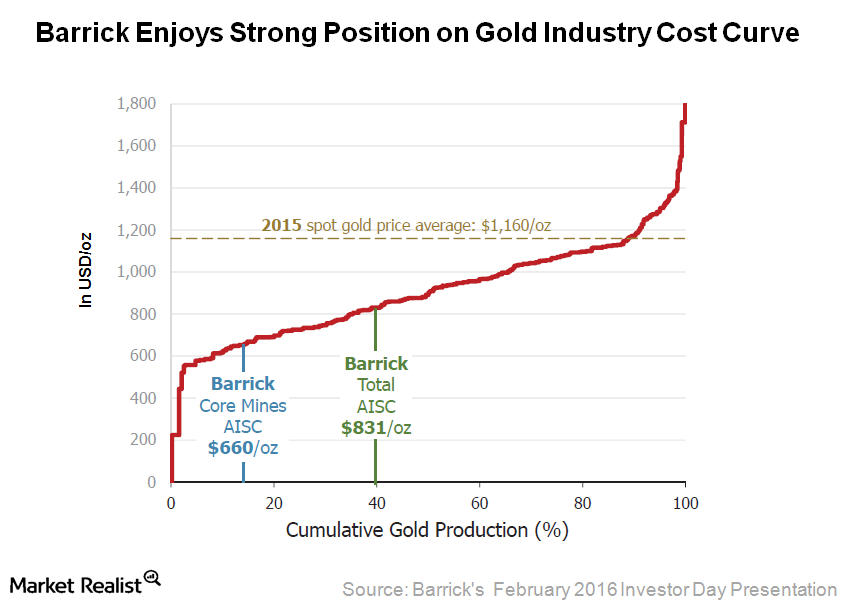
Barrick’s Focus on Costs Places It Favorably on Gold’s Cost Curve
Barrick Gold achieved all-in sustaining costs of $831 per ounce for 2015. This AISC was below the 40th percentile of the global industry cost curve.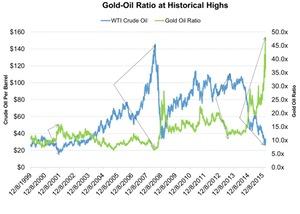
Gold-Oil Ratio Is at a Historic High: Why Isn’t the Bottom Near?
A rise in the ratio can be correlated the corresponding rise in gold prices. An increase in the ratio indicates that gold is more expensive than crude oil.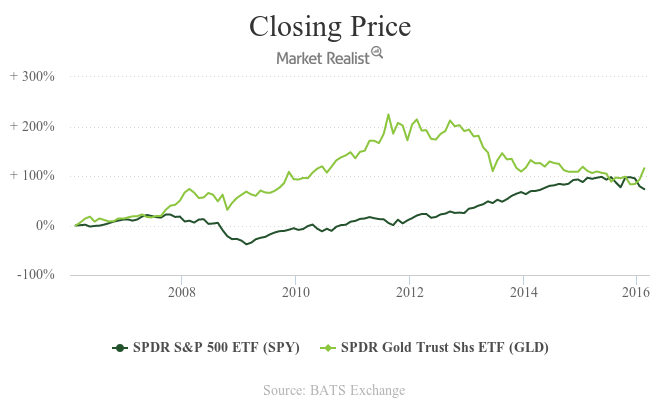
How Gold Correlates with the S&P 500 Index
Since July 2011, the S&P 500 Index has gained about 62% and touched its high of 2130 in July 2015. During the same period, gold (GLD) has lost about 92%.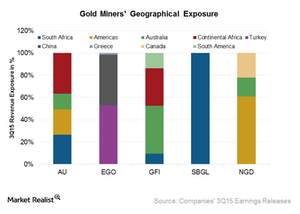
Gold Miners’ Geographic Exposure Impacts Growth Prospects
While gold miners try to limit their exposure to safe jurisdictions, it’s important to look at geographic exposure and its implications on their prospects.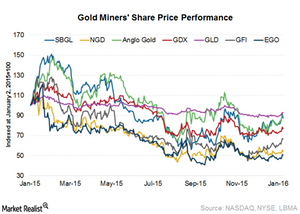
Intermediate Gold Miners Fell in 2015 and Beyond
From the start of 2015 to January 8, 2016, the prices of gold (GLD) have fallen by 7% and the VanEck Vectors Gold Miners Index (GDX) has fallen by 23%.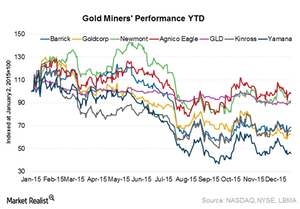
Why Have Newmont and Agnico Outperformed?
In this series, we’ll look at various factors that are affecting gold miners like Barrick Gold, Newmont Mining, Goldcorp, Yamana Gold, Agnico Eagle Mines, and Kinross Gold.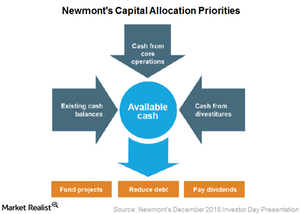
How Will Newmont’s Capital Allocation Priorities Look Like?
Newmont Mining outlined its capital allocation priorities. Management mentioned that they aim to fund their projects through cash generated from core operations.
