United States 12 Month Oil ETF
Latest United States 12 Month Oil ETF News and Updates

Oil ETFs: How They’re Performing at Oil’s 3-Year High
Between January 5 and January 12, 2018, the United States Oil ETF (USO), which holds positions in US crude oil active futures, gained 4.5%.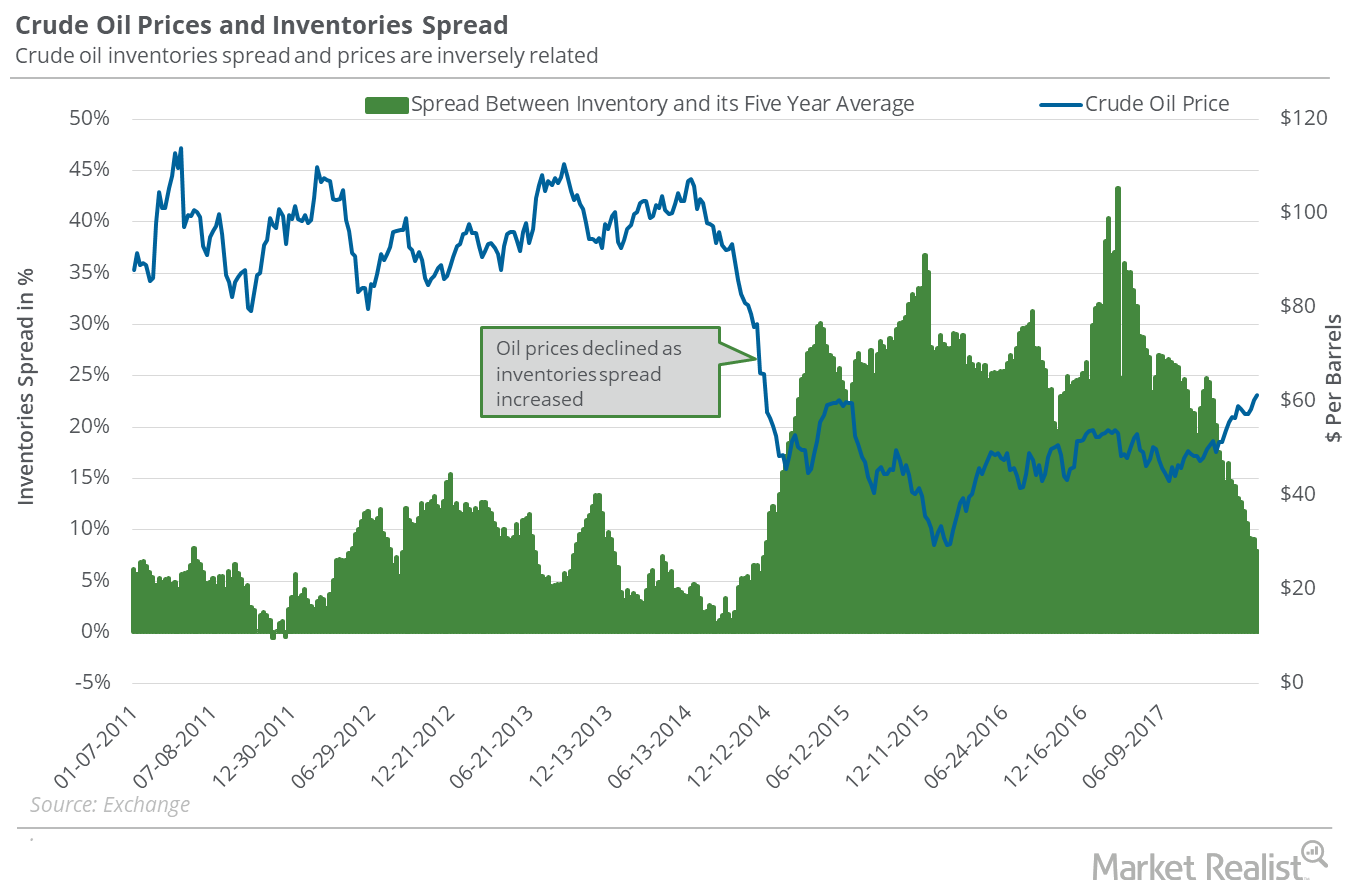
Oil Inventory Data Could Push Oil Higher
In the week ending January 5, 2018, US crude oil inventories fell by 4.9 MMbbls (million barrels)—1 MMbbls more than the market’s expected fall.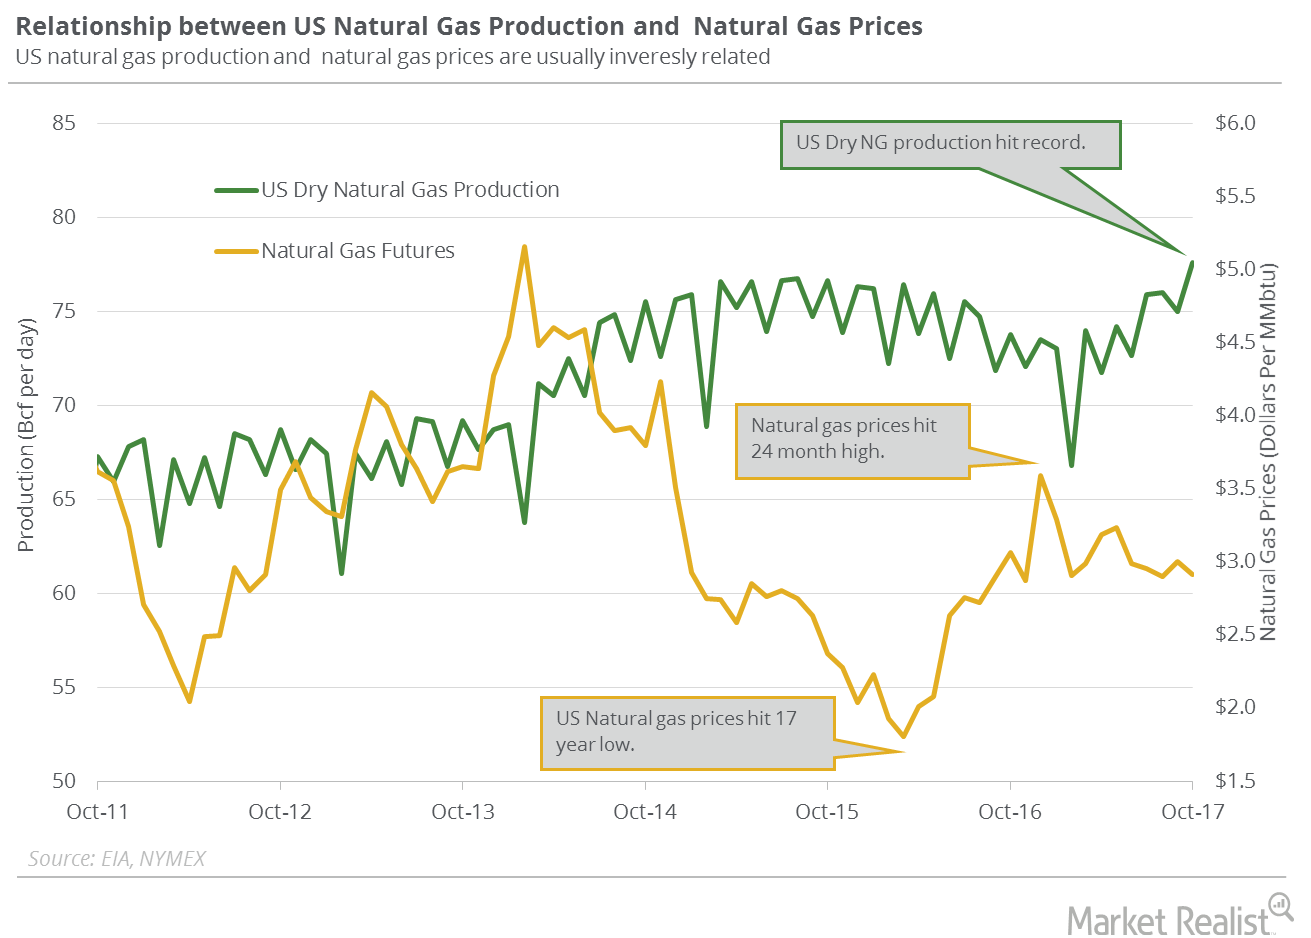
Will US Natural Gas Production Hit a Record in 2018 and 2019?
US dry natural gas production rose by 1.2 Bcf (billion cubic feet) per day or 1.6% to 74 Bcf per day on January 4–10, 2018, according to PointLogic.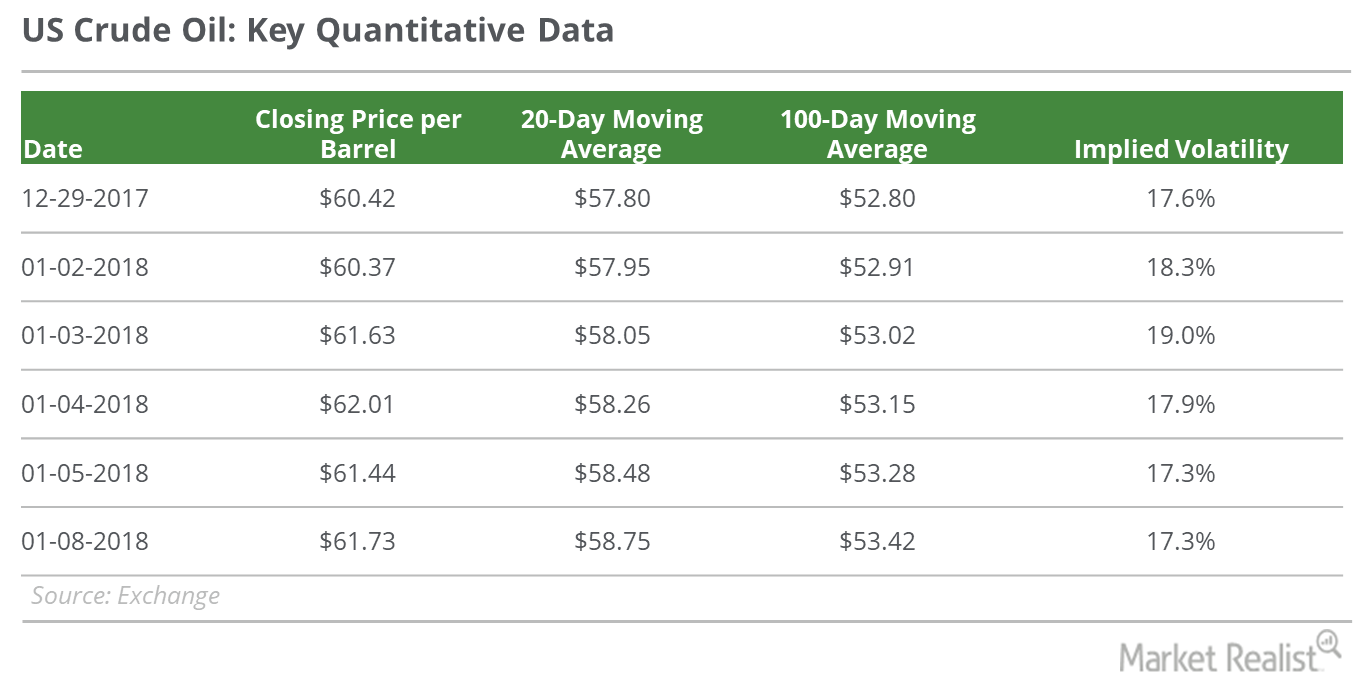
Will US Crude Oil Prices Make a New 3-Year High?
On January 8, 2018, US crude oil (USO) (USL) February 2018 futures rose 0.5% and closed at $61.73 per barrel—0.5% below the three-year high.
Why Oil Reached a 3-Year High
On January 4, 2018, US crude oil (USO) (USL) February 2018 futures rose 0.6% and closed at $62.01 per barrel—a three-year high.
Which Oil ETFs Might Be a Better Bet in 2018?
On December 29, 2017, the closing prices of US crude oil futures contracts between March 2018 and January 2019 were progressively lower.
US Crude Oil Closed at 2017 High: Will the Ride Continue?
On December 22–29, US crude oil (USO) (USL) February futures rose 3.3%. On December 29, US crude oil February 2018 futures closed at $60.42 per barrel.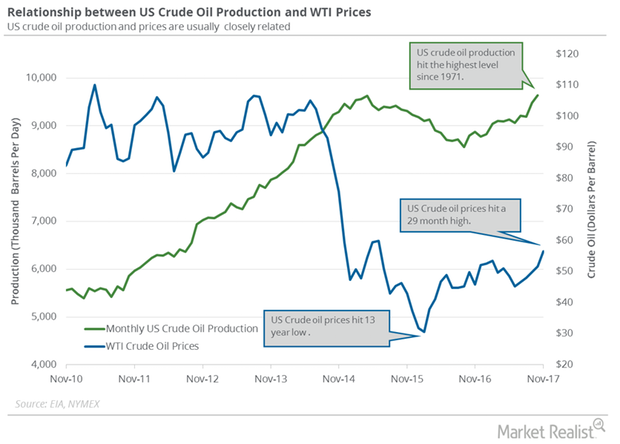
US Crude Oil Output Hit the Highest Level since May 1971
US crude output increased by 167,000 bpd to 9.64 MMbpd in October 2017—compared to the previous month. It was the highest level since May 1971.
How Much Fall in Inventories Could Support Oil This Week?
In the week ended December 22, 2017, US crude oil inventories were 431.9 MMbbls (million barrels), a fall of 4.6 MMbbls compared to the previous week.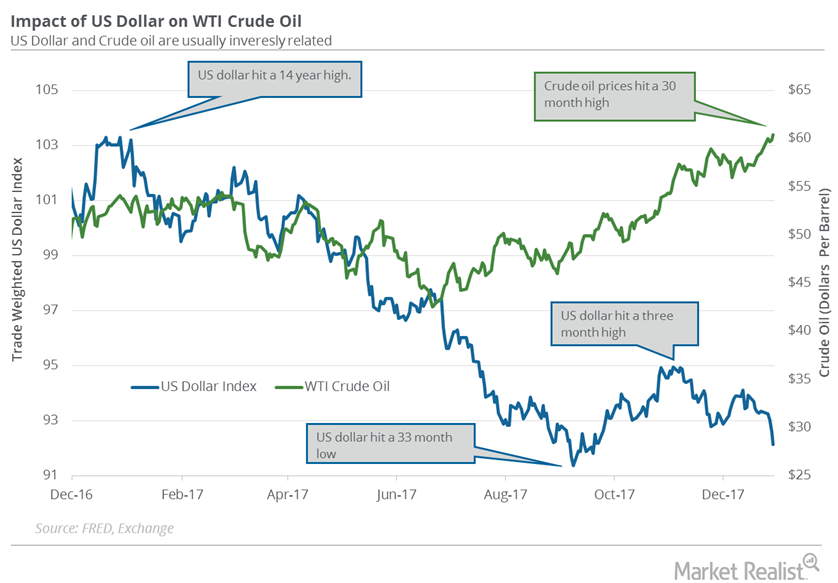
Will the US Dollar Help Crude Oil Bulls or Bears in 2018?
The US Dollar Index fell 0.5% to 92.12 on December 29, 2017—the fourth consecutive day of losses. It’s near a three-month low.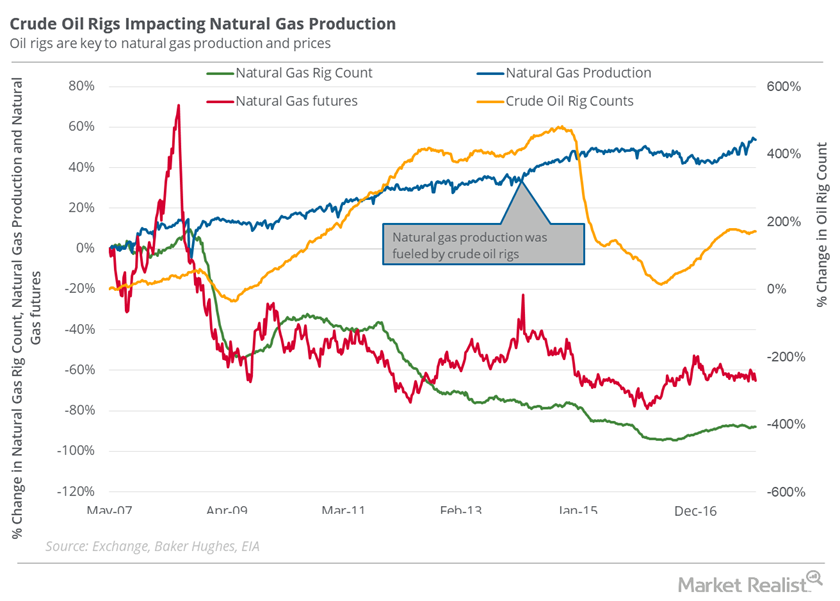
Why the Oil Rig Count Could Be a Concern for Natural Gas Bulls
In the week ended December 22, the natural gas rig count was 88.5% below its record high of 1,606 in 2008.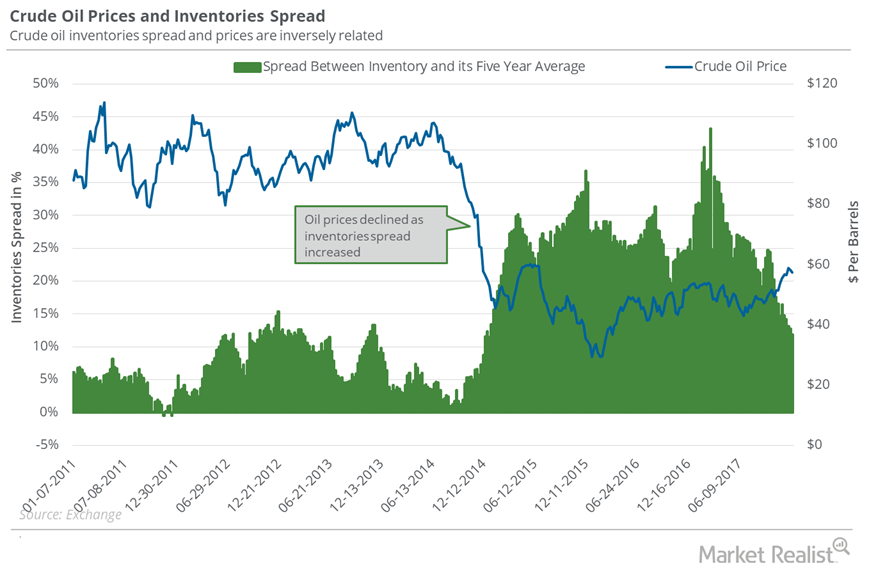
What Oil Bulls Could Expect for Oil Inventories
Oil stockpiles In the week ended December 8, 2017, US crude oil inventories fell by 5.1 MMbbls (million barrels) to 443 MMbbls. However, motor gasoline inventories rose 5.7 MMbbls. The data was released by the EIA (U.S. Energy Information Administration) on December 13. That day, US crude oil prices fell 0.9%. Inventory spread The gap between US oil inventories […]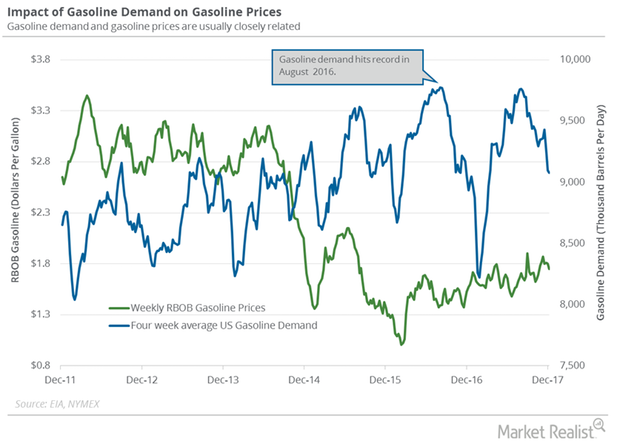
US Gasoline’s Demand Trend Is Changing
The EIA estimates that four-week average US gasoline demand fell by 21,000 bpd (barrels per day) to 9.1 MMbpd on December 1–8, 2017.
Can US Crude Oil Break Below $57 Next Week?
On December 14, 2017, the implied volatility of US crude oil futures was 18.1%. It was 14.8% below its 15-day average.
Oil ETFs That Outperformed US Crude Oil Last Week
On December 1–8, 2017, the United States Oil Fund (USO), which holds crude US oil futures contracts, fell 1.5%. US crude oil January 2018 futures fell 1.7%.
US Crude Oil Prices Could Remain below $58 Next Week
On December 7, 2017, US crude oil’s implied volatility was 20% or ~1.1% less than its 15-day average. On December 1, the implied volatility fell to 19.8%.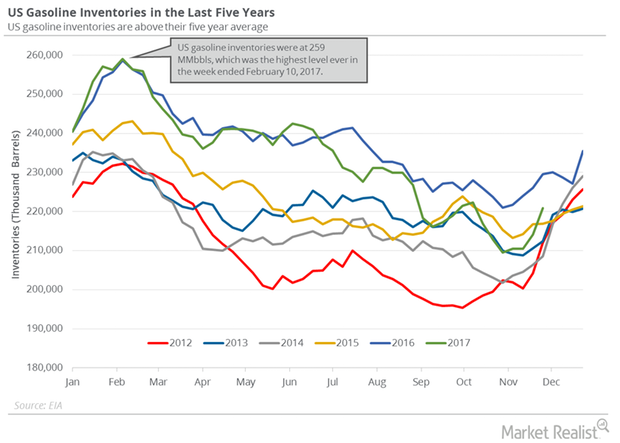
US Gasoline Inventories Add More Pain to Crude Oil Futures
According to the EIA, US gasoline inventories rose by 6,780,000 barrels to 220.8 MMbbls (million barrels) on November 24–December 1, 2017.
Analyzing Crude Oil Inventories and Oil Prices
In the week ending November 24, 2017, US crude oil inventories fell by 3.4 MMbbls (million barrels) to 453.7 MMbbls.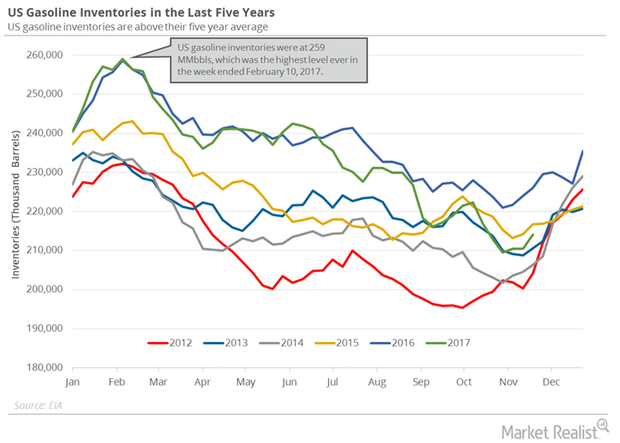
Analyzing US Gasoline Inventories and Demand
The API reported that US gasoline and distillate inventories rose by 9,200,000 barrels and 4,300,000 barrels on November 24–December 1, 2017.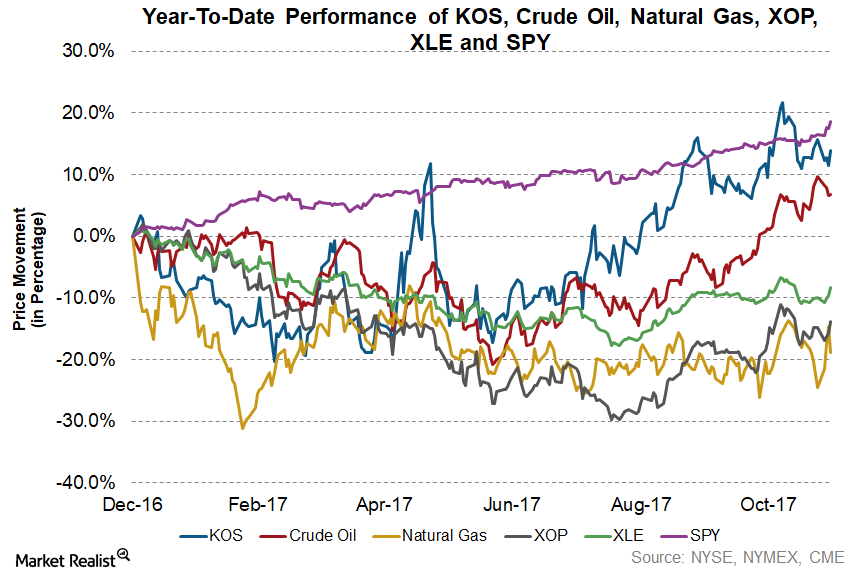
The Fourth-Best-Performing Upstream Stock Year-to-Date
In 9M17, KOS’s production increased ~107.0% to ~7.8 million barrels when compared with 9M16.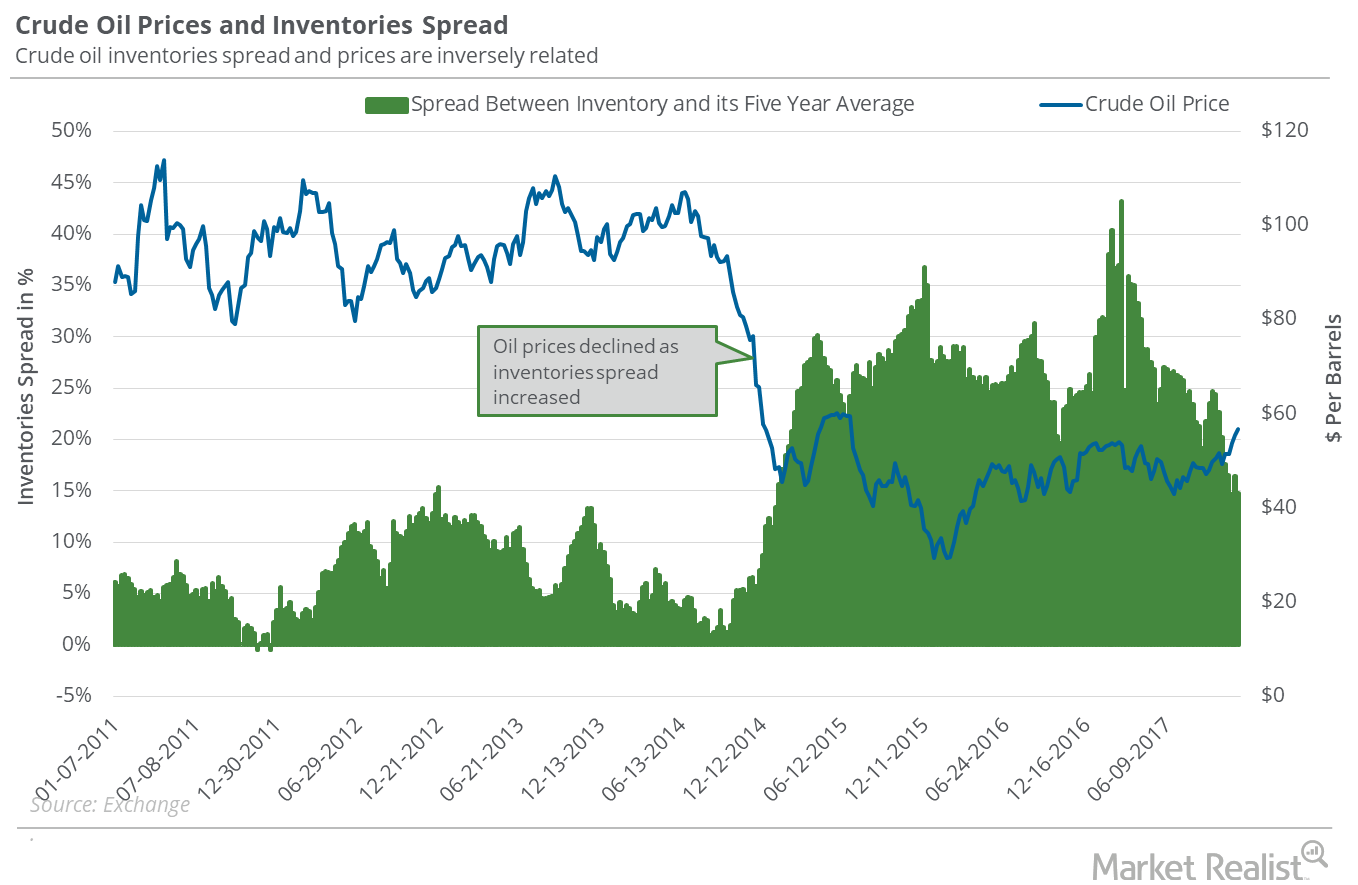
Will the Inventories Spread Impact US Crude Oil?
US commercial crude oil inventories fell by 1.9 MMbbls in the week ending November 17, 2017—0.5 MMbbls more than the market’s expected fall.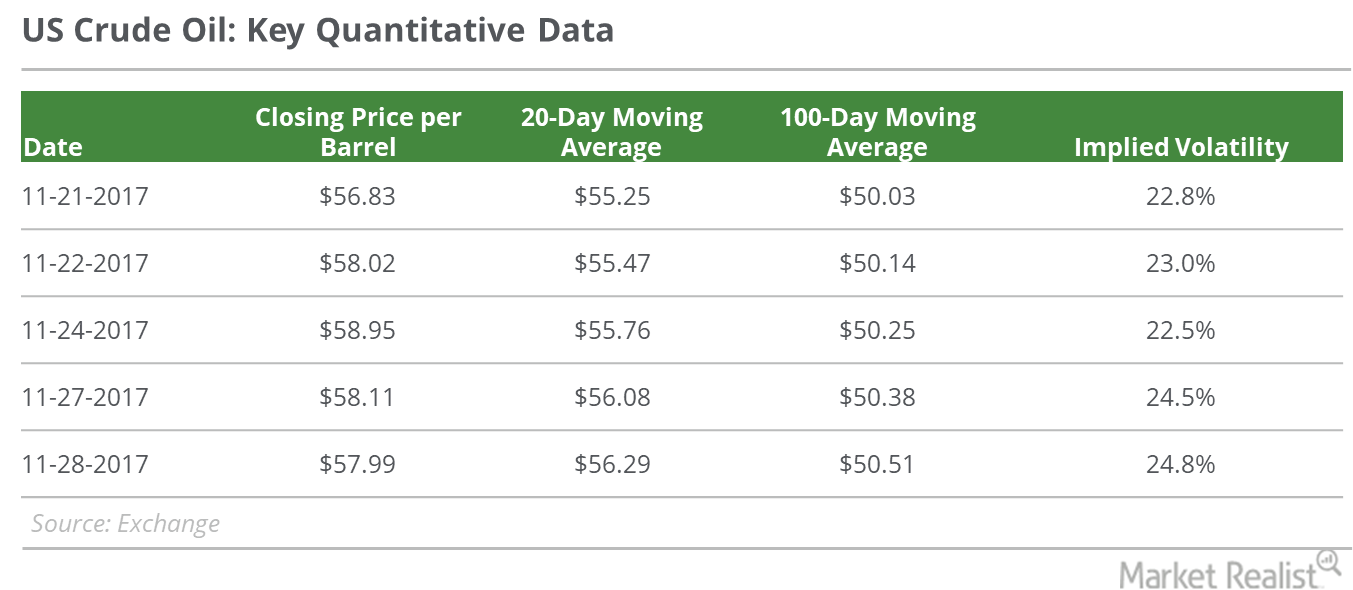
Is Oil’s Rise Coming to a Halt?
On November 28, 2017, US crude oil (USO) (USL) active futures fell 0.2% and closed at $57.99 per barrel. All eyes are on the outcome of OPEC’s meeting.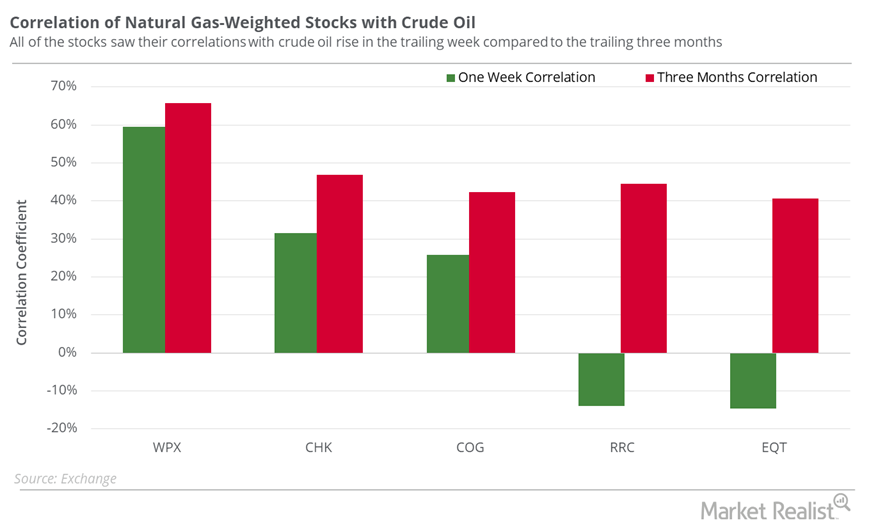
Which Natural Gas–Weighted Stocks Could Take Cues from Oil?
Antero Resources (AR) and Gulfport Energy (GPOR) are among the natural gas–weighted stocks that had the highest correlations with natural gas prices in the trailing week.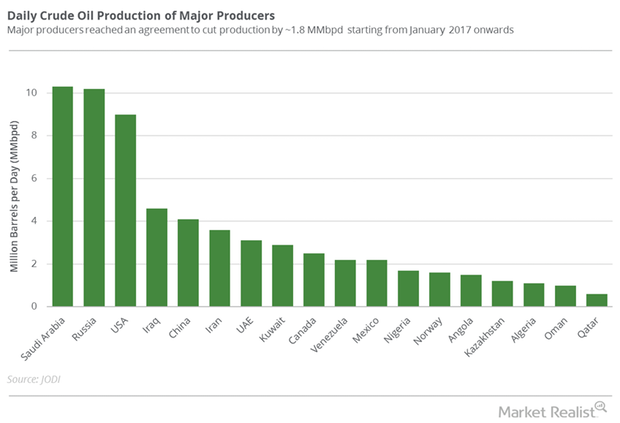
Will OPEC’s Meeting Help Crude Oil Bulls or Bears?
OPEC’s meeting will be held on November 30, 2017. Reuters said that OPEC might extend the production cuts for nine more months.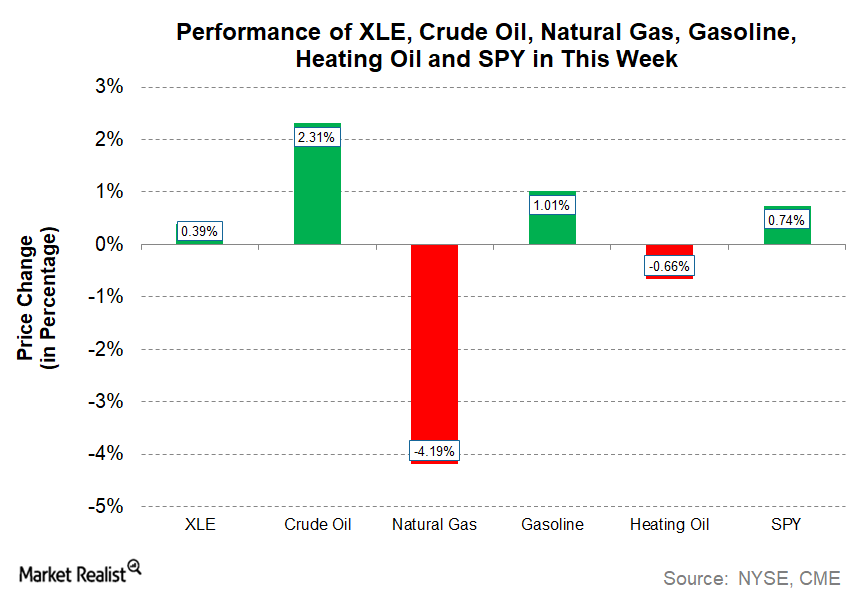
Energy Sector Saw a Mixed Performance This Week
With the mixed performance from natural gas and crude oil, the energy sector is showing a modest increase this week.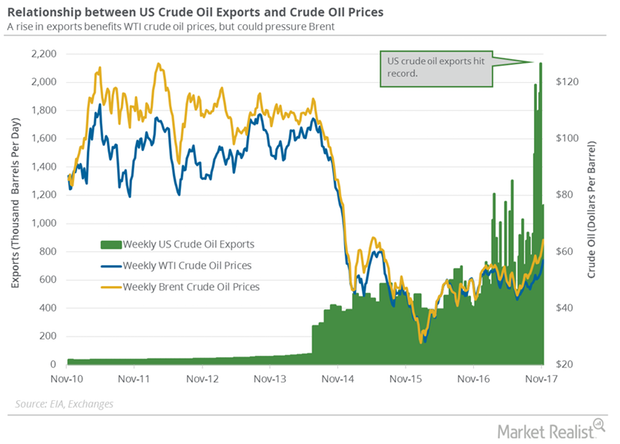
US Crude Oil Exports and Drilling Activity Impact OPEC
According to the EIA, US crude oil exports rose by 260,000 bpd to 1,129,000 bpd on November 3–10, 2017. Exports rose 30% week-over-week.
Russian and US Crude Oil Exports Are Important for Oil Bears
US crude oil exports fell by 1,264,000 bpd or 60% to 869,000 bpd on October 27–November 3, 2017. Exports rose by 459,000 bpd from the same period in 2016.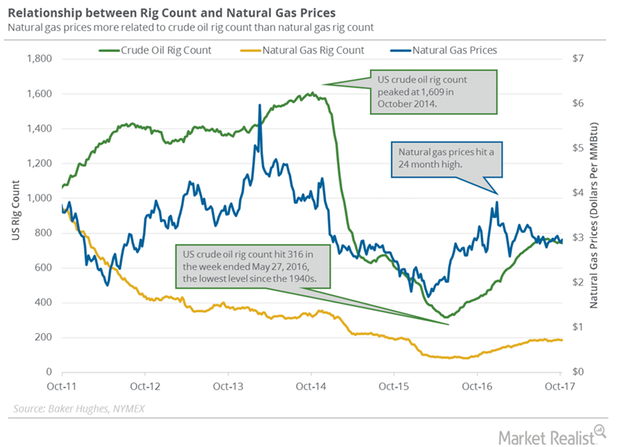
US Gas Rigs Hit 5-Month Low: Good or Bad for Natural Gas Futures?
Baker Hughes is scheduled to release its weekly US oil and gas rig report on October 27, 2017.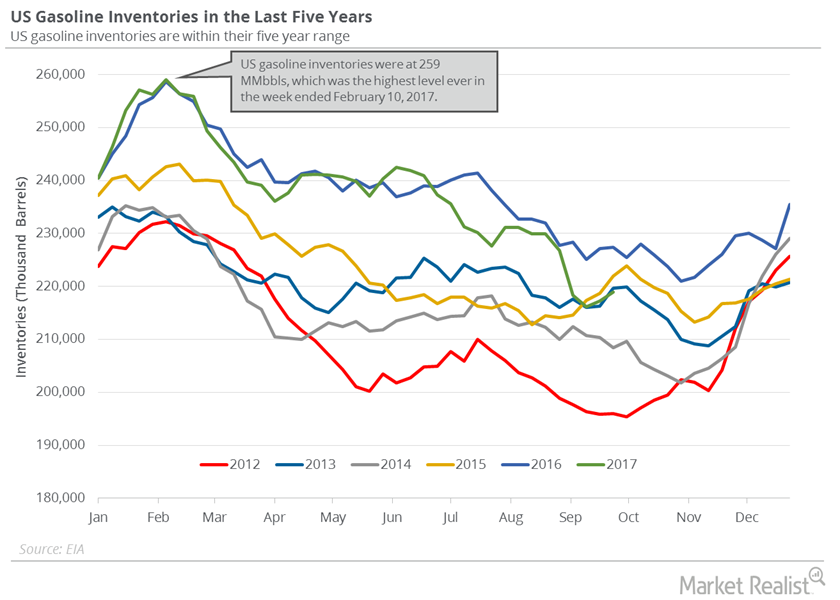
Are US Gasoline Inventories a Pain for Crude Oil Bulls?
The EIA (U.S. Energy Information Administration) estimates that US gasoline inventories rose by 1.6 MMbbls to 218.9 MMbbls on September 22–29, 2017.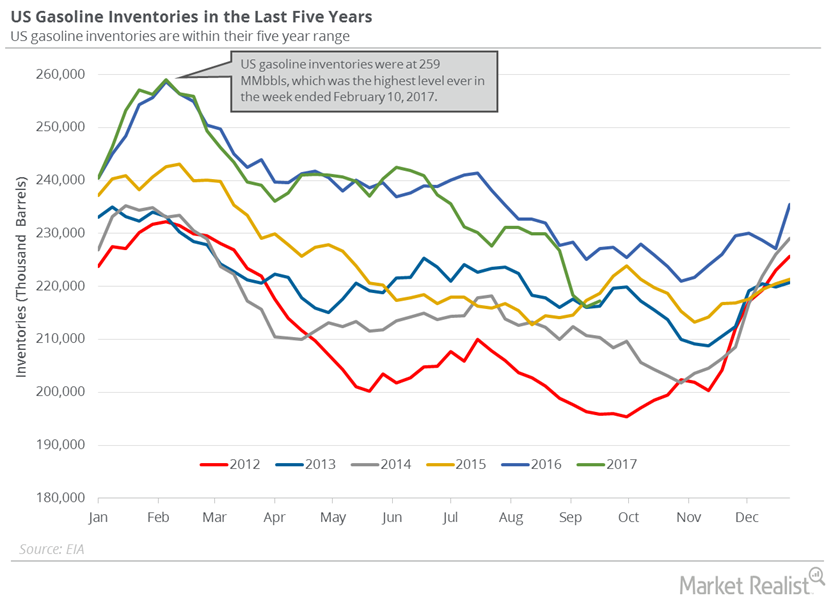
Gasoline Inventories Could Pressure Crude Oil Prices
The API estimates that US gasoline inventories rose by 4.19 MMbbls on September 22–29, 2017. The market expected a build by 1.08 MMbbls.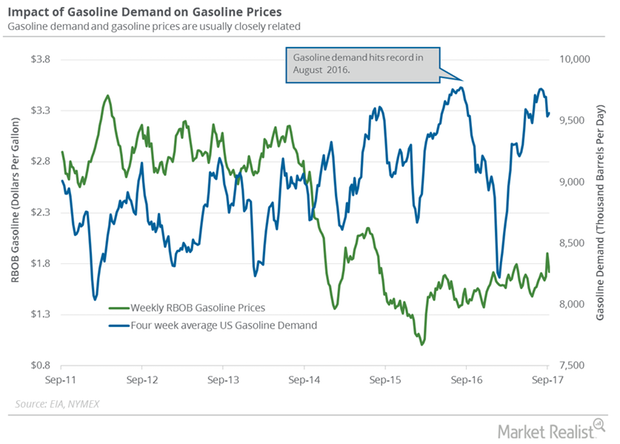
US Gasoline Demand: Are the Crude Oil Bears Taking Control?
Weekly US gasoline demand rose by 81,000 bpd to 9.5 MMbpd on September 15–22, 2017. Gasoline demand rose by 642,000 bpd or 7.2% YoY.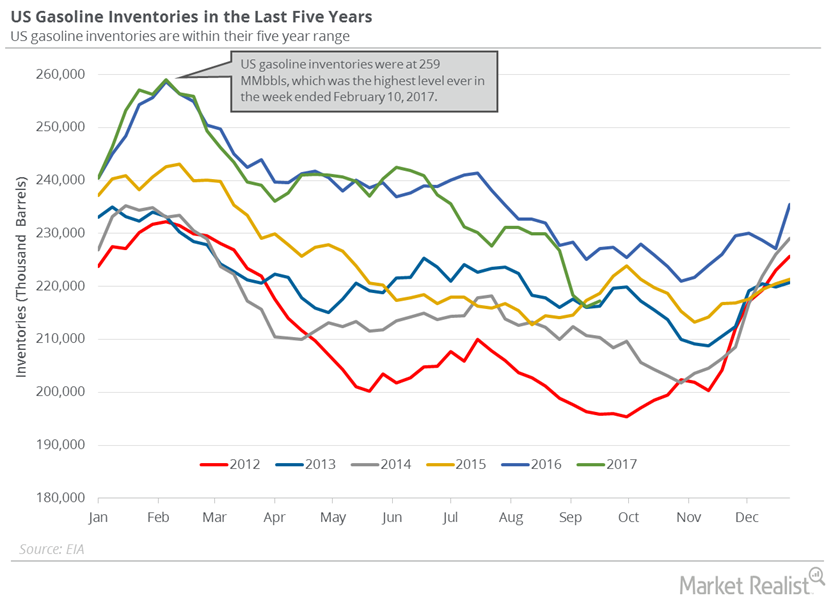
Understanding the Rising US Gasoline Inventories
The EIA estimated on September 27 that US gasoline inventories rose 1.1 MMbbls (million barrels) to 217.2 MMbbls from September 15–22, 2017.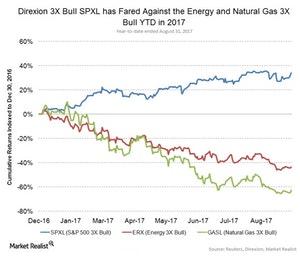
Should Energy Stocks Go in Your Back-to-School Shopping Basket?
The energy sector, as tracked by the Energy Select Sector SPDR Fund (XLE), has lost ~17.0% year-to-date as of August 31.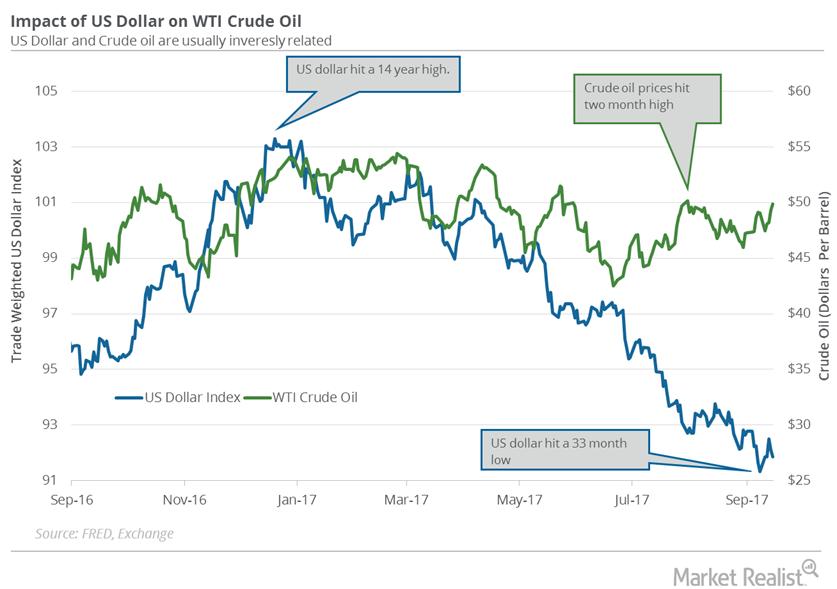
Will the FOMC Meeting Drive the US Dollar and Crude Oil Futures?
The US Dollar Index fell 0.27% to 91.86 on September 15. It’s near a 33-month low. Prices fell due to the surprise decline in US retail sales in August.
Why the US Dollar Hit a 33-Month Low
The US Dollar Index fell 0.34% to 91.33 on September 8—the lowest level in the last 33 months. Prices fell due to the following factors.…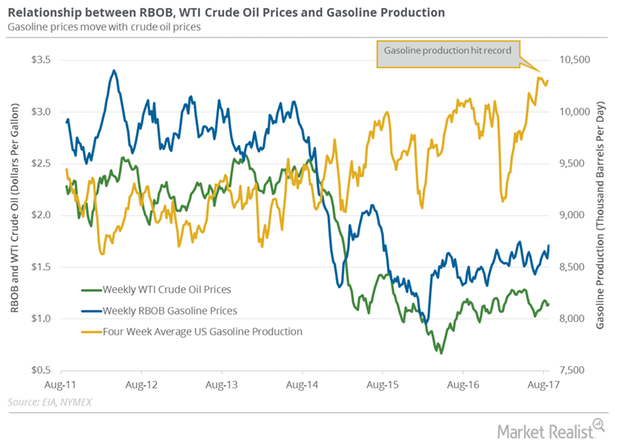
Why September Gasoline Futures Hit a 2-Year High
September gasoline futures contracts rose 4% and closed at $1.78 per gallon on August 29, 2017—the highest settlement in more than two years.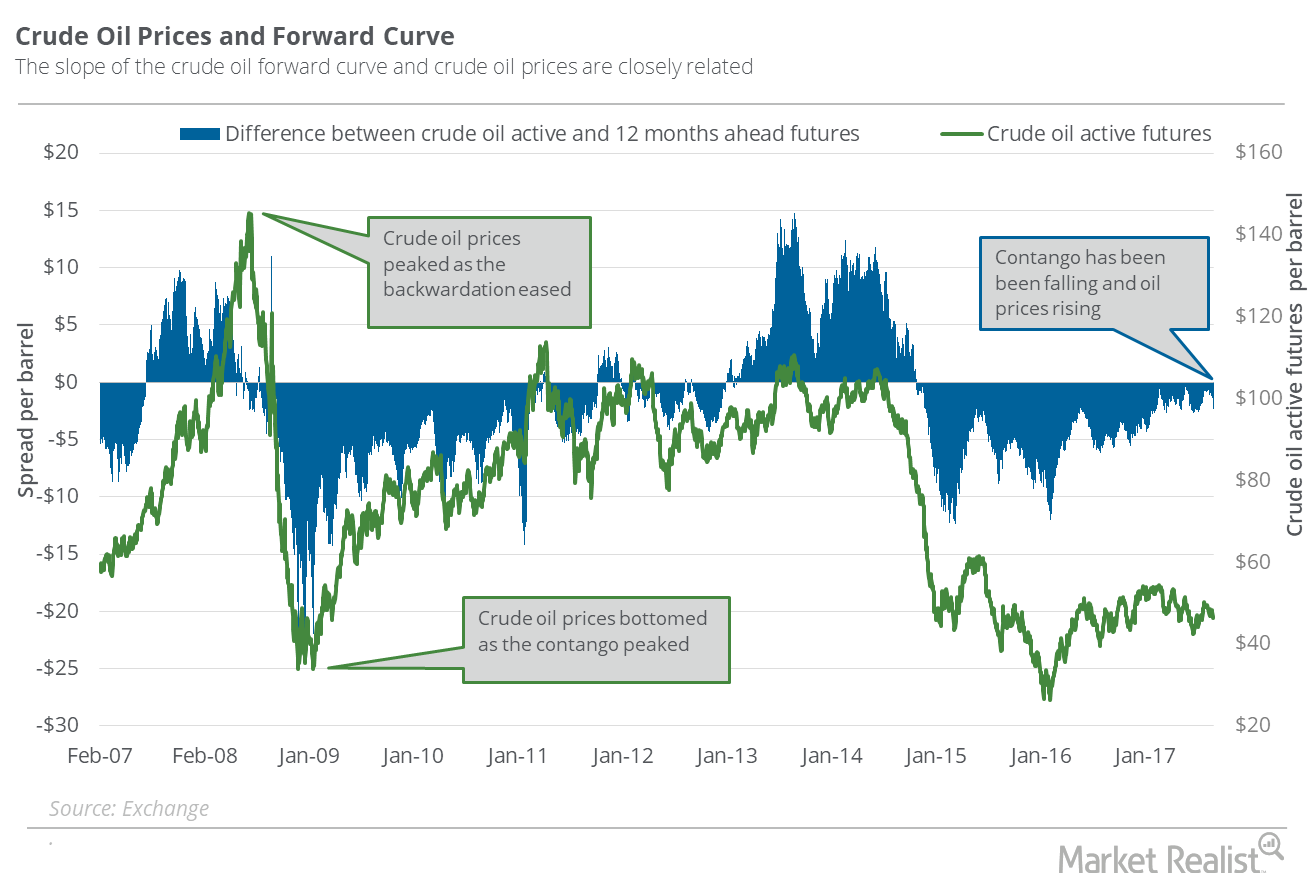
Oil’s Futures Spread: Have Supply Glut Concerns Increased?
On August 29, 2017, US crude oil (USL) October 2018 futures traded at a premium of $2.37 to October 2017 futures.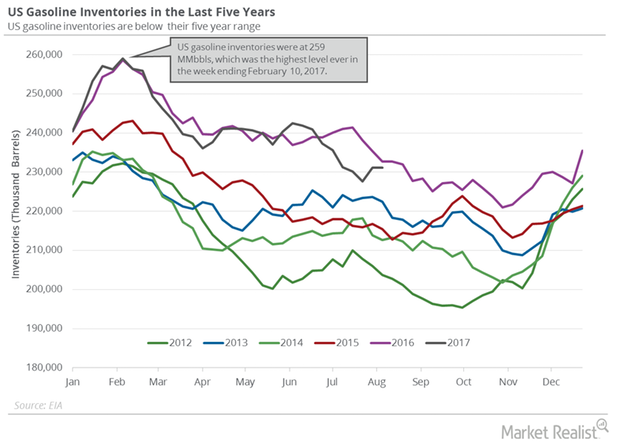
US Gasoline Inventories Pressured Gasoline and Crude Oil Futures
The EIA reported that US gasoline inventories rose by 22,000 barrels or 0.1% to 231.1 MMbbls (million barrels) on August 4–11, 2017.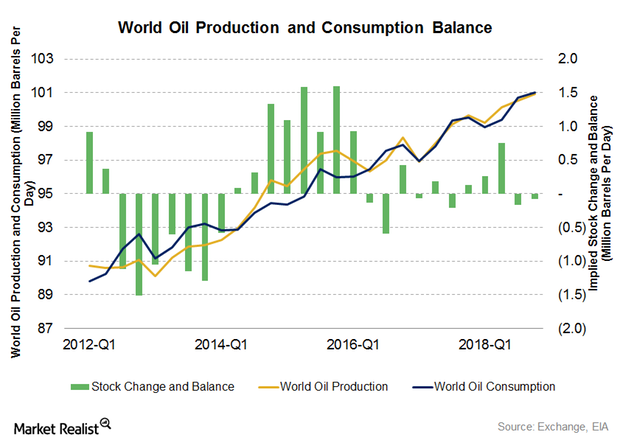
Will Global Oil Consumption Beat Production?
WTI (West Texas Intermediate) crude oil (PXI)(USL)(SCO) futures contracts for September delivery fell 0.1% and were trading at $48.78 per barrel in electronic trading at 2:00 AM EST on August 14, 2017.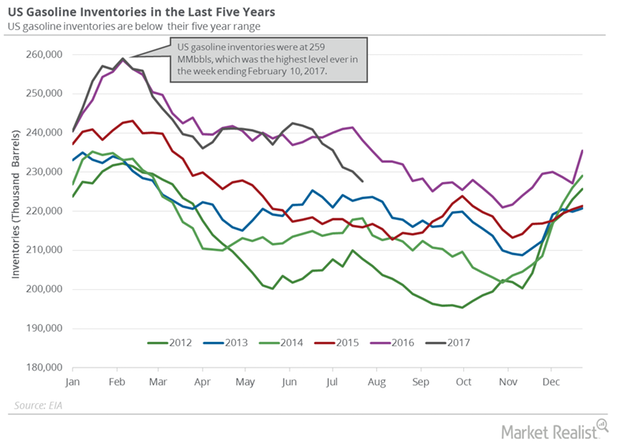
US Gasoline Inventories Fell, Supported Gasoline Oil Prices
The EIA reported that US gasoline inventories fell 1.1% or by 2.5 MMbbls (million barrels) to 227.7 MMbbls on July 21–28, 2017.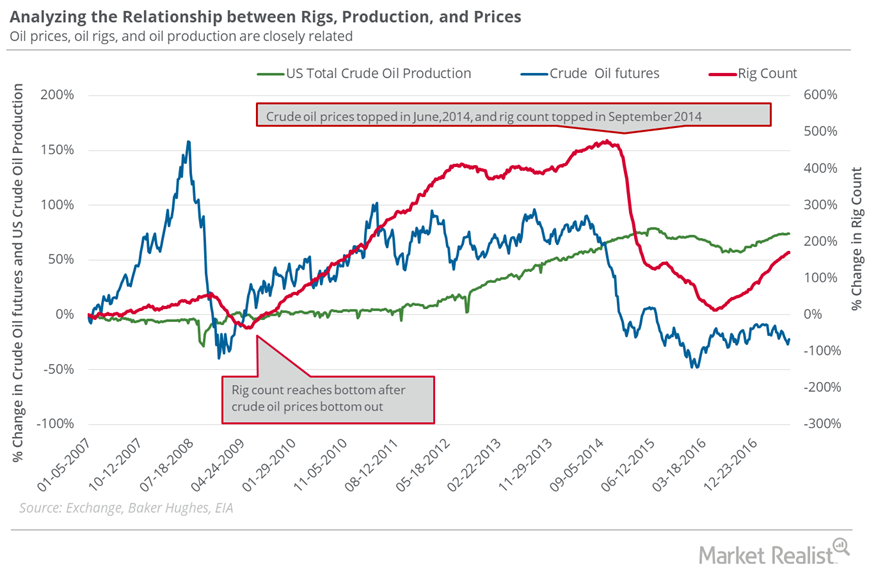
Oil Rigs: Oil Prices Could Make a U-Turn
The US oil rig count extended to 765 in the week ending July 14, 2017—a gain of two rigs compared to the previous week.
Why Oil Prices Could Plunge
The US oil rig count rose by seven to 763 in the week ended July 7, 2017. This was the rig count’s highest level since April 10, 2015.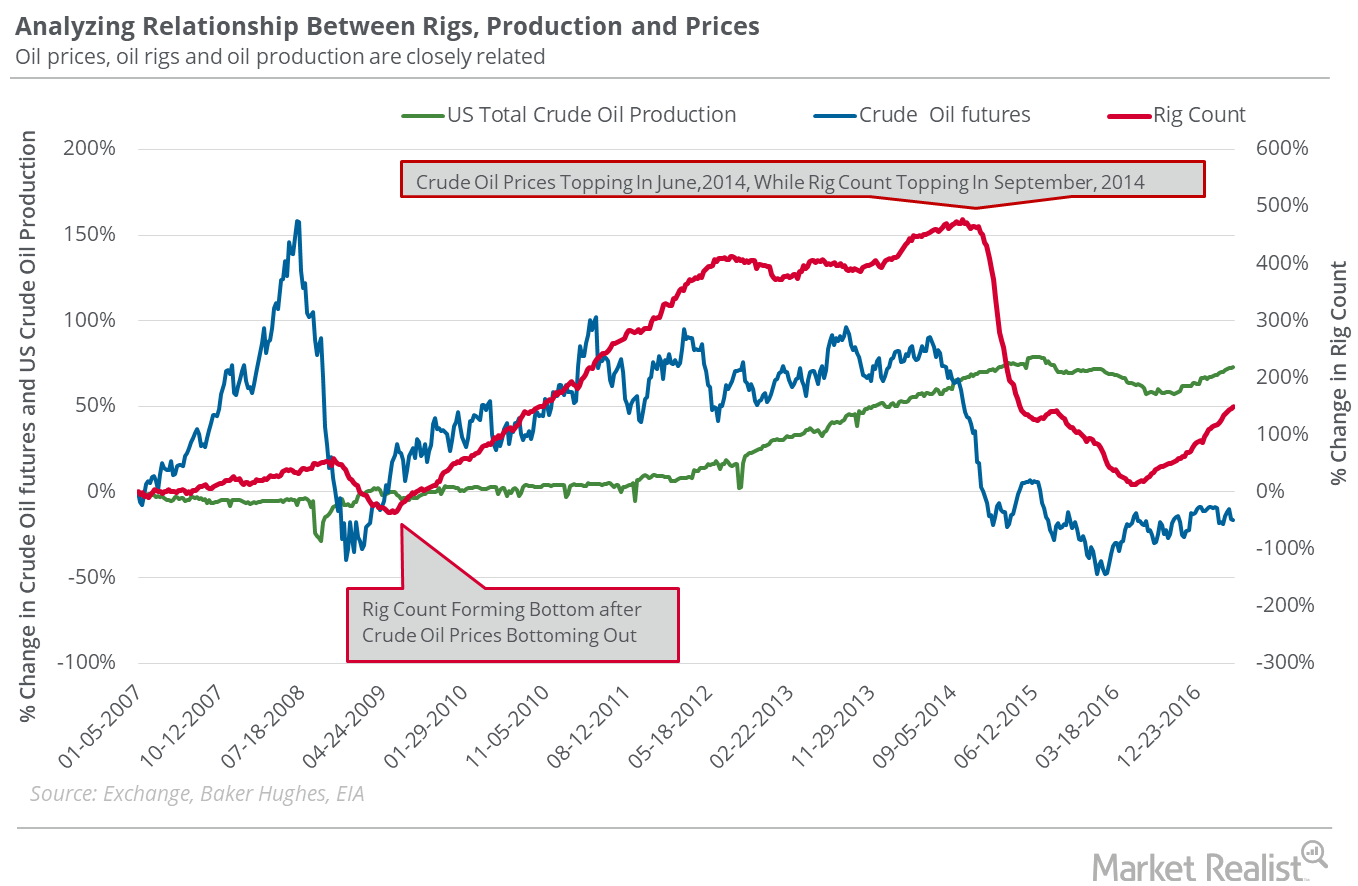
Oil Rigs: Will Oil Prices Rise More?
On June 23–June 30, the US oil rig count fell by two to 756. The fall was marginal, but it was the first fall after rising for 23 consecutive weeks.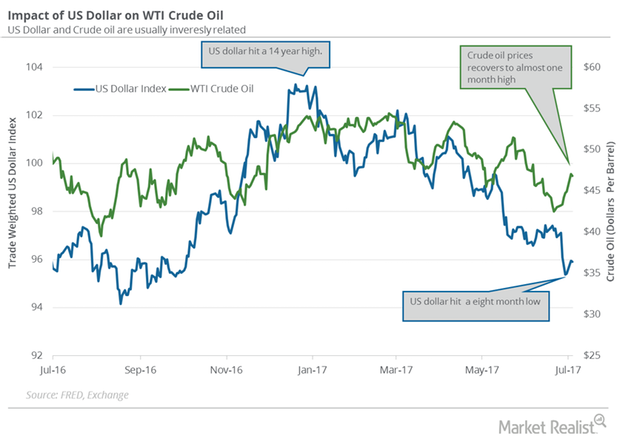
Will the US Dollar Continue Its Bearish Momentum This Week?
August 2017 West Texas Intermediate crude oil futures contracts fell 0.5% and were trading at $46.83 per barrel in electronic trade at 1:45 AM EST on July 4, 2017.
Will US Crude Oil Hit $40 Next Week?
On June 22, 2017, WTI crude oil (USO) (OIIL) active futures’ implied volatility was 29.7%, up 1.7% compared to its 15-day average.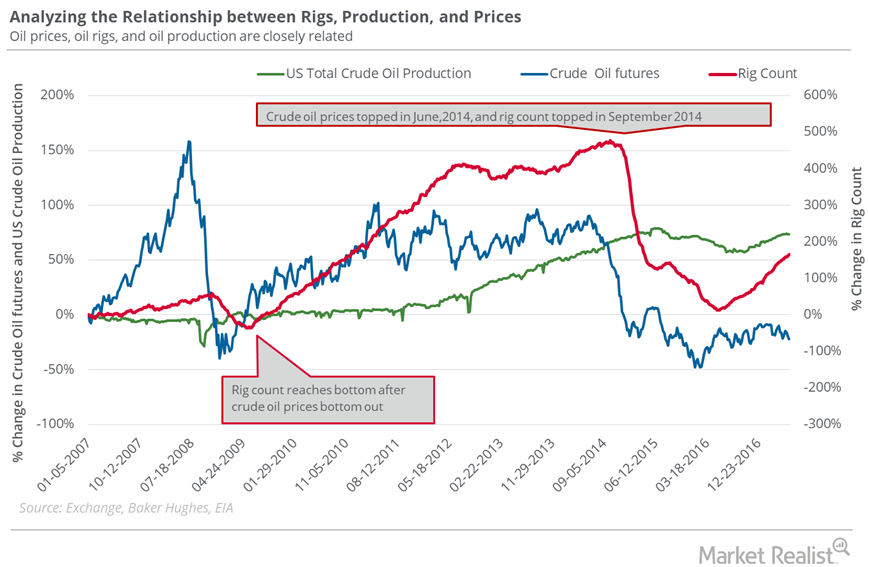
Rising Oil Rigs: Oil Bears’ Friend, Oil Bulls’ Foe
In the week ended June 16, 2017, the US oil rig count was 747, its highest level since the week ended April 17, 2015.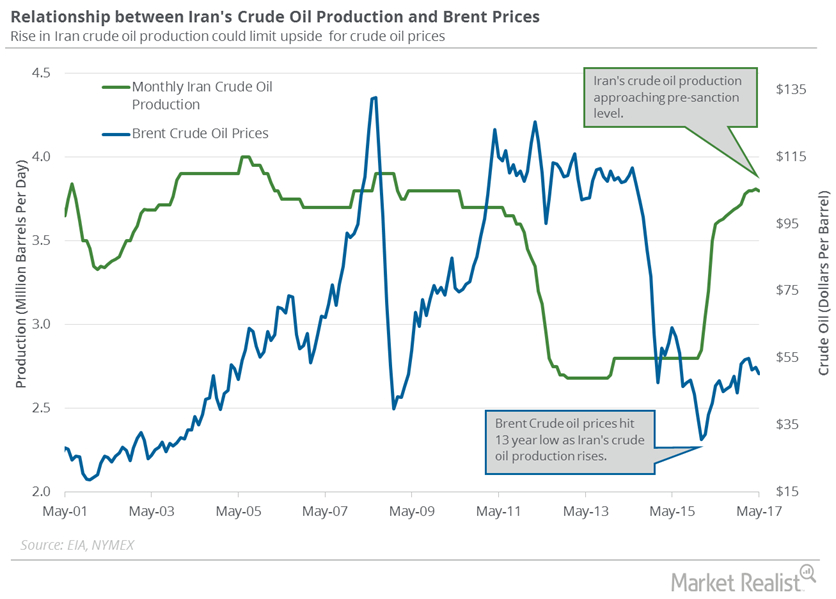
Analyzing Iran’s Crude Oil Production and Export Plans
Iran’s crude oil production is at a seven-year high. Iran was able to scale up production after the US lifted sanctions on the country in January 2016.
Where Will US Crude Prices Settle?
On June 15, 2017, US crude oil active futures’ implied volatility was 27.9%.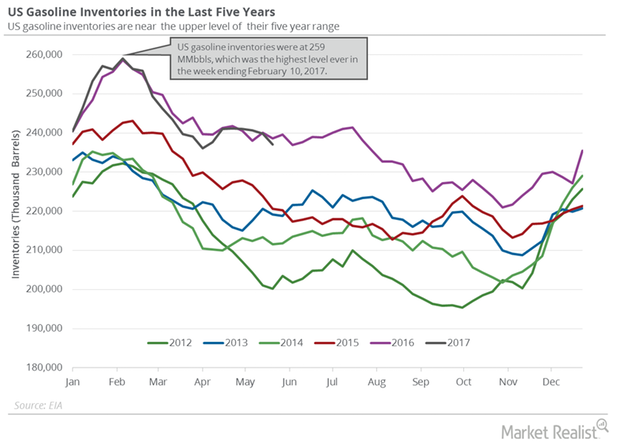
US Gasoline Inventories: More Concerns for Crude Oil Prices
US gasoline inventories are 7.2% below their all-time high. The expectation of a fall in gasoline inventories could support gasoline prices.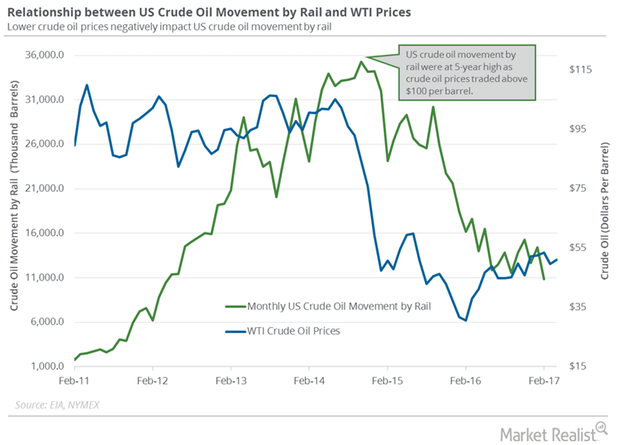
How Did Crude Oil Movement by Rail Trend in February 2017?
The US Energy Information Administration estimates that US crude oil movement by rail fell by 3,546,000 barrels to 10,850,000 barrels in February 2017.
