PowerShares Global Listed Private Eq ETF
Latest PowerShares Global Listed Private Eq ETF News and Updates
Why Closed-End Funds Are Not That Enthusiastic about Rate Changes
Prospect Capital (PSEC) is strengthening its capital position in order to take advantage of mispricing during volatile times.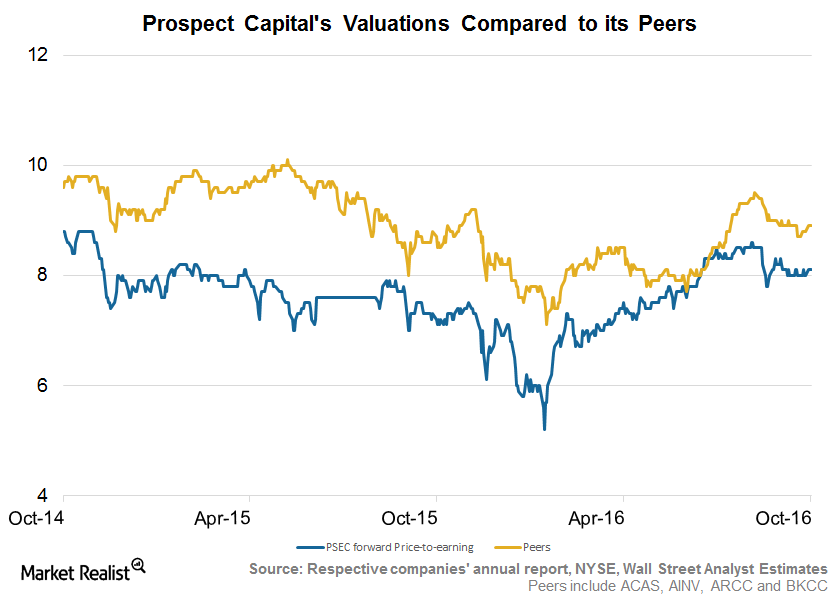
Prospect’s Valuation Discount Consistent on Lower Originations
Prospect Capital’s (PSEC) stock has fallen ~3% in the past quarter, and it has risen ~11% in the past year. The company is currently trading 7% lower than its 52-week high.
Prospect Capital’s Valuations: Fair amid Originations, Leverage
Prospect Capital (PSEC) stock rose 3.0% over the past three months and 20.0% over the past year. The company is currently trading 5.0% below its 52-week high.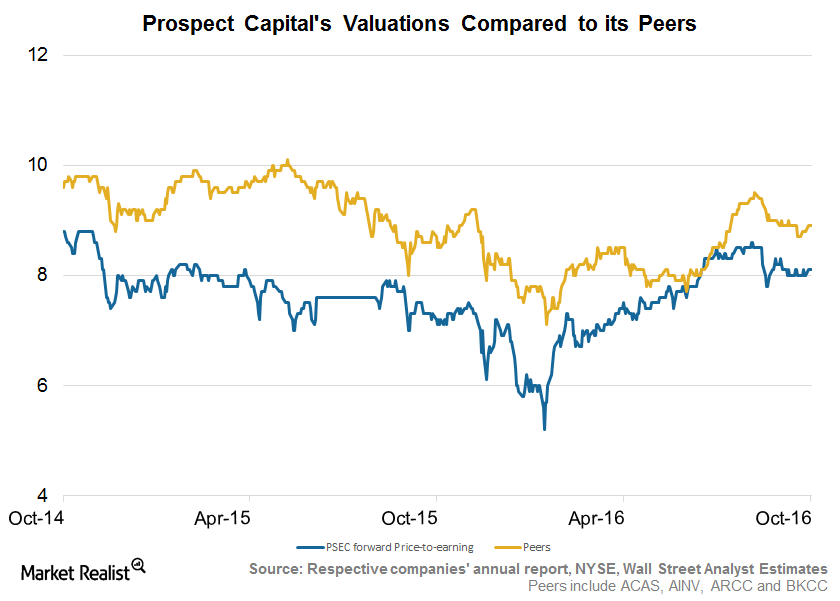
Prospect Valuations Fair amid Rising Originations, Strong Yields
Prospect Capital’s (PSEC) stock fell ~7% in fiscal 1Q17 (September quarter) but has risen ~6% in the past 12 months.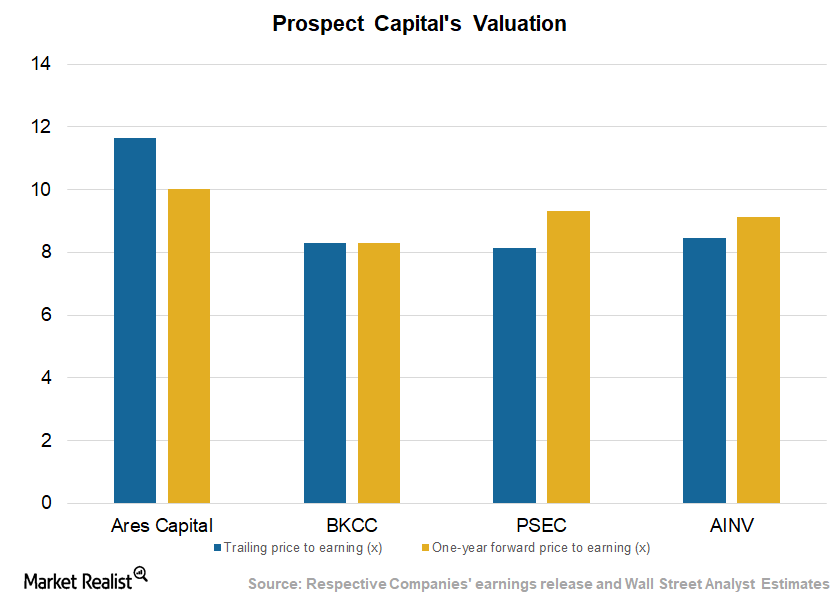
Prospect Capital’s Valuation: Fair or Discounted in Long Term?
Prospect Capital (PSEC) stock has fallen 14.5% over the past six months and 16.9% over the past year.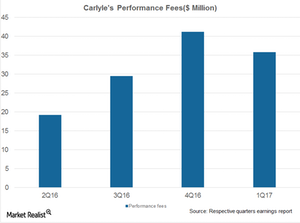
What’s Happening Now with Carlyle’s Investment Solutions Segment?
Carlyle Group (CG) raised new capital of $3 billion in 1Q17, which included $1.4 billion from its Investment Solutions segment and $1 billion from Real Assets.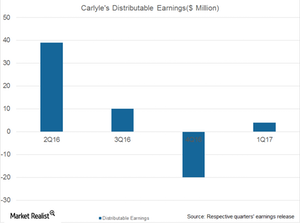
Inside Carlyle’s Expected Performance in Real Estate Assets
Real estate experts have an optimistic view of the industry, backed by a rising number of allocations in core and opportunistic funds by investors.
Understanding Carlyle’s Improved Performance despite Rate Hike Expectations
Carlyle Group has a number of credit strategies in place, and for its LPs (limited partnerships), the company is planning to invest in new credit strategies.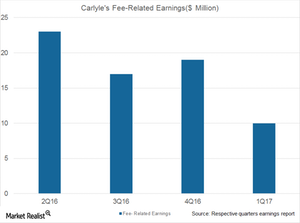
This Segment Is Driving Carlyle’s Numbers
For 1Q17, Carlyle Group reported higher economic net income in its Corporate Private Equity segment, from $32 million in 1Q16 to $313 million in 1Q17.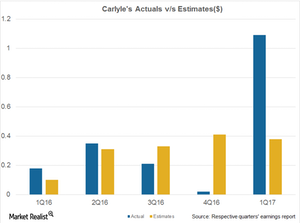
Carlyle Saw Impressive 1Q17 Results, but Can It Sustain?
After a subdued performance in 4Q16 and heavy losses in its Global Market Strategies segment, Carlyle Group (CG) reported improved numbers in 1Q17.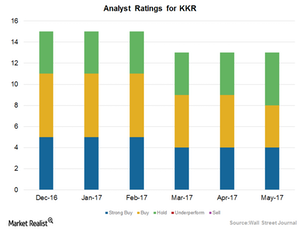
How Wall Street Analysts View KKR’s Performance in 2017
Analysts gave KKR an average target price of $21.42 from the current price, suggesting a rise of 14.3%.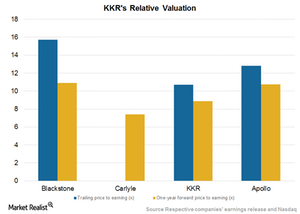
KKR’s Valuation amid Rising Equity Valuations in 2017
KKR & Co. (KKR) has posted earnings per share (or EPS) of $1.76 over the last four quarters.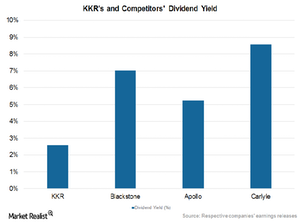
KKR’s Distribution Policy: A Reward for Unit Holders
KKR & Co. (KKR) paid a fixed dividend of $0.17 in May 2017 according to its policy announced in 2016.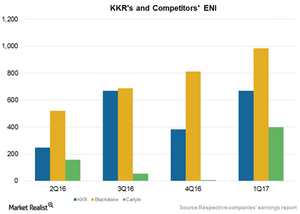
How KKR Is Performing in Relation to Alternative Managers
KKR & Co. (KKR) has reported an increase in its economic net income (or ENI) to $668.5 million in 1Q17 compared to $383.2 million in 4Q16.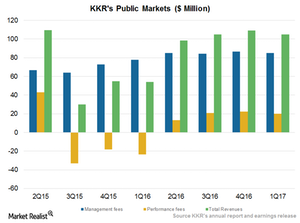
What Could Lead KKR’s Public Market Segment to Rise or Fall?
KKR has seen a decline in its base fees to $85.5 million in 1Q17 compared to $86.7 million in 4Q16.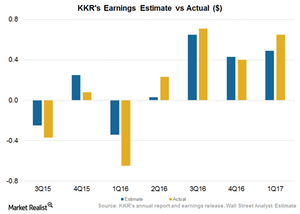
KKR’s 2Q17 Performance on Deployments, Rise in Holdings
In 1Q17, KKR & Co. (KKR) deployed ~$5.4 billion in its Public Markets and Private Markets segments. KKR is expected to post EPS of $0.49 in 2Q17 and $2.15 in fiscal 2017, representing year-over-year growth of 113% and 216%, respectively.
Alternatives’ Deployments May Remain Stable on Fundamentals
In 2016, alternatives saw higher investments as well as exits on the back of improved liquidity, rising markets, higher valuations, and distressed pricing in corporate credit.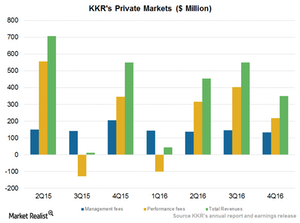
KKR Private Markets Segment Projects Deployment and Growth in 2017
KKR & Company’s (KKR) Private Markets segment contributed almost 71% of the company’s total revenues in 4Q16.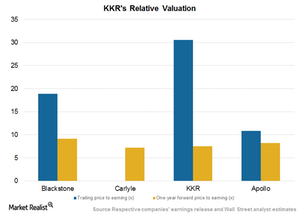
Why KKR’s Valuations Could Rise in 2017
First Data (FDC) is one of KKR’s major holdings. The stock has risen 7.8% in 4Q16 as compared to a substantial decline in 1H16.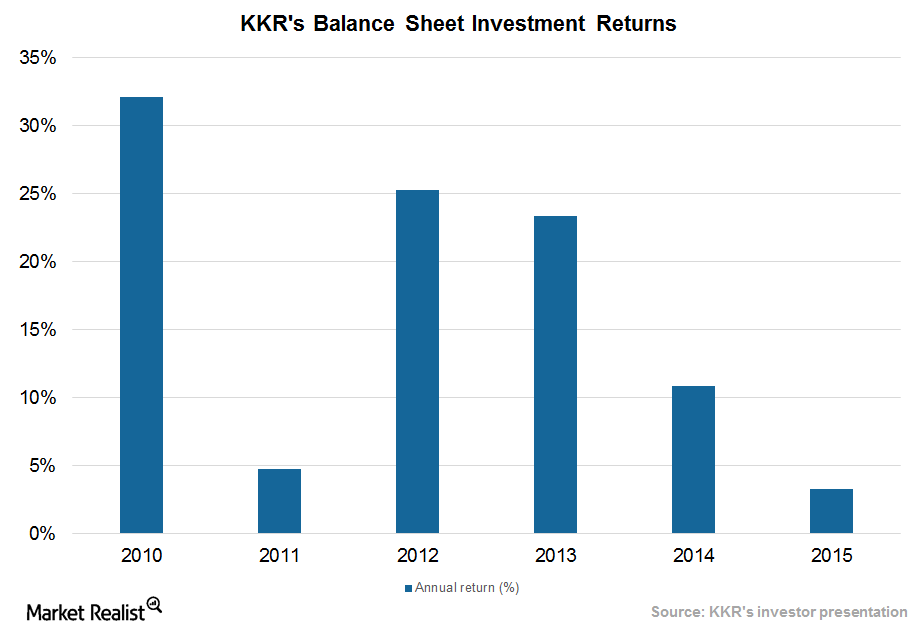
KKR Enhances Dividends and Repurchase Program on Growth
KKR & Company (KKR) is creating value for shareholders through share dividends and repurchases.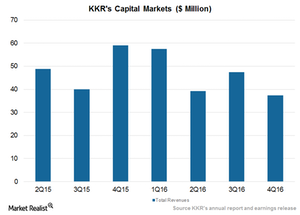
KKR’s Capital Markets Segment Was Subdued amid Lower Activity
KKR’s (KKR) Capital Markets and Principal Activities segment complements its activities in both private and public markets.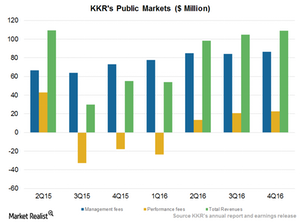
KKR Public Markets Could See Slower Growth in 2017 on Rate Hikes
Public markets have performed well over the past couple of quarters mainly due to a rebound in energy prices (USO), which has led to rising prices of distressed credit.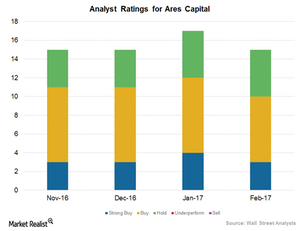
Ares Capital’s Analyst Ratings Suggest Stable Earnings in 2017
In February 2017, 12 of the 17 analysts covering Ares Capital, or ~71%, have rated it as a “buy” or a “strong buy.”
Ares Capital Valuations at a Premium on Relative Outperformance
Ares Capital stock has risen ~11.7% over the past six months. The company saw a strong performance in 4Q16 on higher deployment, stable yields, and expense management.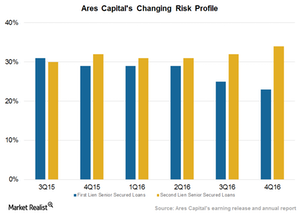
Ares Capital’s Preference for Second Lien Continued in 4Q16
Ares Capital has consistently enhanced its exposure to second lien debt in a bid to generate higher yields. In 4Q16, its second lien debt made up 33% of its new commitments.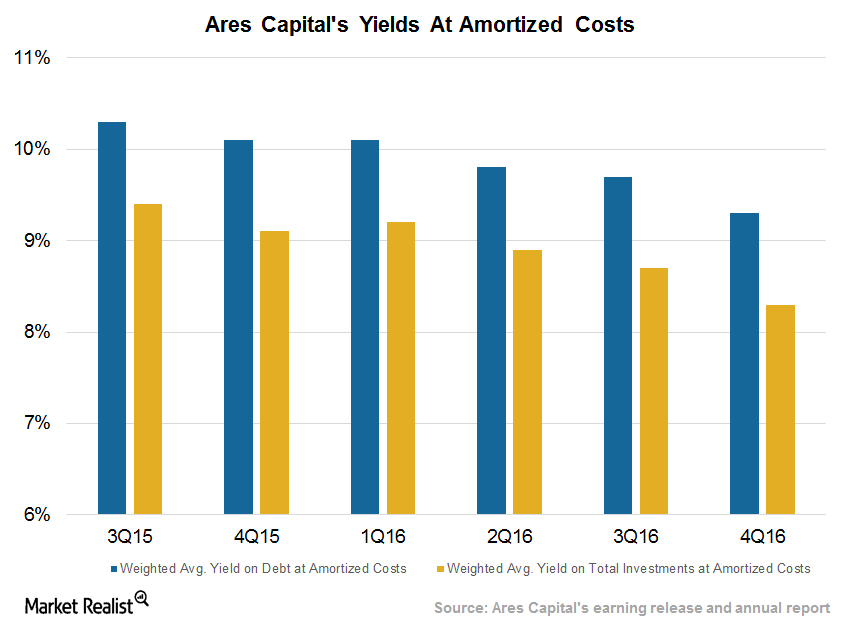
Ares Capital’s Credit Statistics Deteriorated Marginally in 4Q16
Ares Capital’s (ARCC) portfolio totaled $8.8 billion at fair value on December 31, 2016. Its total assets stood at $9.2 billion.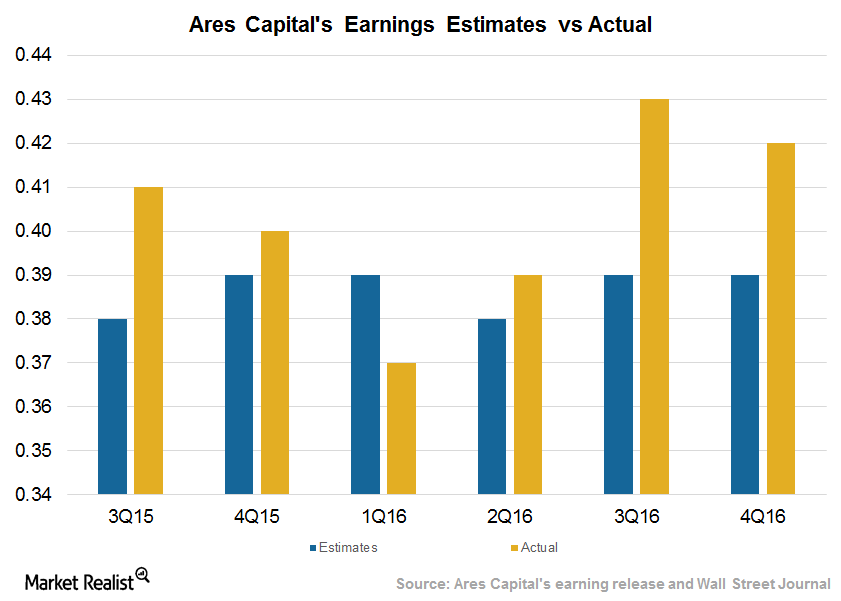
Ares Capital Beat Estimates for Deployments, Yields in 4Q16
Ares Capital (ARCC) posted EPS (earnings per share) of $0.42, beating Wall Street analysts’ consensus estimate of $0.39 in 4Q16.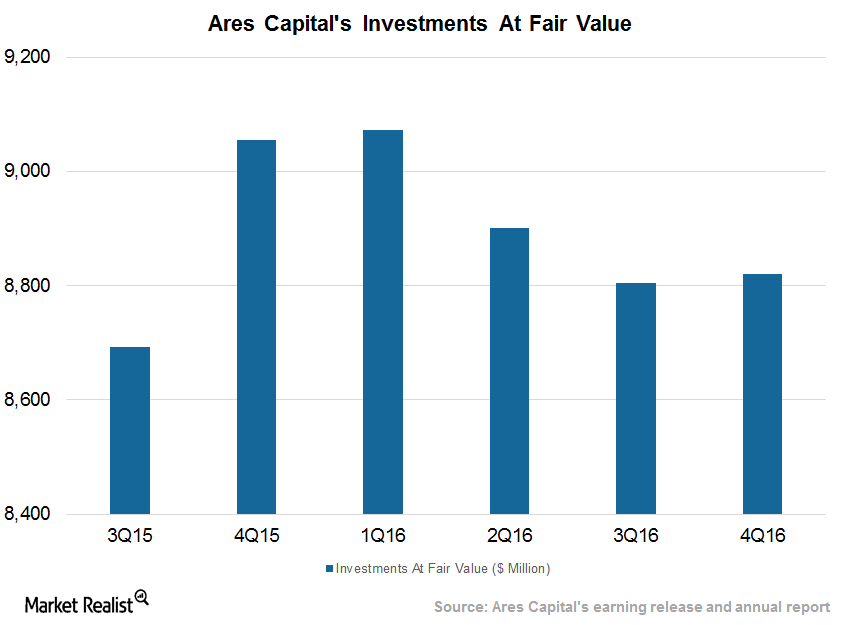
ARCC’s Net Investments Rose on Senior Secured Loans in 4Q16
By the end of December 2016, Ares Capital (ARCC) had a diversified portfolio of 218 companies totaling $8.8 billion at fair value.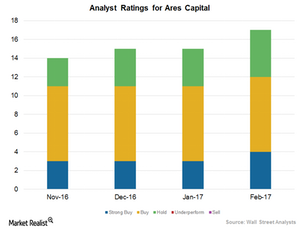
What Analyst Ratings Say about Ares Capital’s Performance
Analysts’ ratings for Ares Capital Ares Capital’s (ARCC) analyst ratings have improved over the past few months due to rising earnings and originations. So far in February 2017, twelve of the 17 analysts covering the company have rated it as a “buy” or a “strong buy.” Five analysts rated it as a “hold.” Since January 2017, Ares […]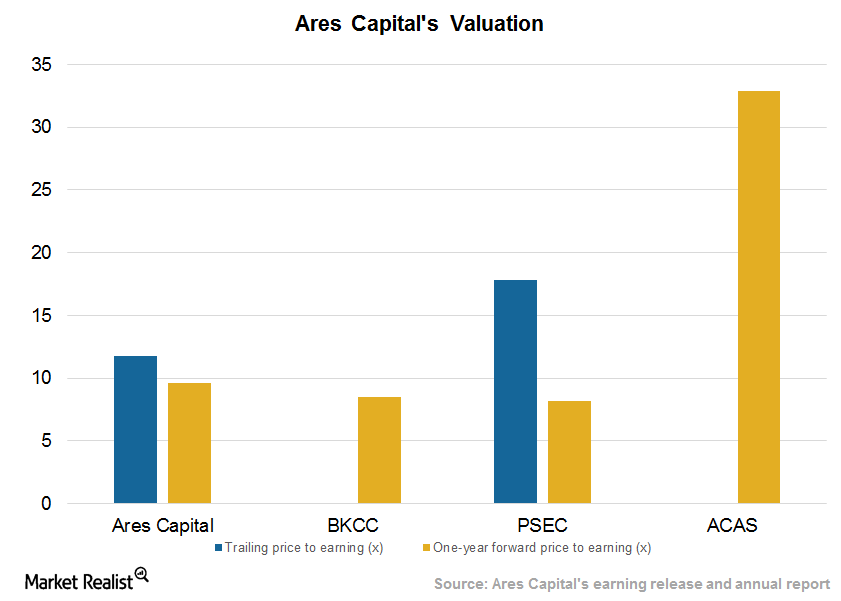
What Boosted Ares Capital’s Valuation?
Stock performance Ares Capital (ARCC) stock has risen ~14% over the past six months and 37% over the past year due to improved operating performance. In 3Q16, the company saw higher deployments and yields, and lower expenses. The company declared a dividend of $0.38 per share in 3Q16, in line with that of 3Q15. With a dividend […]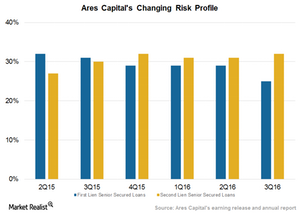
Could Ares Capital’s Second-Lien Preference Continue in 4Q?
Second-lien preference Ares Capital (ARCC) has consistently increased its exposure to investments in second-lien debt to garner higher yields. In 3Q16, second-lien debt made up 23% of its new commitments and exits made up 18%. Second-lien loans formed 32% of the company’s total portfolio, and first-lien senior secured loans fell to 25% from 29% in […]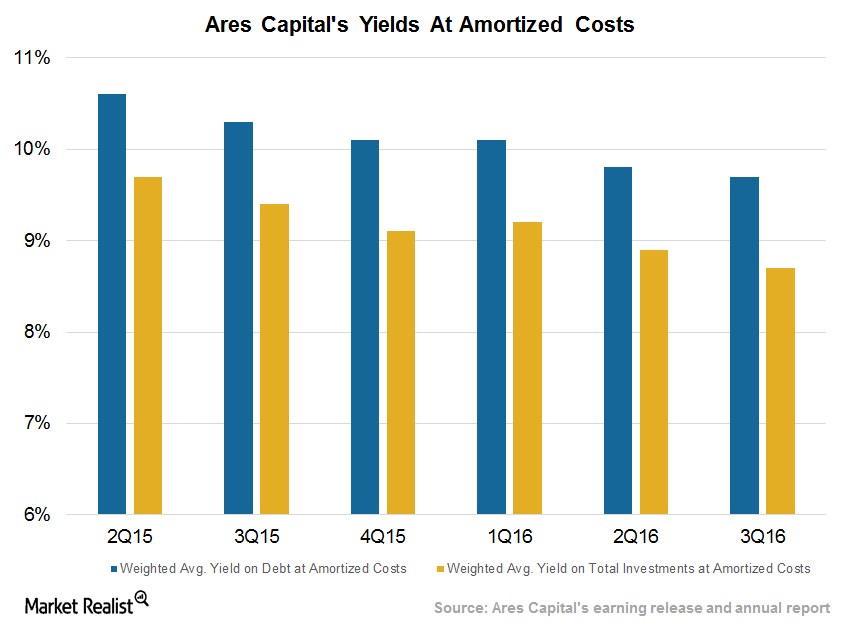
Ares Capital’s Credit Statistics Expected to Improve in 4Q16
Broad markets driving statistics Ares Capital’s (ARCC) portfolio valuation and total assets stood at $8.8 billion and $9.1 billion, respectively, on September 30, 2016. The company’s corporate borrowers posted last-12-month EBITDA (earnings before interest, tax, depreciation, and amortization) growth of ~7% due to adequate growth and repayment capability. In 3Q16, Ares Capital’s credit statistics fell, with non-accrual […]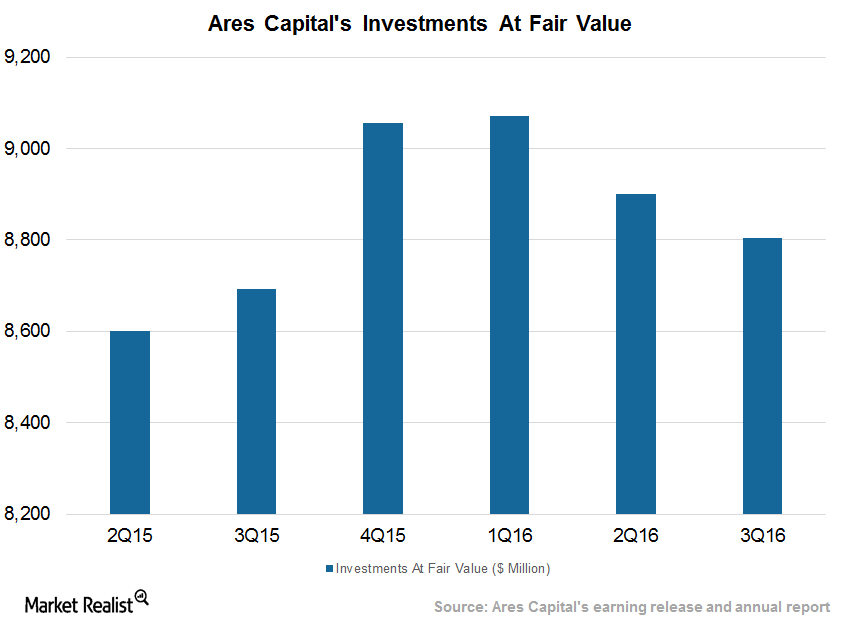
How Ares Capital’s Net Investments Could Rise in 4Q16
Net investments to rise Ares Capital (ARCC) has seen subdued deployment over the past few quarters. The company’s investments have fallen since 1Q16, mainly due to higher exits. In 4Q16, Ares might see marginally higher net investments due to new programs and first- and second-lien lending. As of September 30, 2016, Ares Capital had a diversified […]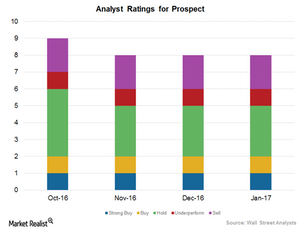
What Analyst Ratings Suggest about Prospect’s Performance
Analysts’ ratings for Prospect Of the eight analysts covering Prospect Capital (PSEC), two rated it a “buy” or “strong buy” in January 2017. Three analysts, or ~37.5%, rated it a “hold.” One analyst rated Prospect an “underperform” and two analysts rated the company a “sell.” Prospect’s mean target price is $8.05 per share, implying a fall of 7.9% […]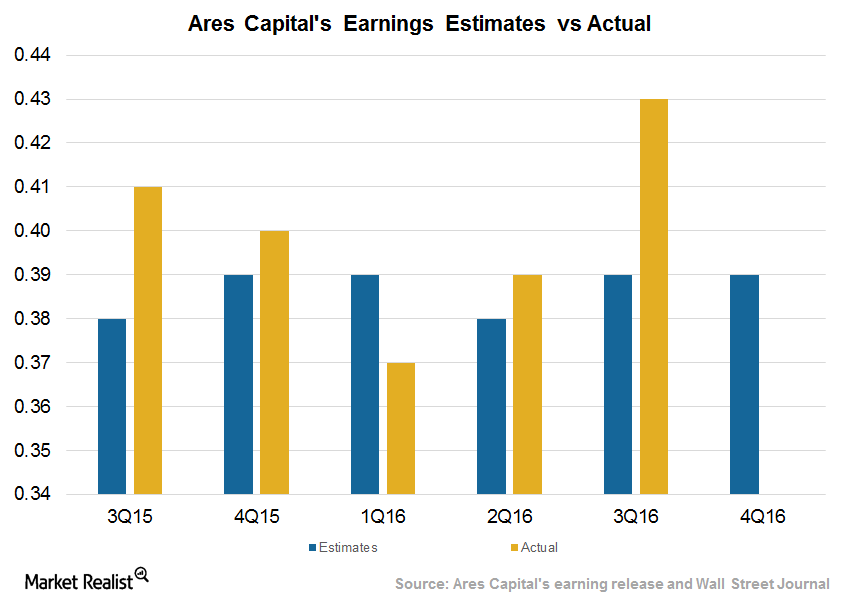
Ares Capital’s 4Q16 Quarterly Earnings: What to Expect
Ares Capital (ARCC) is expected to post EPS (earnings per share) of $0.39 in 4Q16, compared with $0.40 in 4Q15 and $0.43 in the previous quarter.
With Net Exits and Improved Yields, Prospect’s Valuation Is Fair
Fiscal 2Q17 net exits Prospect Capital (PSEC) stock has risen 16% over the past three months and 16% over the past year. The company is currently trading near its 52-week high. The company saw net exits of $175.5 million in fiscal 2Q17, with higher exits from first-lien holdings. It saw lower leverage mainly due to higher exits, […]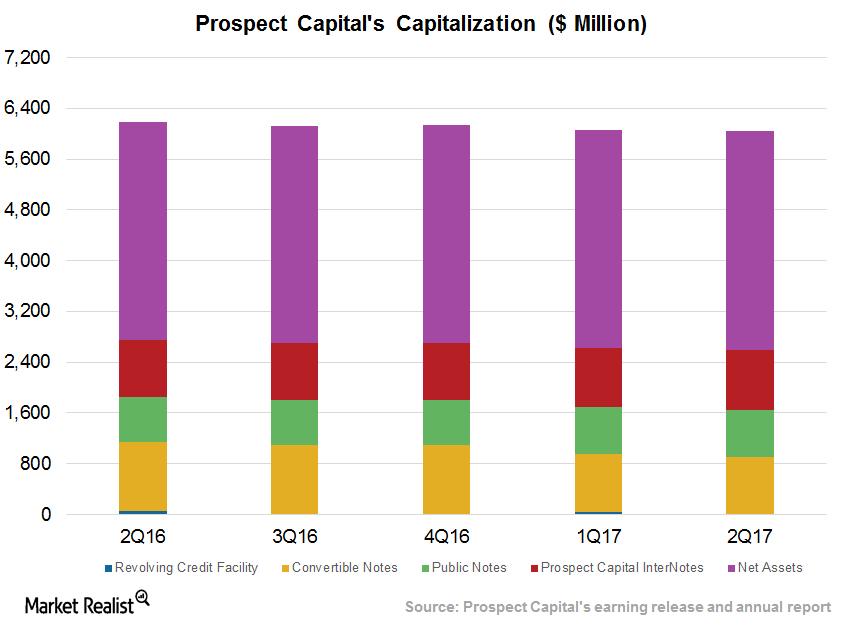
Prospect’s Leverage Falls Due to Net Exits in Fiscal 2Q17
Leverage declines Prospect Capital (PSEC) has been operating at higher leverage to take advantage of low rates. The company saw higher net exits in fiscal 2Q17, which led to lower leverage. Notably, Prospect’s fiscal 2Q17 net debt-to-equity ratio declined to 76.2% from its fiscal 2Q16 debt-to-equity ratio of 80.2% and 77.4% in the two previous quarters. As […]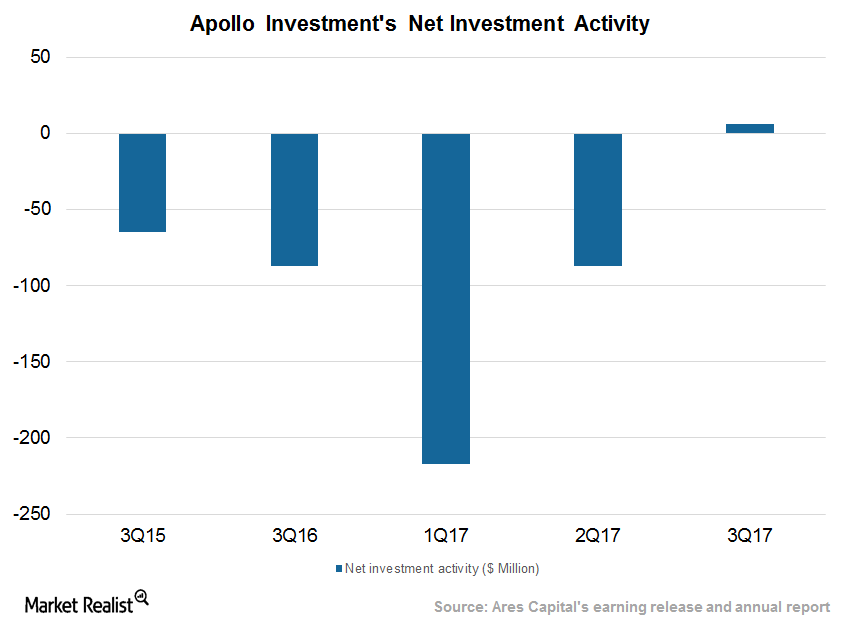
Apollo Investment Sees Net Investments Turn Positive in Fiscal 3Q17
In fiscal 3Q17, Apollo Investments (AINV) sold $17.1 million in investments and repaid $178.2 million.
Apollo Investment Valuations Fair amid Marginal Improvements
In fiscal 3Q17, Apollo Investment (AINV) repurchased 2.3 million shares at a weighted average price per share of $5.90 for a total cost of $13.6 million.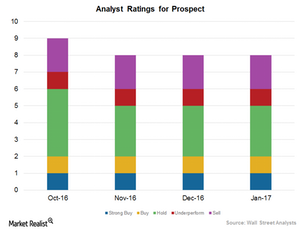
How Analysts View Apollo Investment in 2017
Four of the 15 analysts covering Apollo Investment (AINV) rated it a “buy” or “strong buy” in January 2017.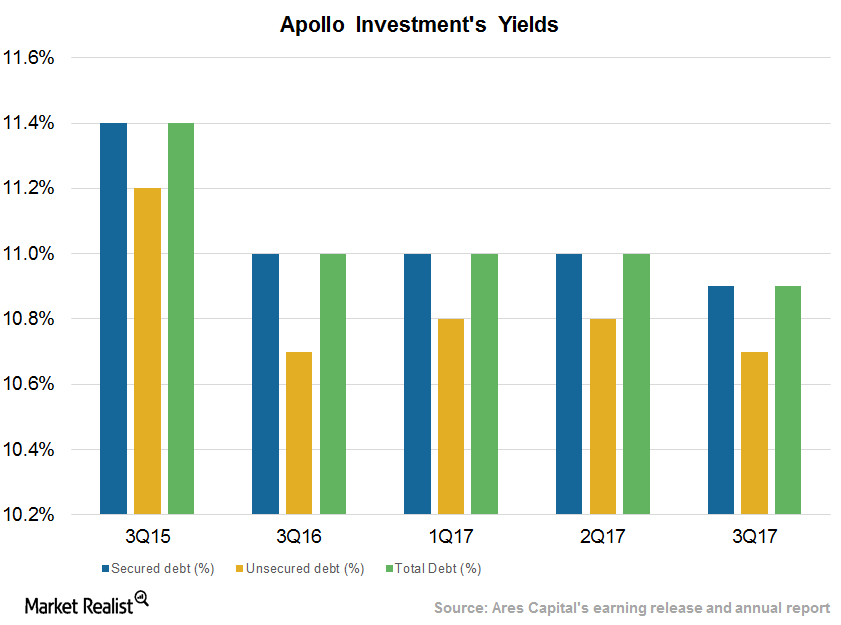
Apollo Investment’s Yields Stabilize on First and Second Liens
Apollo Investment’s (AINV) yields have declined and stabilized at ~10.9%, on par with average returns garnered by other closed-end funds.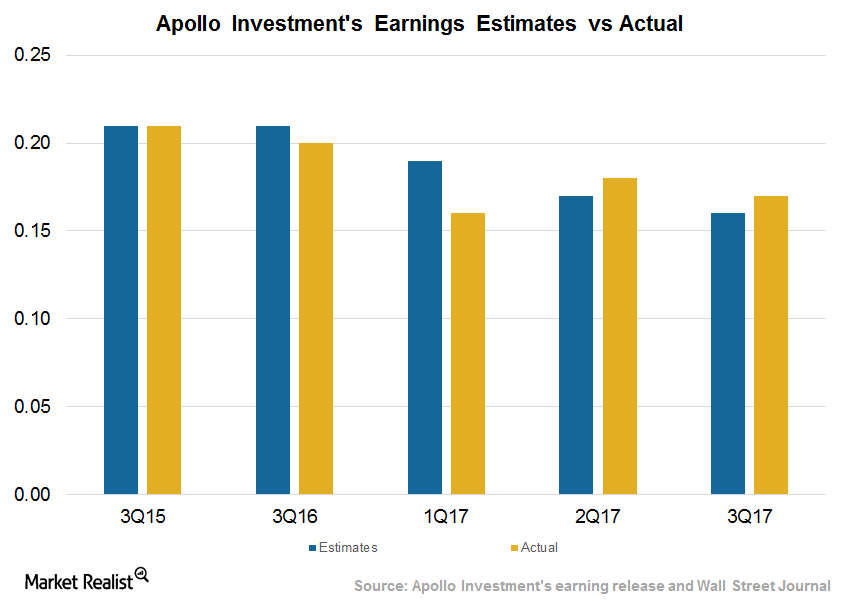
Apollo Investment Earnings Show Signs of Stabilization in Fiscal 4Q17
On February 6, 2017, Apollo Investment (AINV) posted earnings per share of $0.17 in fiscal 3Q17, beating analyst estimates of $0.16.
Alternatives to See Improved Realizations and Deployments in 2017
In 2016, alternative asset managers saw higher exits and investments on the back of improved liquidity. The trend is expected to continue in 2017.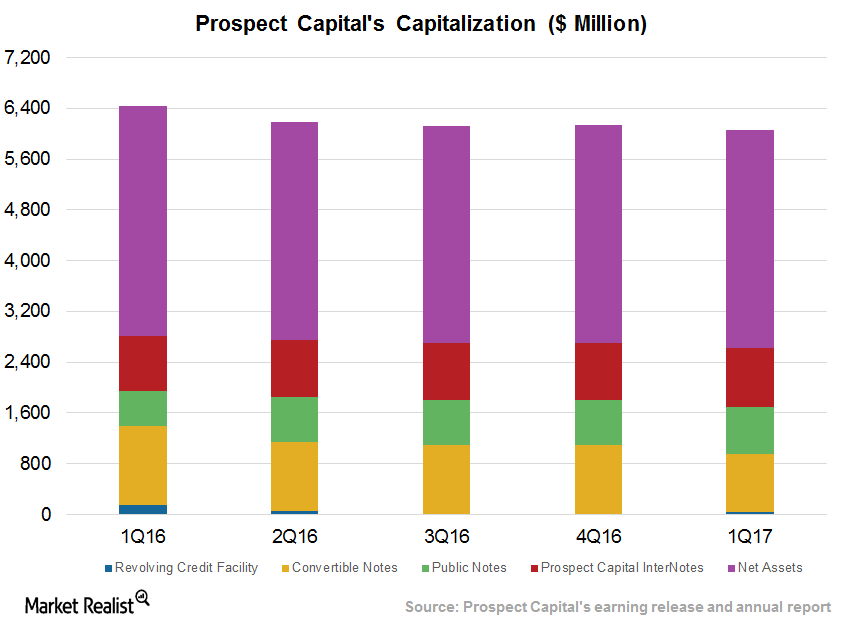
Prospect Capital’s Higher Leverage Could Impact Returns in 2017
Since the Fed increased interest rates in December 2016, Prospect Capital (PSEC) could see some pressure on its cost of capital in 2017.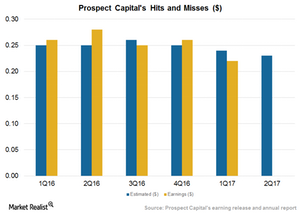
Prospect Capital’s Performance to Rise Marginally in 2017
In this series, we’ll look at Prospect Capital’s expected performance, deployments, portfolio strategy, yields, balance sheet strength, dividends, and valuations.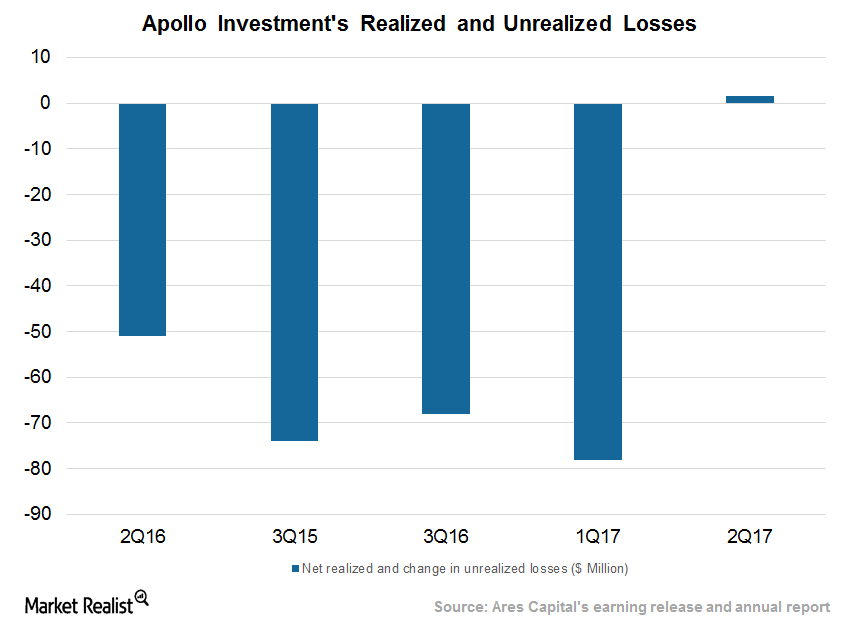
Apollo Investments Sees Gains and Reversal on Portfolio
Apollo Investment’s (AINV) realized and unrealized gains stood at $1.6 million in fiscal 2Q17 compared to realized losses of $42.6 million in fiscal 1Q16.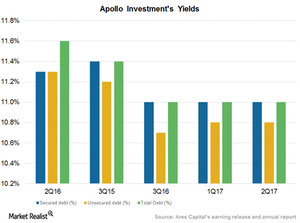
Apollo Investment’s Yields Stabilize, Reduced Exposure in Energy
At the end of fiscal 2Q17, Apollo Investment’s (AINV) oil and gas investments represented 9.7% of its total portfolio, or $246 million.
AINV’s Valuation Fair, Stock Can Rise on Earnings Surprise
Currently, Apollo Investment (AINV) is trading at 8.5x on a one-year forward earnings basis. Its peers are trading at 8.8x.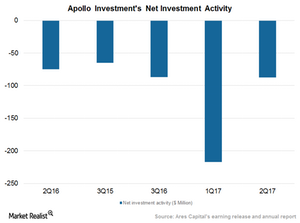
Apollo Investment’s Net Exits Trend Expected to Reverse in 2017
Apollo Investment’s (AINV) total portfolio stood at ~$2.6 billion in fiscal 2Q17 compared to ~$3.2 billion in fiscal 2Q16.
Apollo Investment Improved Bottom Line on Select Investments
Apollo Investment (AINV) posted earnings per share of $0.18 in fiscal 2Q17, compared to analyst estimates of $0.17. In this series, we’ll study AINV’s performance, yields, capital deployment, portfolio, dividends, and valuations.
