First Trust Industrials/Producer Durables AlphaDEX Fund
Latest First Trust Industrials/Producer Durables AlphaDEX Fund News and Updates
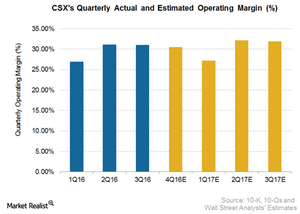
Will CSX’s 4Q16 Operating Margin Exceed Analysts’ Estimates?
For CSX Corporation (CSX), Reuters-surveyed analysts estimate an operating margin of 30.5% for 4Q16, compared to an operating margin of 28.4% in 4Q15.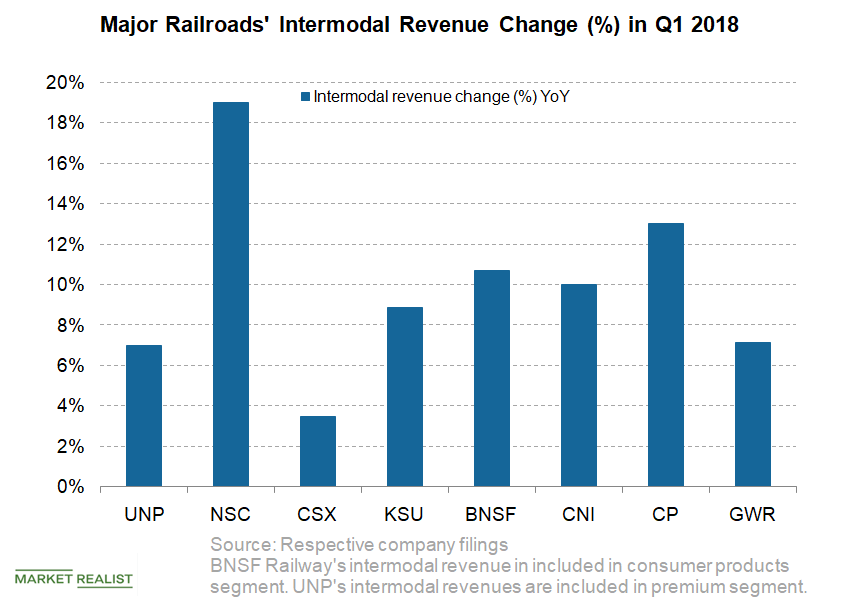
This Railroad Led in First-Quarter Intermodal Revenue Growth
Norfolk Southern (NSC), an Eastern US railroad, reported the highest intermodal revenue growth of 19% YoY among its peers in the first quarter.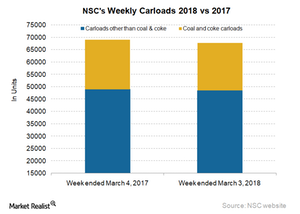
How Norfolk Southern’s Shipments Trended in Week 9
In the week ended March 3, 2018, Norfolk Southern saw a ~2% fall in carload traffic. It hauled ~67,700 carloads in the week.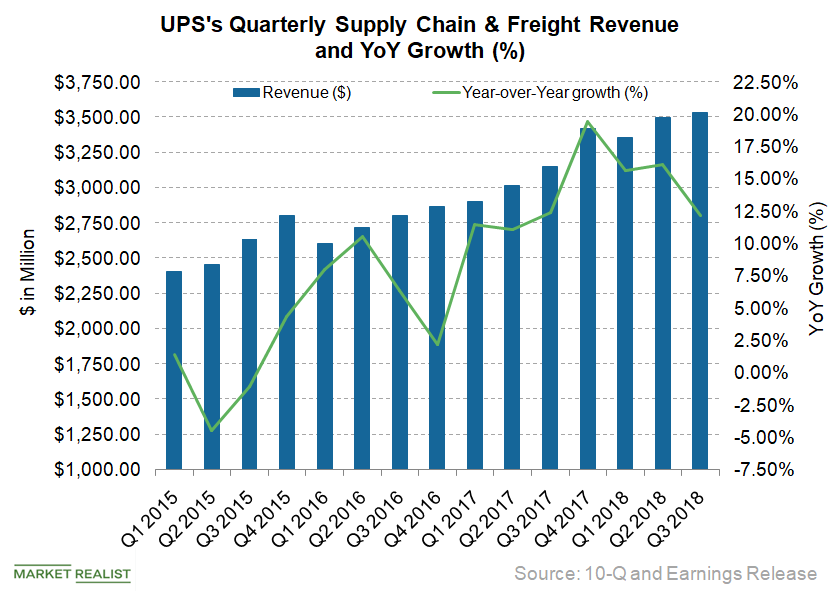
UPS: What Led Its Supply Chain and Freight Growth in Q3 2018?
United Parcel Service’s (UPS) Supply Chain & Freight vertical accounts for ~20% of its total revenues.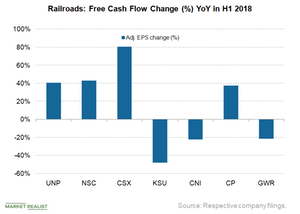
How Railroads’ Free Cash Flow Stacks Up
Free cash flow (or FCF) is an important metric in the railroad (FXR) industry.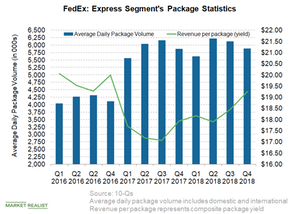
What’s behind FedEx Express’s Revenue Growth?
In this article, we’ll consider FedEx’s (FDX) Express segment’s performance in the fourth quarter.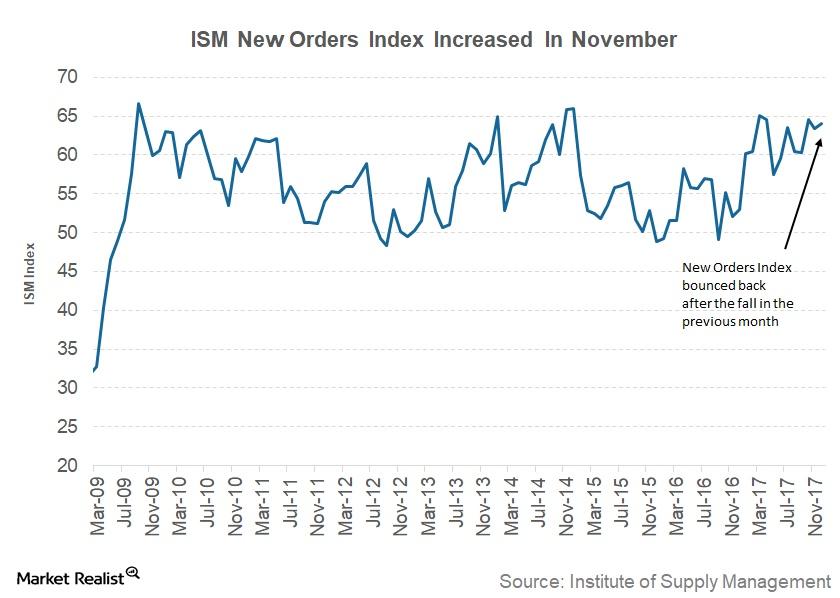
Analyzing the Institute of Supply Management’s New Orders Index
The Institute of Supply Management’s New Orders Index The ISM’s (Institute of Supply Management) New Orders Index is a monthly report on changes in new orders, supplier deliveries, inventories, production, and employment. New orders are a measure of future activity in any industry (VIS), as companies’ production depends on incoming orders. The ISM’s New Orders […]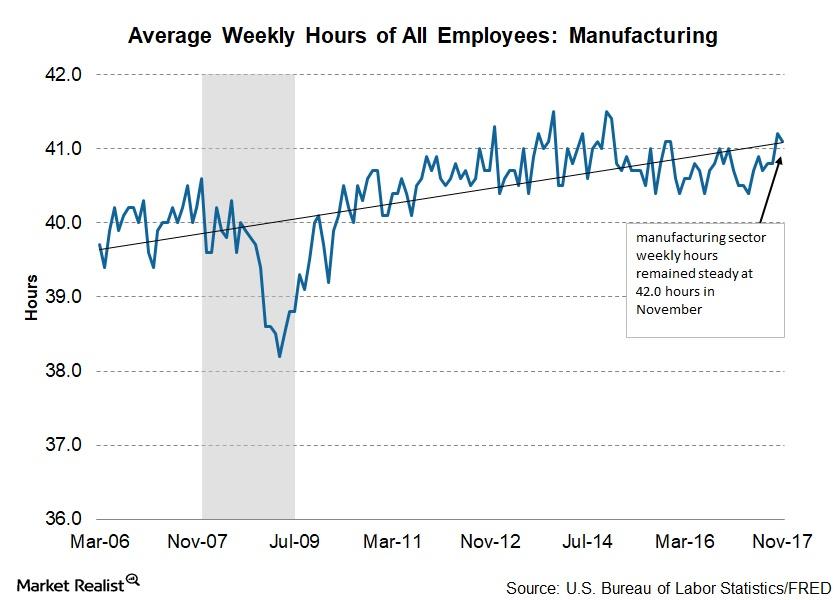
The Effects of Flat Manufacturing Production Hours
The average work week The US Bureau of Labor Statistics’ establishment survey includes data on the number of hours worked by manufacturing employees. Changes in the number of working hours help investors assess the health of the sector. A rise in the number of working hours signals that companies are projecting higher demand in the manufacturing sector […]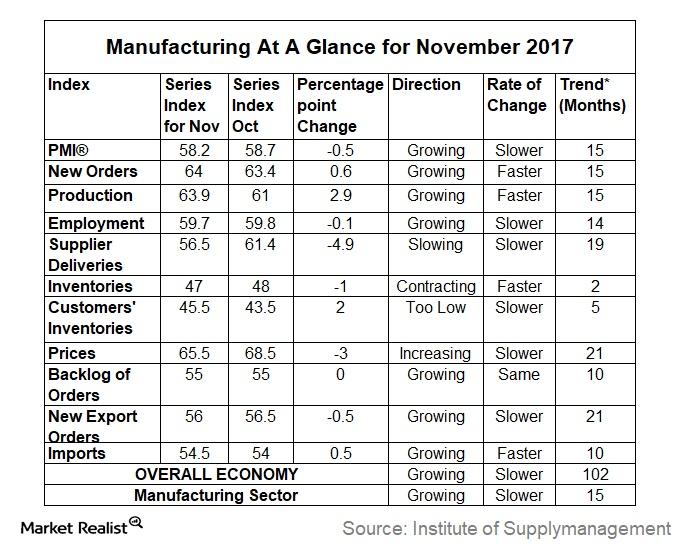
Strength of the Manufacturing Sector: Purchasing Managers’ Index
This has been one of the best years since 2004 for manufacturing activity, viewed through the Purchasing Managers’ Index (or PMI).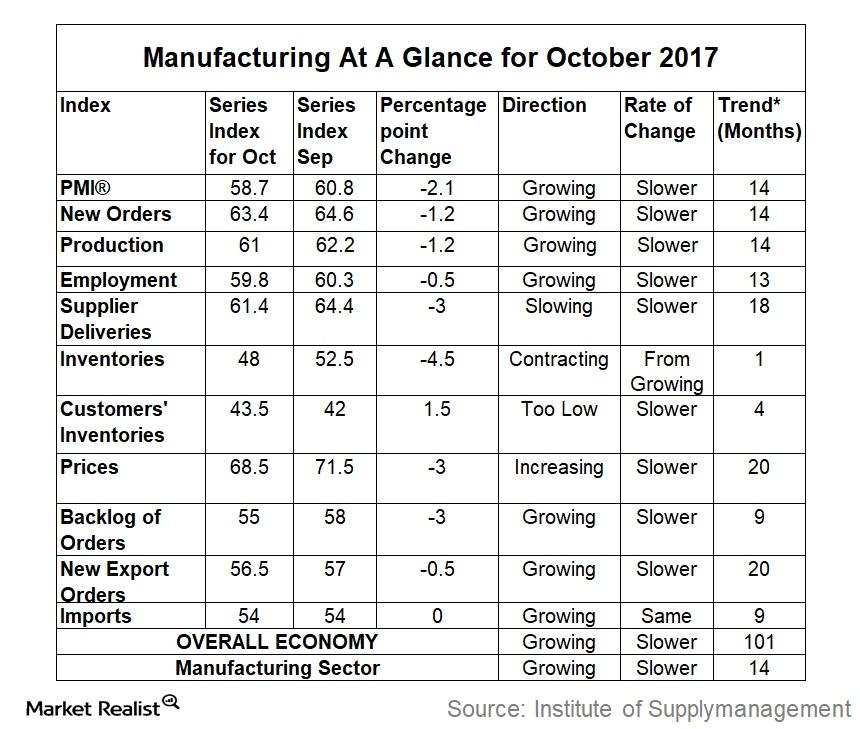
What Caused the Fall in Manufacturing Activity in October?
The US Manufacturing PMI (purchasing managers’ index) for the month of October fell to 58.7, compared with 60.8 in September.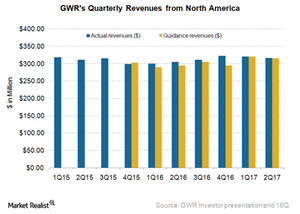
Genesee & Wyoming’s North American Revenues in 2Q17
In 2Q17, GWR’s North American revenues were $315.7 million, a 3.6% rise from $304.6 million in the same quarter last year.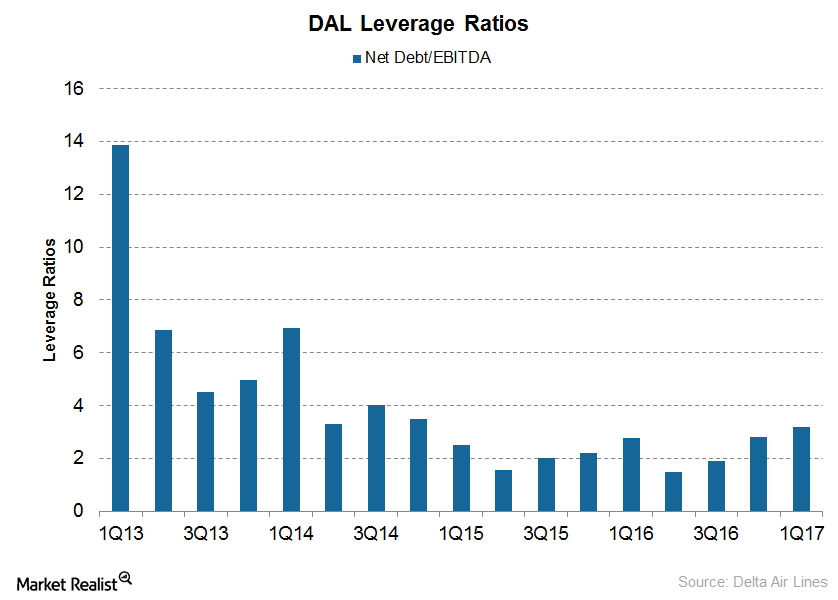
What Delta Air Lines’ Debt Position Means for Investors
During 1Q17, Delta Air Lines’ (DAL) debt rose by ~$2 billion at a blended interest rate of just 3.3%.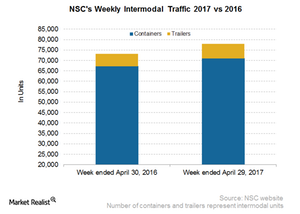
Comparing Norfolk Southern’s Intermodal Traffic with CSX’s
Norfolk Southern’s intermodal traffic Norfolk Southern’s (NSC) total intermodal traffic rose 6.5% in the week ended April 29, 2017. Its volumes reached ~78,000 containers. Norfolk’s container traffic rose 5.6%, and its trailer traffic rose 15.6% YoY (year-over-year) to nearly 6,900 units, compared with 5,900 units in the week ended April 30, 2016. Since the beginning of […]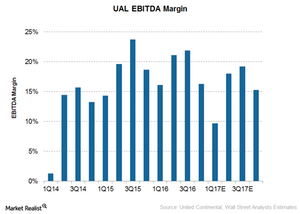
Can United Continental Improve Margins in 2017?
For 1Q17, analysts are now expecting United Continental’s (UAL) EBITDA to fall 39% to $0.81 billion.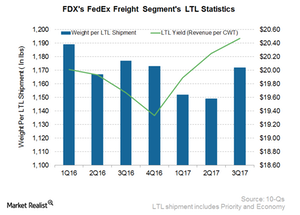
Better LTL Pricing Drove FedEx’s 3Q17 Freight Revenue
The FedEx Freight segment revenues rose 3.1% from $1.4 billion in 3Q16 to $1.5 billion in fiscal 3Q17.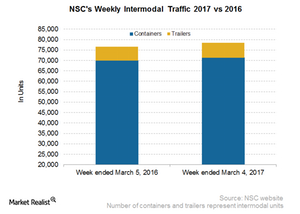
How Norfolk Southern’s Intermodal Volumes Compare to Peers
Norfolk Southern’s (NSC) total intermodal traffic rose 2.7% in the week ended March 4, 2017.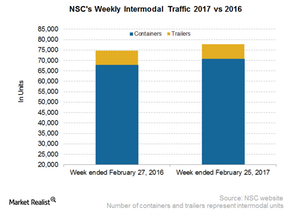
Behind Norfolk Southern’s Intermodal Volumes in the 8th Week
NSC’s total intermodal traffic rose 4.3% in the week ended February 25, 2017, reaching ~78,000 containers and trailers.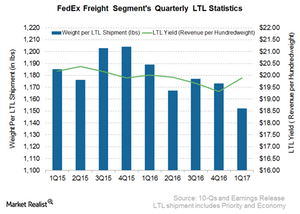
Why FedEx Sees Volume Growth in the Future of Its Freight Segment
FedEx’s (FDX) Freight segment revenues rose 4% from $1.6 billion in fiscal 1Q16 to ~$1.7 billion in fiscal 1Q17.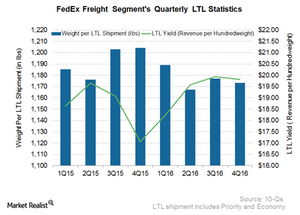
FedEx Freight: Higher Demand from Large Customers
FedEx expects FedEx Freight revenues to rise in fiscal 2017.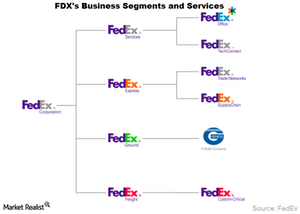
What Is FedEx’s Business Model?
FedEx provides a portfolio of transportation, e-commerce, and business services through wholly owned subsidiaries.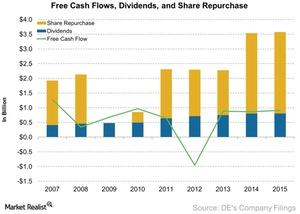
Analyzing Deere’s Free Cash Flow Growth and Cash Management
One of the ways to calculate free cash flows is by deducting capital expenditures from the company’s operating cash flows.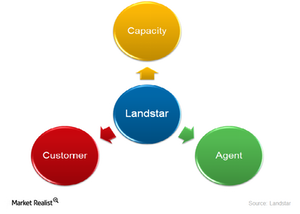
A look at Landstar’s business model
Landstar’s success is highly dependent on high revenue-generating sales reps, as well as on the volume increases by BCOs and customers.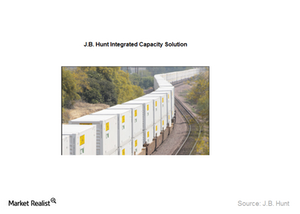
J.B. Hunt’s Integrated Capacity Solutions segment
J.B. Hunt’s (JBHT) Integrated Capacity Solutions segment provides non-asset, asset-light, traditional freight brokerage and transportation logistics solutions to customers.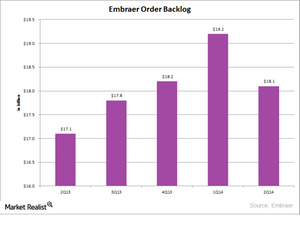
What makes Embraer successful?
In order to find out what makes Embraer successful, we need to look at its major strengths and what the company has done right.