
Rajiv Nanjapla
Rajiv Nanjapla started working at Market Realist in 2015, covering the restaurant, home improvement, tobacco, and cannabis sectors. He has over seven years of experience in analyzing financial statements and writing financial research reports.
He also holds a post-graduate diploma in finance and operations. Prior to joining Market Realist, Rajiv worked with two other companies in various capacities.
Disclosure: I am in full compliance with all ethics and other policies for Market Realist research analysts. I am not invested in securities that I cover on Market Realist.
More From Rajiv Nanjapla
The Word on the Street: How Analysts See JACK
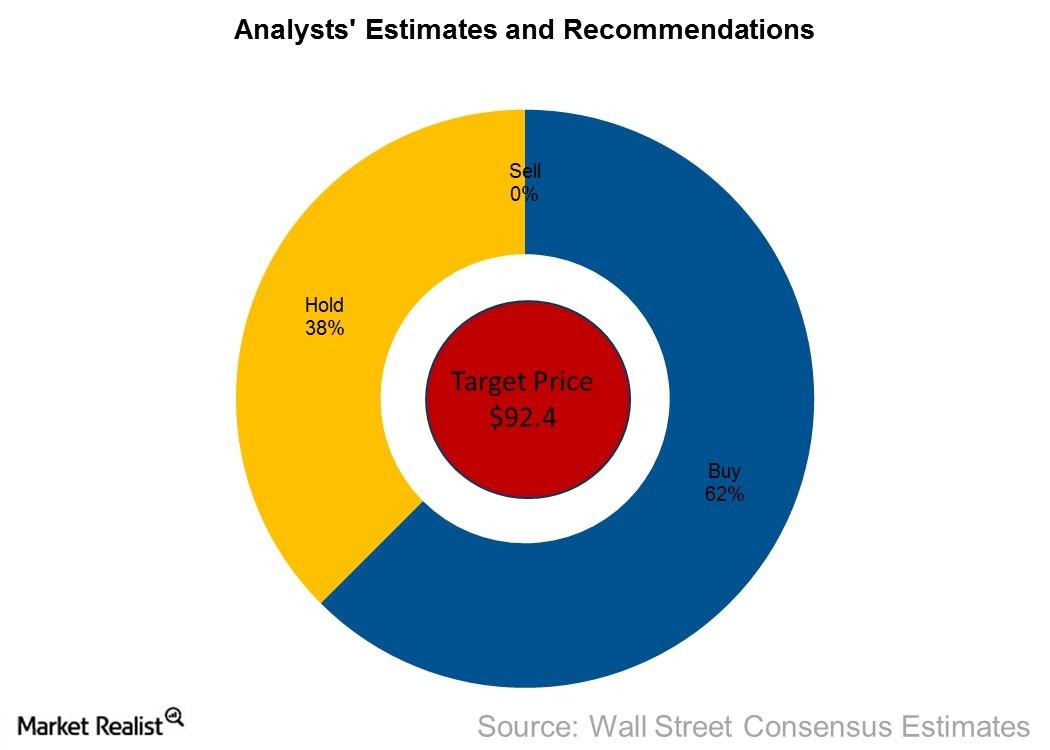
According to a Bloomberg survey of 16 analysts, 62.5% have given “buy” recommendations for JACK, and 37.5% have given “hold” recommendations.
Darden Restaurants Updates Guidance after Fiscal 4Q16 Earnings
After fiscal 4Q16 results, Darden Restaurants’ (DRI) management has revised its same-store sales growth guidance for fiscal 2017 to the range of 1%–2% as compared to earlier estimates of 1%–3%.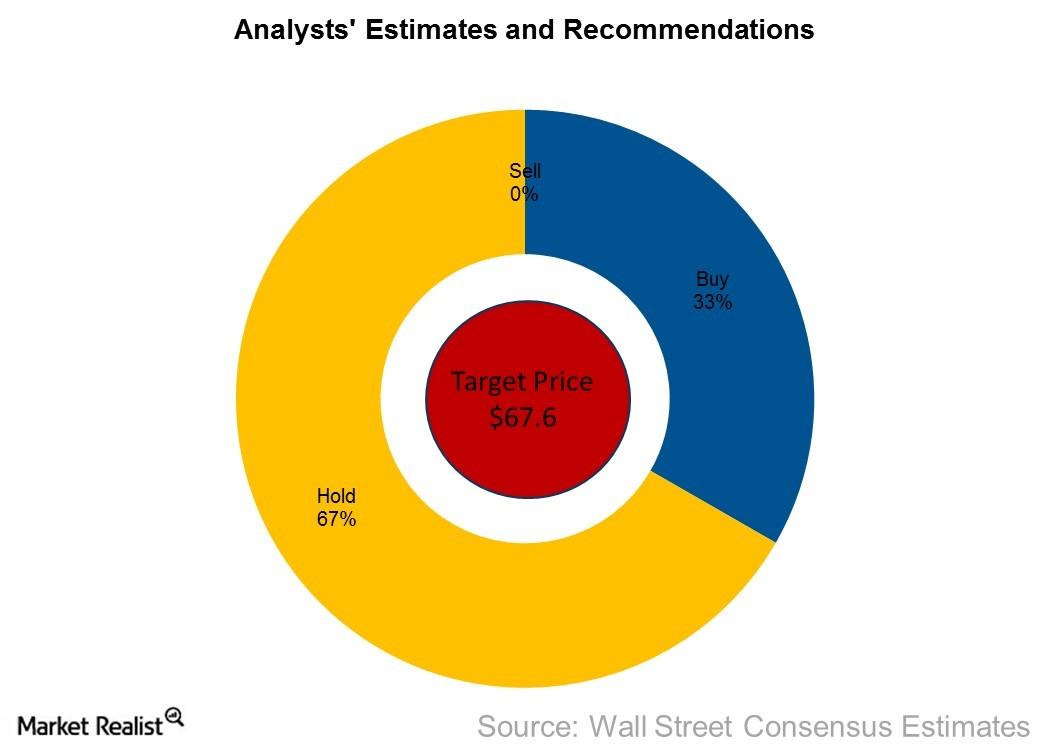
The Word on the Street: How Analysts See Papa John’s
Analysts are maintaining a price target of $67.6 for Papa John’s for the next 12-months, which represents a return potential of 2.5% for the company.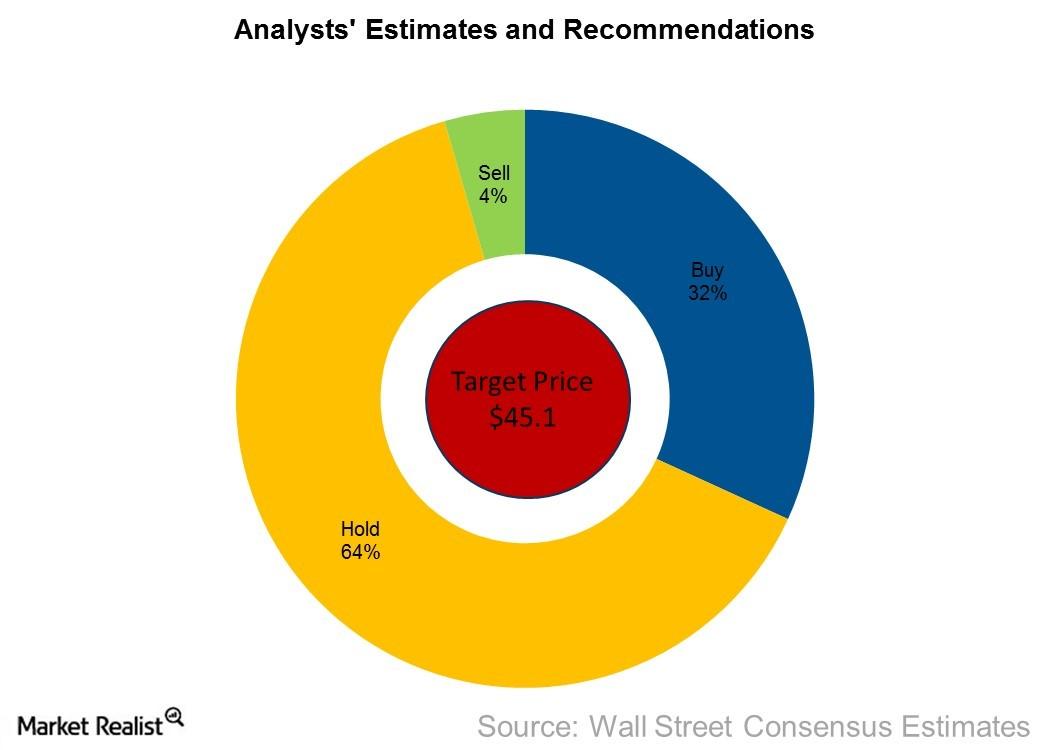
What Do Analysts Recommend for Texas Roadhouse?
The rise in EPS estimates for the next four quarters has prompted analysts to increase their price target for TXRH for the next 12 months to $45.1 from their earlier estimate of $44.8.
Why Domino’s Outperformed Other Fast-Food and Pizza Companies in Same-Store Sales Growth in 1Q16
SSSG is an important metric for investors to monitor because it increases a fast-food company’s revenue without increasing capital investment.
Getting to Know The Cheesecake Factory’s Management
A company is greatly impacted by its management’s decisions. In this article, we’ll discuss The Cheesecake Factory’s (CAKE) management and its achievements.
What Is The Cheesecake Factory’s Marketing Strategy?
The Cheesecake Factory (CAKE) is competing in a highly competitive restaurant business, where innovation is absolutely necessary to keep up.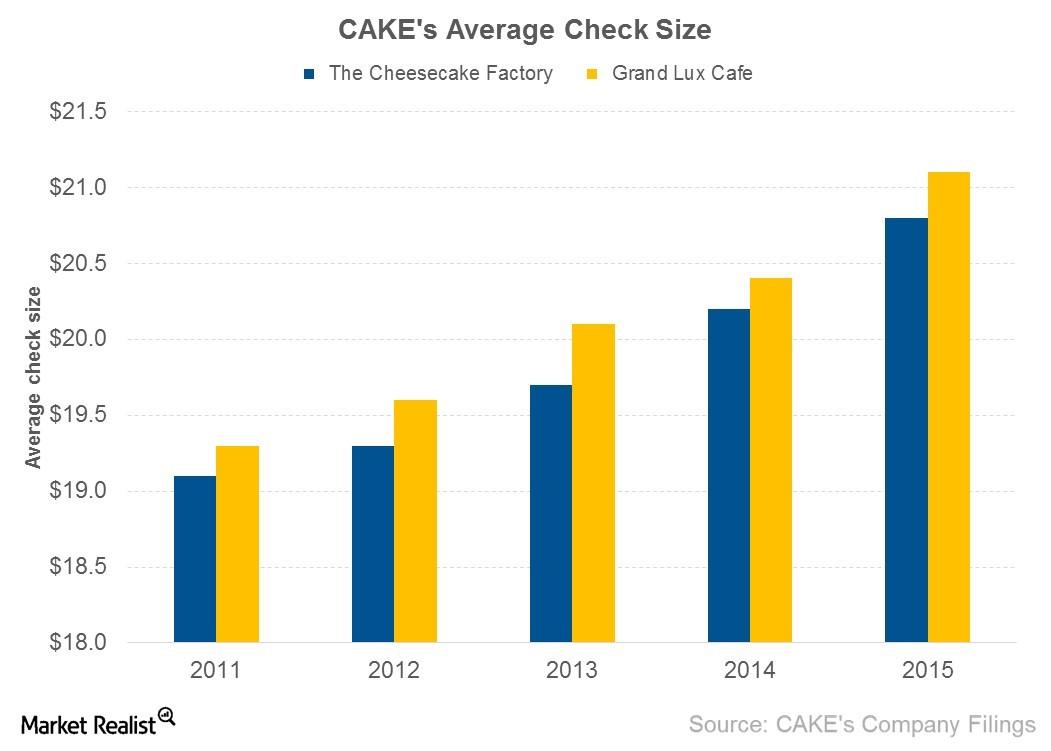
CAKE’s Average Check Has Increased Year-over-Year
In 1992, when CAKE was listed, its average check size was at $13.6. By the end of 2015, the company’s average check size had increased to $20.8.
What’s Been the Main Driver of CAKE’s Same-Store Sales Growth?
In the last five years, The Cheesecake Factory’s (CAKE) same-store sales growth was in the range of 1%–3%, largely driven by rises in its menu prices.
What’s Driving The Cheesecake Factory’s Revenue Growth?
The Cheesecake Factory earns its revenue from its company-owned restaurant sales, franchisee fees and royalties, and its bakery operations.
Exploring The Cheesecake Factory’s Other Brands
The Cheesecake Factory (CAKE) created the Grand Lux Cafe brand at the request of Venetian Resort Hotel Casino in Las Vegas in 1999.
The Cheesecake Factory Is Not Just about Desserts
The Cheesecake Factory has positioned itself as an upscale casual dining concept that focuses on providing a distinctive, high-quality dining experience.
How Did The Cheesecake Factory Expand after Going Public?
In February 1992, The Cheesecake Factory (CAKE) went public by offering 2.3 million shares at $20 per share. It closed its opening day at $27.3 per share.
A Must-Know Guide to The Cheesecake Factory
The Cheesecake Factory (CAKE) is a casual restaurant chain that was founded in 1978. The California-based company owns and operates 201 restaurants.
How Did The Cheesecake Factory Come to Exist?
The origin of The Cheesecake Factory dates back to the 1940s, when Evelyn Overton found a recipe in a local newspaper that inspired her original cheesecake.
What Really Drove Shake Shack’s Revenue in 1Q16?
In 1Q16, Shake Shack saw a 43.3% rise in revenue over $37.8 million in 1Q15, driven by unit growth and same-store sales growth.
Why Did Wendy’s Revenue Fall in 1Q16?
Wendy’s Company (WEN) generates its revenue through company-owned restaurant sales, franchisee fees, rental income, and royalty collected from franchisees.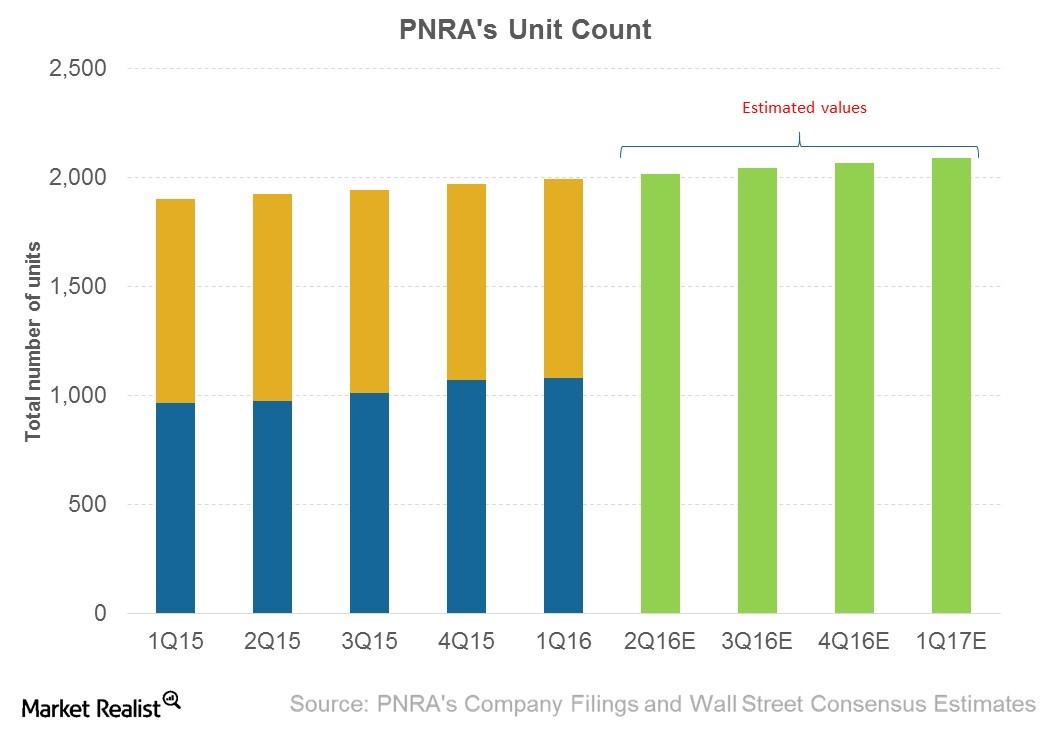
How Is Panera Bread Expanding Its Business?
From the beginning of 2Q15 to the end of 1Q16, Panera Bread (PNRA) increased its unit count by 96, of which 25 units were added in 1Q16.
What’s Really Driving Buffalo Wild Wings’ Revenues?
From 2011 to 2015, Buffalo Wild Wings’ (BWLD) revenues increased from $784 million to $1.8 billion—a rise of over 131%.
Understanding Buffalo Wild Wings’ Stadia Design
In July 2013, Buffalo Wild Wings developed a guest experience approach that uses a “captain” to help customers to access all entertainment options.
Inside Buffalo Wild Wings’ Marketing Strategies
Buffalo Wild Wings is competing in the highly competitive restaurant business, wherein innovation is a must to keep up with the changing needs of customers.
What You Should Know about Buffalo Wild Wings
Buffalo Wild Wings is a casual dining restaurant and sports bar headquartered in Minneapolis. Founded in 1982, the company is also known as BW3.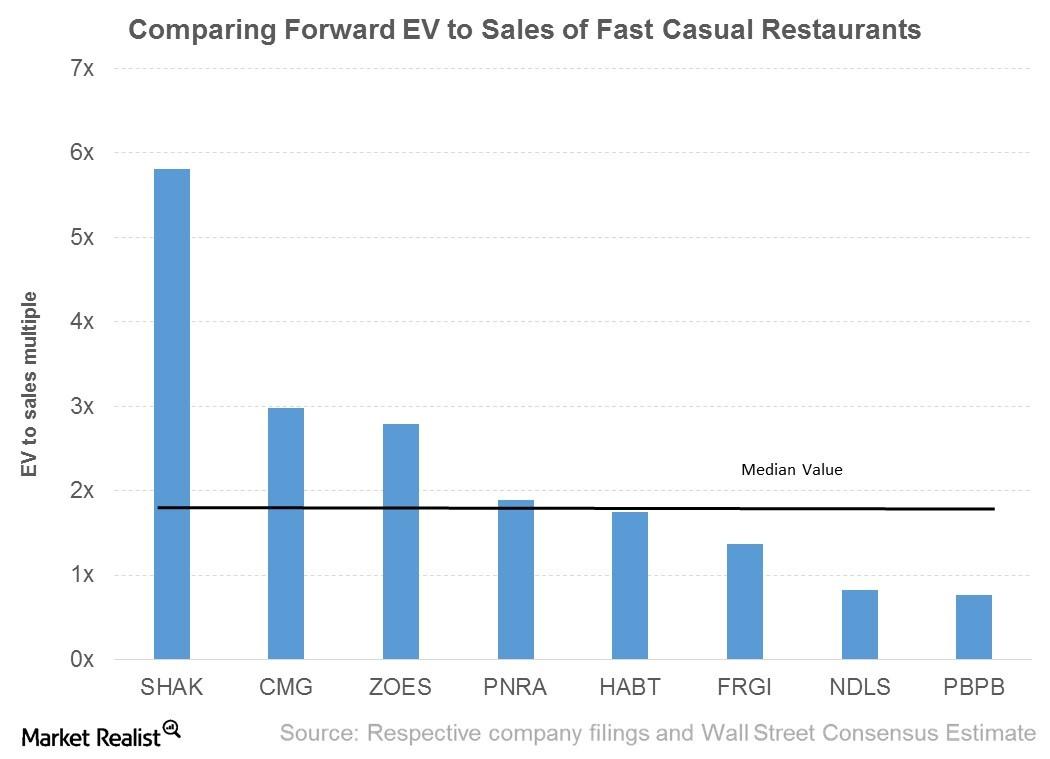
Comparing the Valuation Multiples of Fast Casual Restaurants
A company’s valuation multiple is affected by its perceived growth, risks and uncertainties, and investors’ willingness to pay.
Which Fast Food Restaurant Led in 4Q15 Revenue Per Square Foot?
In 4Q15, MCD, YUM, WEN, QSR, JACK, SONC, PZZA, and DPZ generated an average revenue of $189 per square foot.
What Contributed to Domino’s Pizza’s Revenue Expansion in 4Q15?
In 4Q15, Domino’s Pizza (DPZ) recorded an overall revenue growth of $98.2 million from its 4Q14 revenues of $643 million.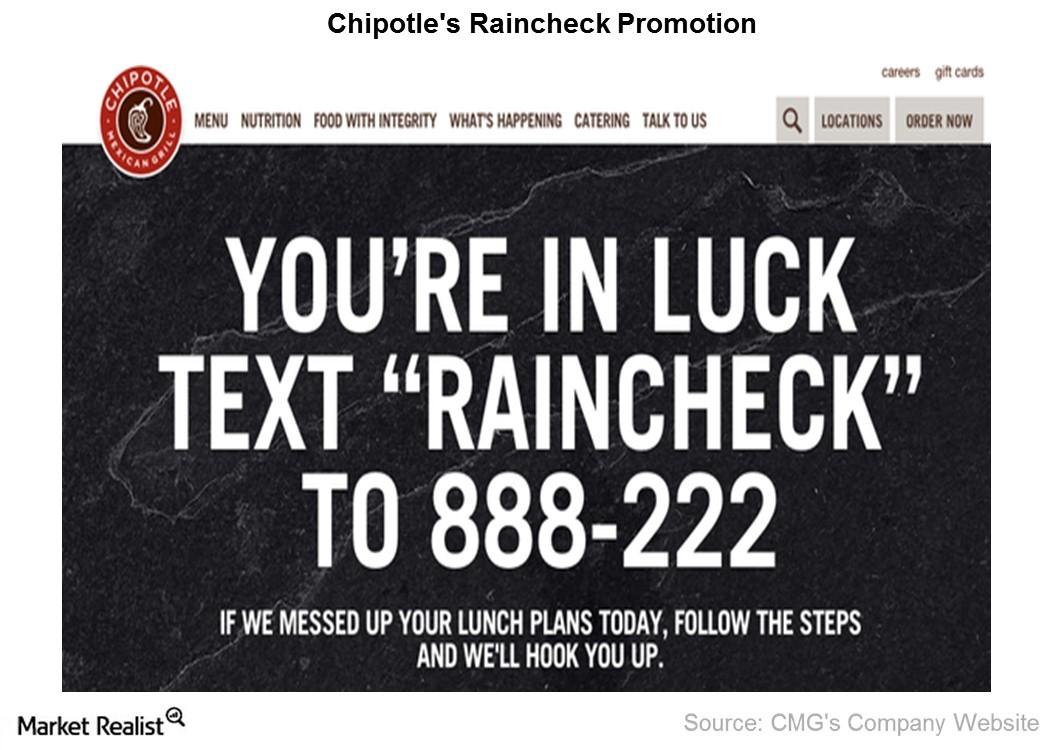
Chipotle is Spending Big on Its Marketing and Promotional Programs
In addition to its marketing and promotional efforts, Chipotle Mexican Grill (CMG) launched a food safety website on February 8, 2016, which outlines the company’s enhanced food safety procedures.
Unit Growth and Dunkin’ K-Cup Sales Drove 4Q15 Revenue Growth
Dunkin’ Brands (DNKN) earns its revenue from five different channels: Dunkin’ Donuts US, Dunkin’ Donuts International, Baskin-Robbins US, Baskin-Robbins International, and others.
Chipotle Same-Store Sales Growth Was -14.6%: Blame It on the Food
Chipotle Mexican Grill (CMG) recorded overall same-store sales growth of -14.6% for 4Q15. It was -16% in November and -30% in December, according to the company.
Analyzing Jack in the Box’s Marketing Strategies
Jack in the Box (JACK) manages marketing funds that include contributions from both its franchise and company-owned restaurants.
Jack in the Box: Improving Efficiency through Technology
To speed up service, Jack in the Box (JACK) used a two-way intercom when it opened its first restaurant in 1951.
Understanding Qdoba Mexican Eats’ Franchisee Model
Since Jack in the Box’s acquisition of brand Qdoba Mexican Grill, now named Qdoba Mexican Eats, the brand has grown from a mere 85 restaurants to 661.
A Look at Qdoba Mexican Eats’ Business Model
In 2003, when Jack in the Box (JACK) acquired Qdoba Mexican Grill for $45 million, Qdoba was operating 85 outlets with a total revenue of $65 million.
Jack in the Box: The Food Is Better at the Box
Headquartered in San Diego, California, Jack in the Box (JACK), was founded by Robert O. Peterson in 1951.
Why Papa John’s Leads the Pack in Technology Implementation
Papa John’s was first to introduce online ordering at all of its US delivery restaurants in 2001 as well as first to introduce SMS text ordering in 2007.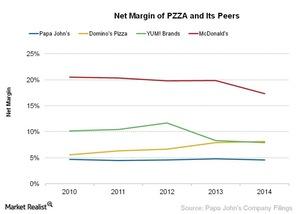
Comparing Papa John’s Net Margins with Other Quick-Service Big Guns
In 2014, Papa John’s net profits as a percentage of total sales decreased by 0.2% due to increases in interest levels.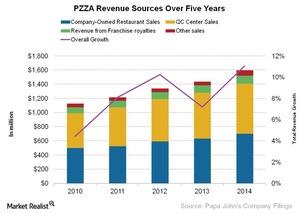
Papa John’s Franchising and Quality Centers—the Foremost Piece of Company Pie
To maintain the quality and consistency of products, Papa John’s has QC (quality control) centers that supply ingredients to its restaurants.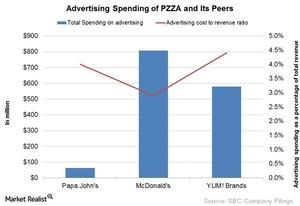
Papa John’s Marketing and Promotional Strategies: What’s in the Oven?
In 2014, Papa John’s spent $63 million, or 4% of its total revenues, on advertising, whereas McDonald’s spent $808 million, or 2.9% of its total revenues.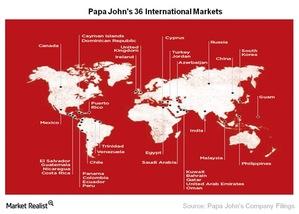
Sizing up the International Reach of Papa John’s Pizza
In 1998, Papa John’s decided to venture outside the US by opening outlets in Mexico and Puerto Rico. In 1999, it acquired the UK’s Perfect Pizza Holdings.
