
Rabindra Samanta
I have been working at Market Realist since August 2015. My primary area of expertise includes qualitative and quantitative analysis of crude oil and the natural gas market. This focus also includes tracking macroeconomic indicators. But, later into my career, I also started covering global markets, hedge fund manager commentary, and other macro developments.
I completed the PGDBM degree in 2014. Prior to Market Realist, I worked with one of India's largest brokerage house, Kotak Securities. My primary responsibilities include market analysis, portfolio advisory, and investor presentations.
After my graduate degree, I worked as an Associate at Vedanta Resources CPP (captive power plant) and IPP (Independent Power plant) project at Jharsuguda Odisha.
Disclosure: I am in full compliance with all ethics and other policies for Market Realist research analysts. I am not invested in securities that I cover on Market Realist.
More From Rabindra Samanta

Can US Crude Oil Break Below $57 Next Week?
On December 14, 2017, the implied volatility of US crude oil futures was 18.1%. It was 14.8% below its 15-day average.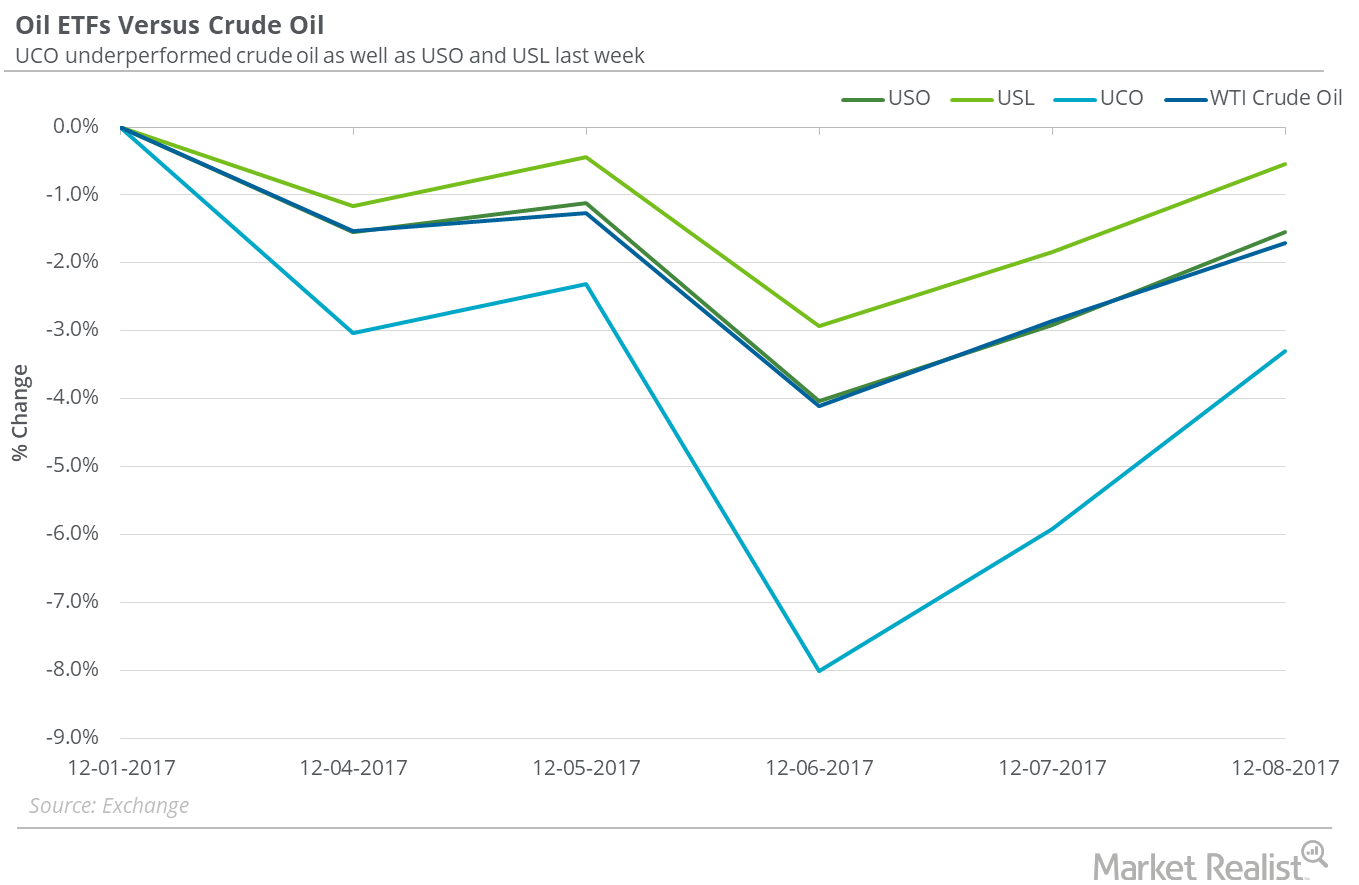
Oil ETFs That Outperformed US Crude Oil Last Week
On December 1–8, 2017, the United States Oil Fund (USO), which holds crude US oil futures contracts, fell 1.5%. US crude oil January 2018 futures fell 1.7%.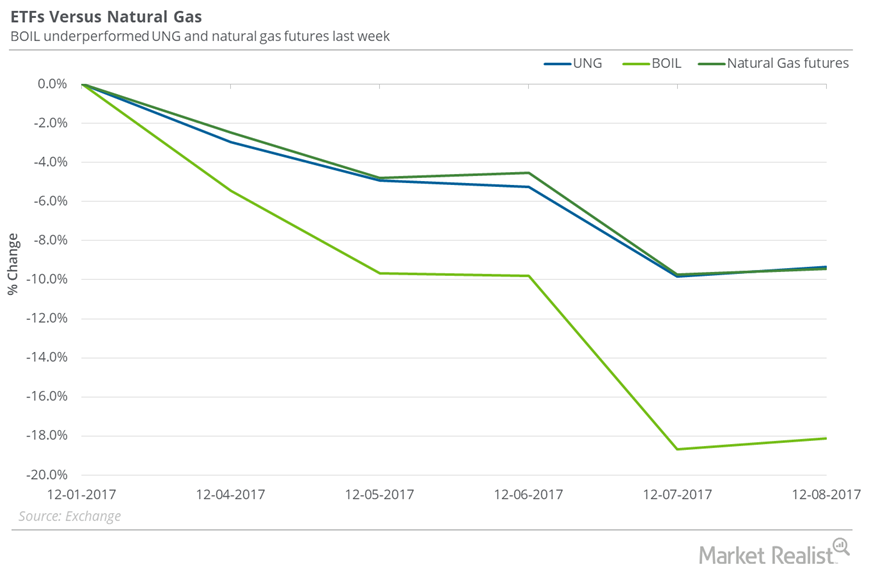
Natural Gas: Fall Impacts Natural Gas ETFs
On December 1–8, 2017, the United States Natural Gas Fund (UNG), which holds near-month natural gas futures contracts, fell 9.3%.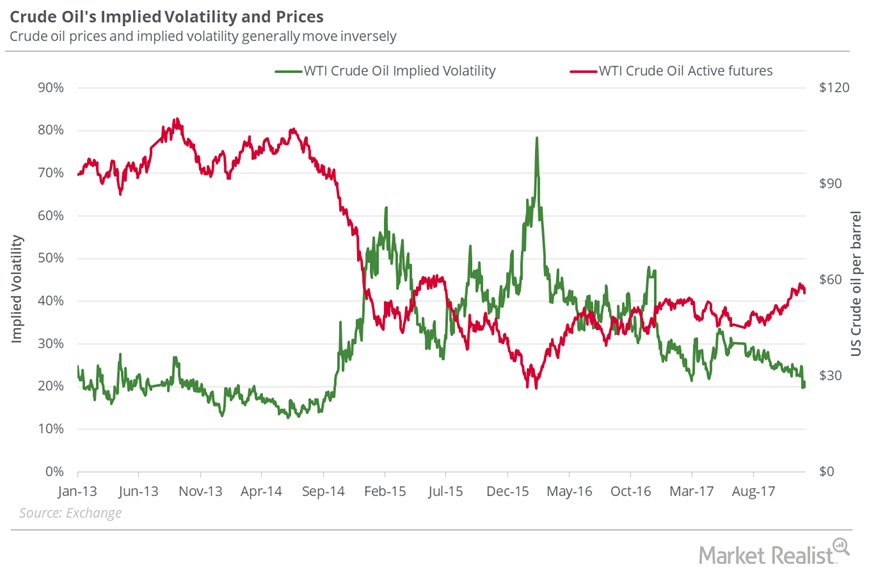
US Crude Oil Prices Could Remain below $58 Next Week
On December 7, 2017, US crude oil’s implied volatility was 20% or ~1.1% less than its 15-day average. On December 1, the implied volatility fell to 19.8%.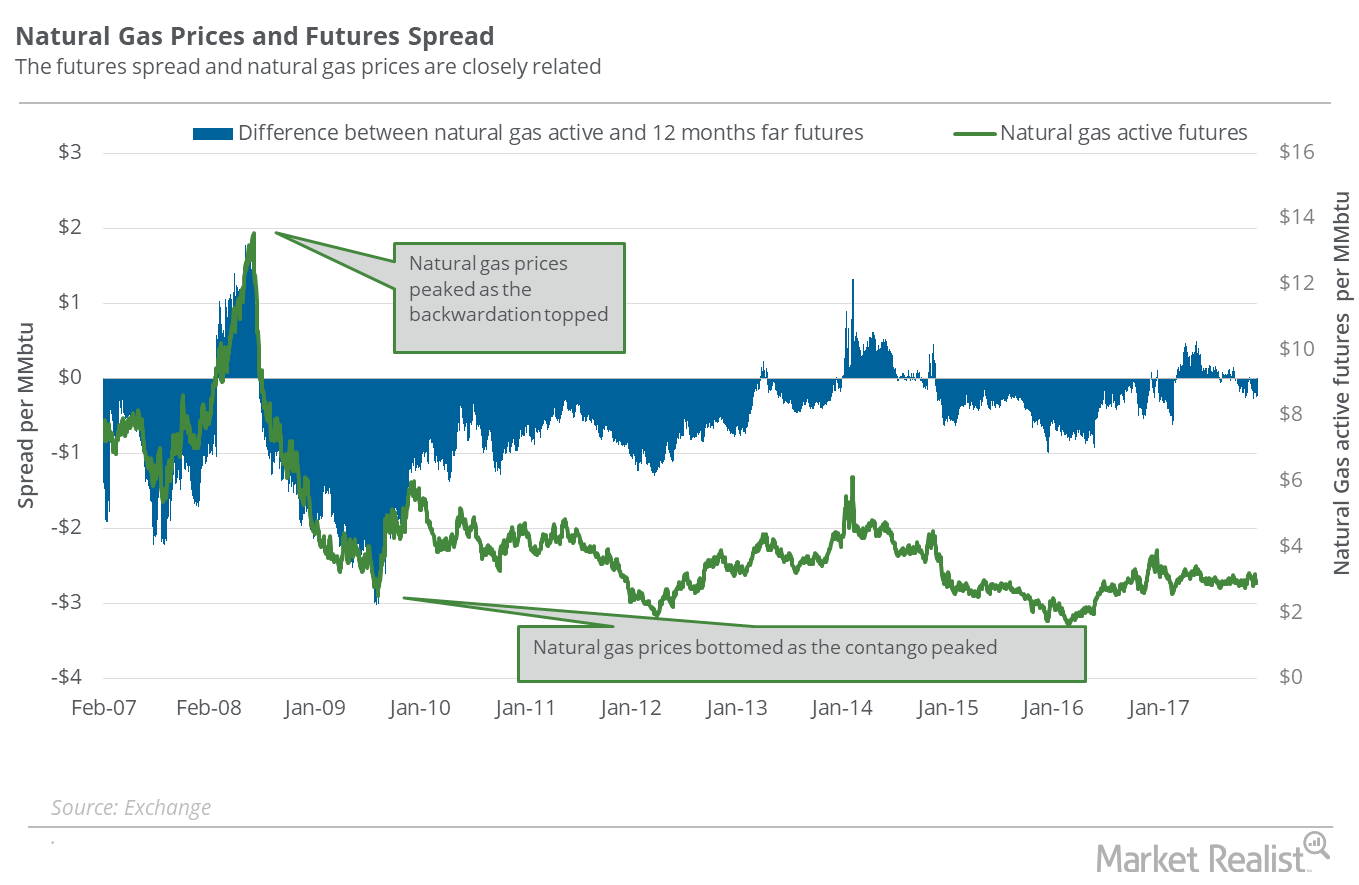
Are Natural Gas Supply Fears Rising?
On December 6, natural gas (UNG)(BOIL) January 2018 futures traded at a discount of ~$0.24 to January 2019 futures. This price difference between January 2018 futures and January 2019 futures is called the “futures spread.”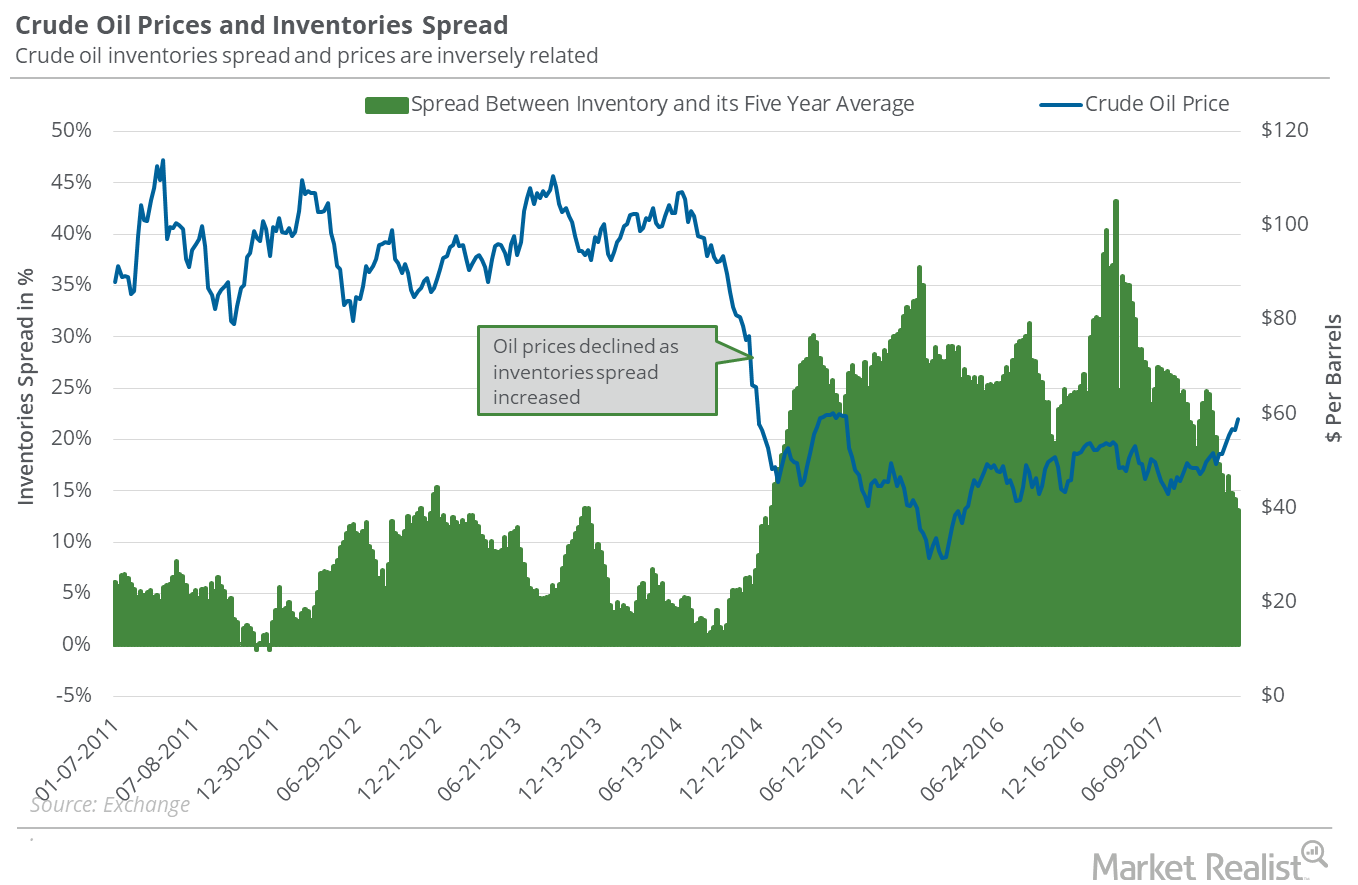
Analyzing Crude Oil Inventories and Oil Prices
In the week ending November 24, 2017, US crude oil inventories fell by 3.4 MMbbls (million barrels) to 453.7 MMbbls.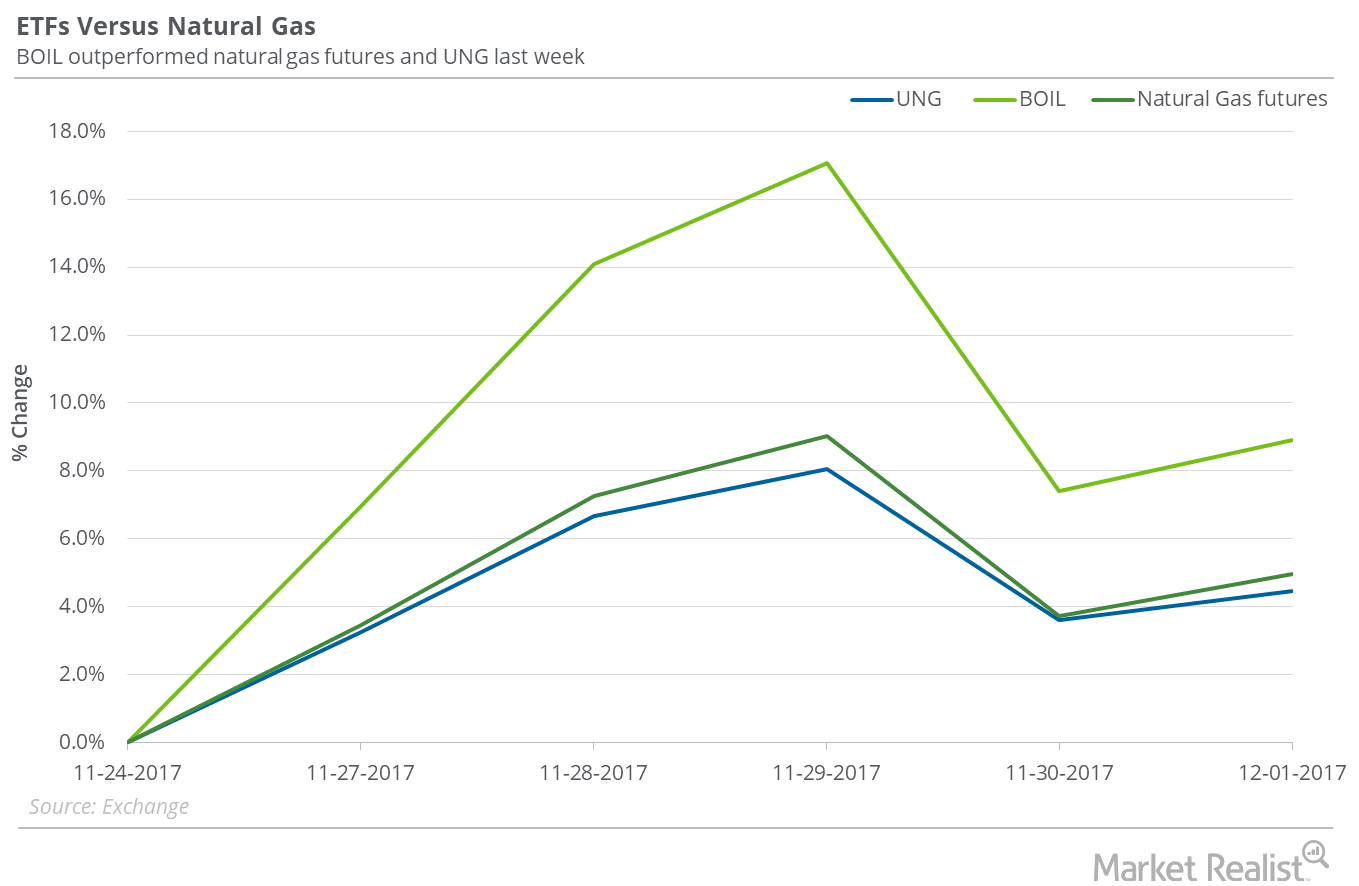
Rise in Natural Gas Impacts Natural Gas ETFs
On November 24–December 1, 2017, the United States Natural Gas Fund (UNG), that follows near-month natural gas futures contracts, rose 4.5%.
Will the Inventories Spread Impact US Crude Oil?
US commercial crude oil inventories fell by 1.9 MMbbls in the week ending November 17, 2017—0.5 MMbbls more than the market’s expected fall.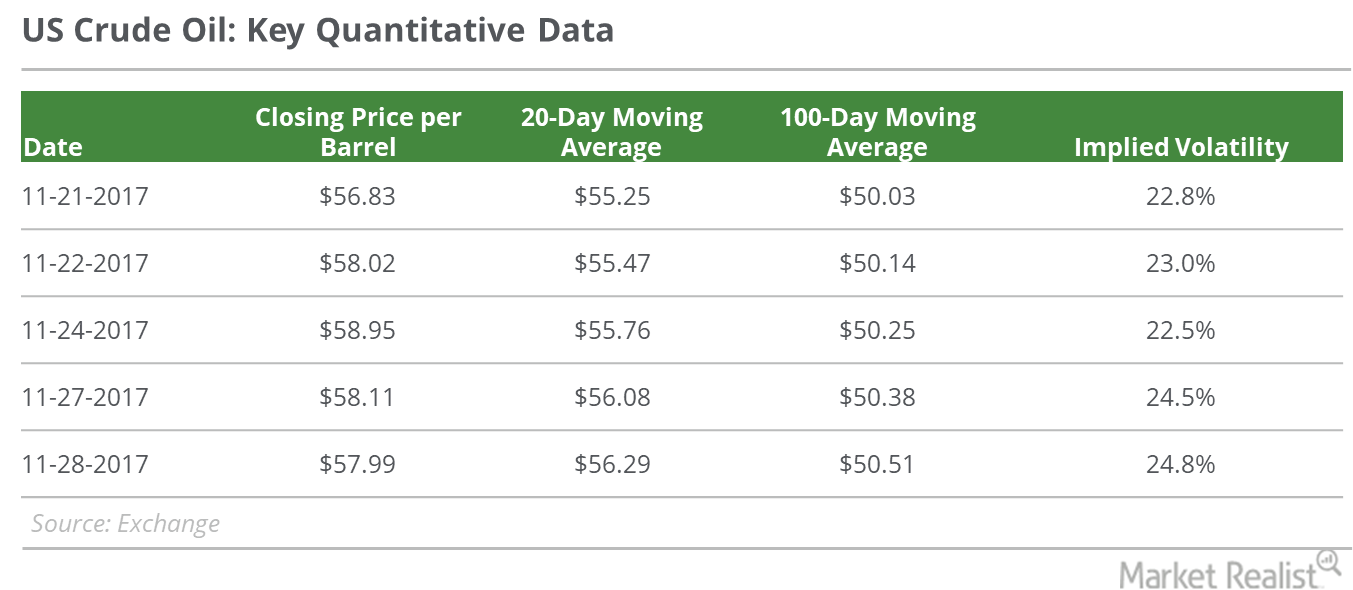
Is Oil’s Rise Coming to a Halt?
On November 28, 2017, US crude oil (USO) (USL) active futures fell 0.2% and closed at $57.99 per barrel. All eyes are on the outcome of OPEC’s meeting.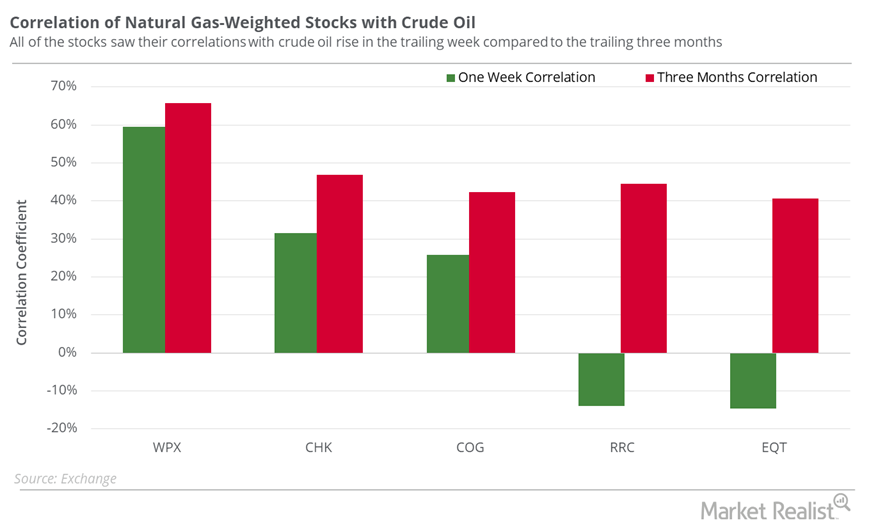
Which Natural Gas–Weighted Stocks Could Take Cues from Oil?
Antero Resources (AR) and Gulfport Energy (GPOR) are among the natural gas–weighted stocks that had the highest correlations with natural gas prices in the trailing week.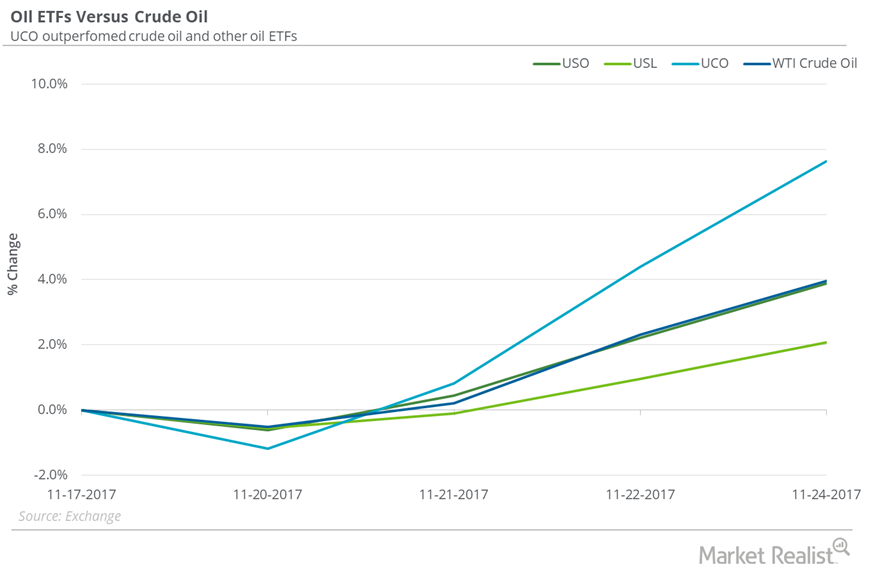
Is Oil Bullishness Boosting Oil ETFs?
Between November 17 and November 24, 2017, the United States Oil Fund LP (USO), which tracks WTI crude oil near-month futures, rose 3.9%.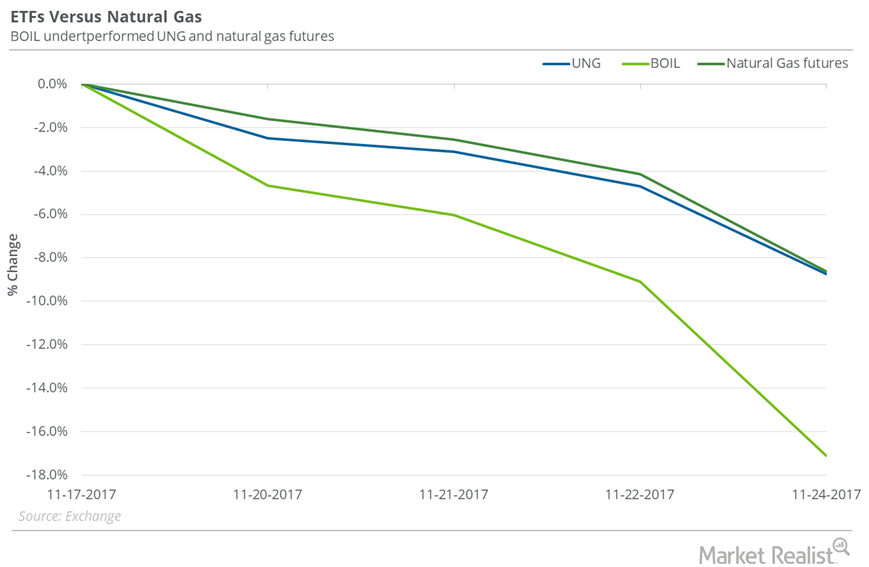
How Are Natural Gas ETFs Adjusting to Fall in Natural Gas Prices?
Between November 17 and November 24, 2017, the United States Natural Gas Fund LP (UNG) fell 8.8%.
Analyzing the Downside for Natural Gas Next Week
On November 24–30, natural gas active futures could close between $2.89 and $3.23 per MMBtu (million British thermal units) with a probability 68%.
Are Oversupply Concerns Gripping Natural Gas Prices?
On November 22, natural gas (UNG)(BOIL) January 2018 futures closed at a discount of ~$0.2 to January 2019 futures.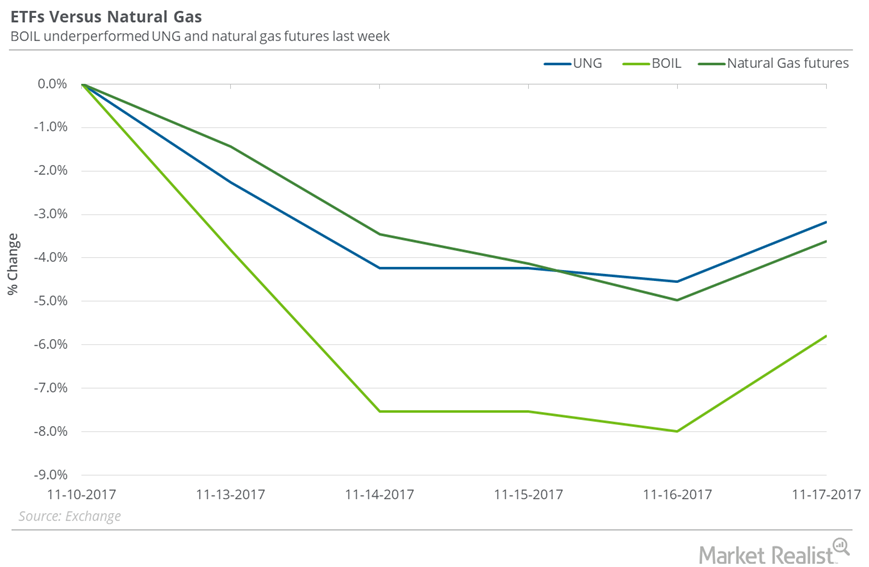
Are Natural Gas ETFs Doing Any Better than Natural Gas?
Between November 10 and November 17, the United States Natural Gas Fund LP (UNG) fell 3.2% while natural gas active futures fell 3.6%.
Natural Gas Futures Spread: Analyzing Oversupply Concerns
On November 15, 2017, natural gas (UNG) (BOIL) December 2017 futures traded at a discount of ~$0.1 to December 2018 futures.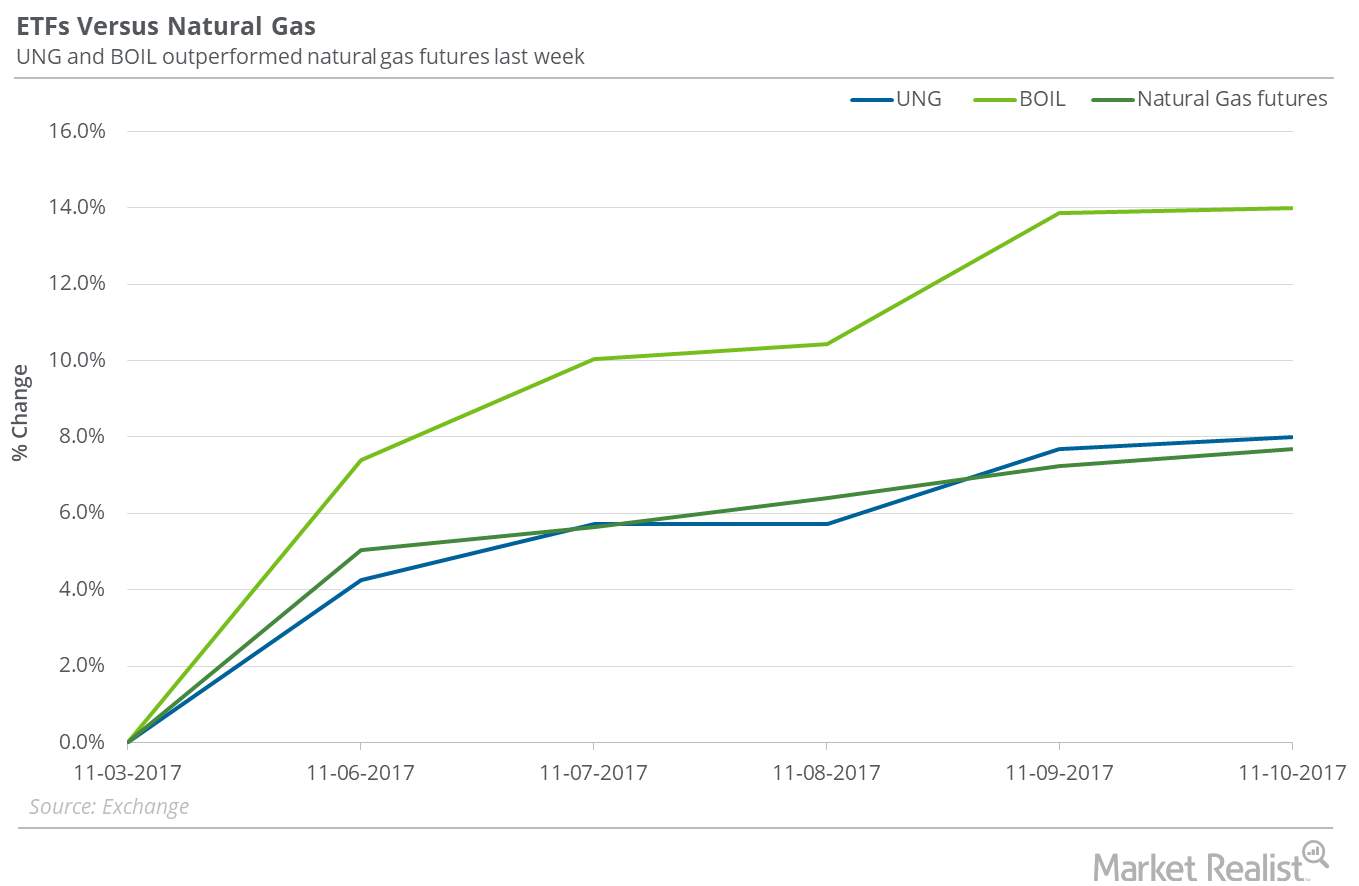
Did Natural Gas ETFs Outperform Natural Gas Last Week?
Between November 3 and November 10, 2017, the United States Natural Gas Fund LP (UNG) rose 8%, only 30 basis points above the gain in natural gas December futures.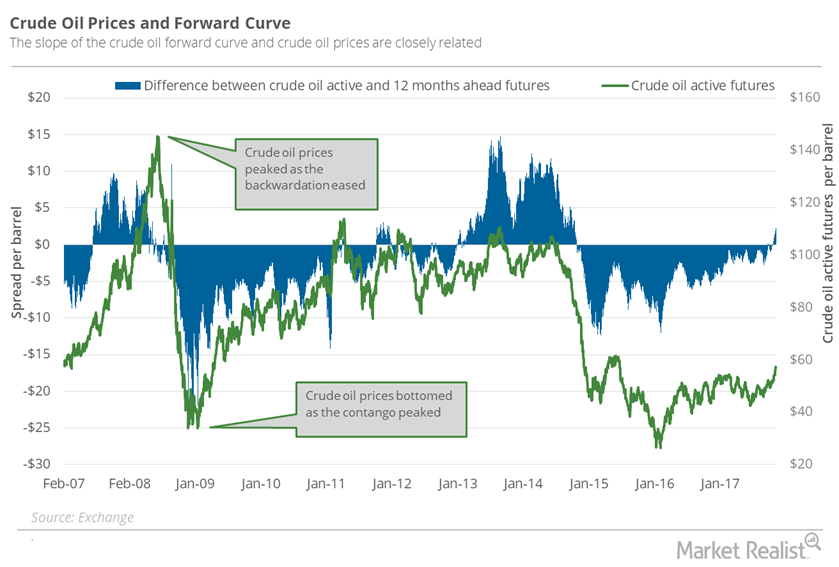
Futures Spread: Is the Oil Market Tightening?
On November 7, 2017, US crude oil (OIIL) December 2018 futures settled $2.08 below the December 2017 futures.
Understanding the Natural Gas Futures Spread: Are Oversupply Concerns Rising?
On November 1, natural gas December 2018 futures settled $0.22 above December 2017 futures. On October 25, the futures spread was at a premium of $0.11.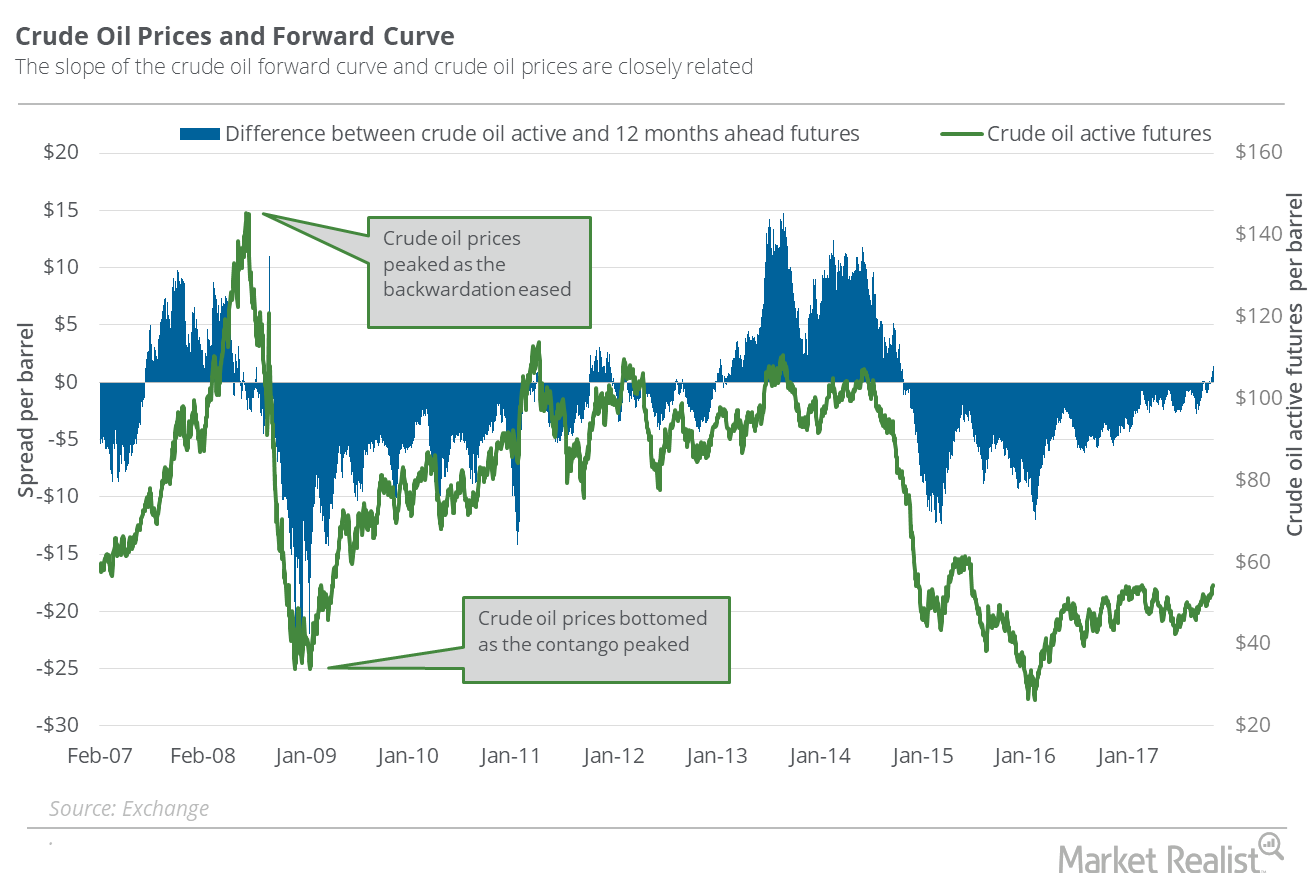
Is the Oil Market Balancing?
On October 31, 2017, US crude oil (USO) December 2018 futures settled $1.4 below December 2017 futures.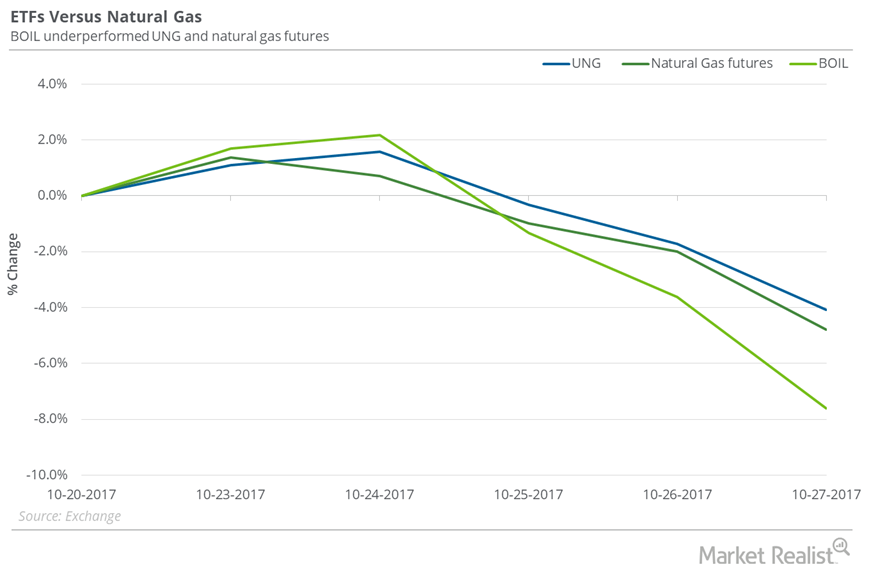
Natural Gas versus Natural Gas ETFs Last Week
On October 20–27, natural gas (FCG) (GASL) (GASX) December futures fell 4.8%. During this period, the United States Natural Gas Fund LP (UNG) fell 4.1%.
Will Natural Gas Remain above $3 Next Week?
On October 26, natural gas (UNG)(BOIL) futures’ implied volatility was at 38.3%—3.4% above the 15-day average.
Understanding the Natural Gas Futures Spread—And What It Means for Prices
On October 25, 2017, natural gas December 2018 futures closed $0.11 above the December 2017 futures.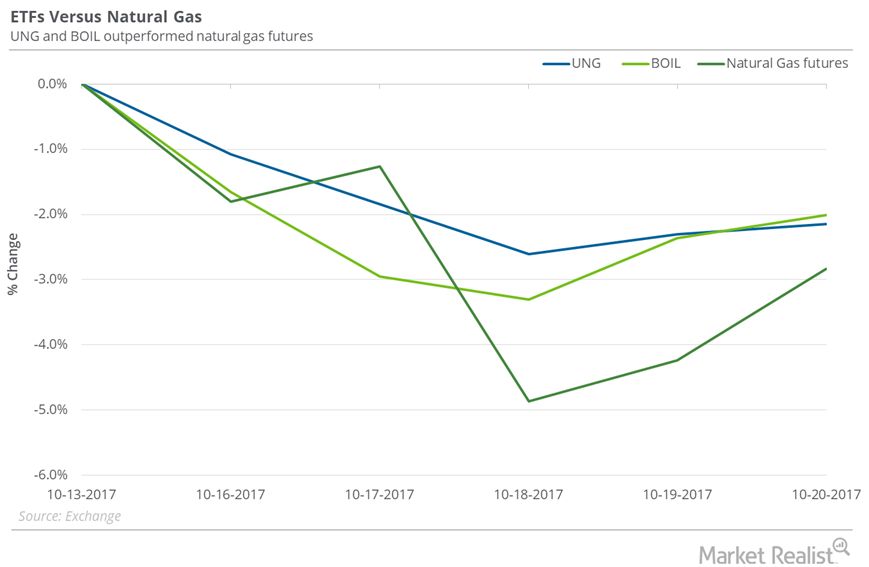
Where Natural Gas ETFs Stood next to Natural Gas Last Week
Between October 13 and October 20, 2017, the United States Natural Gas Fund LP (UNG) fell 2.2%, and natural gas November futures fell 2.8%.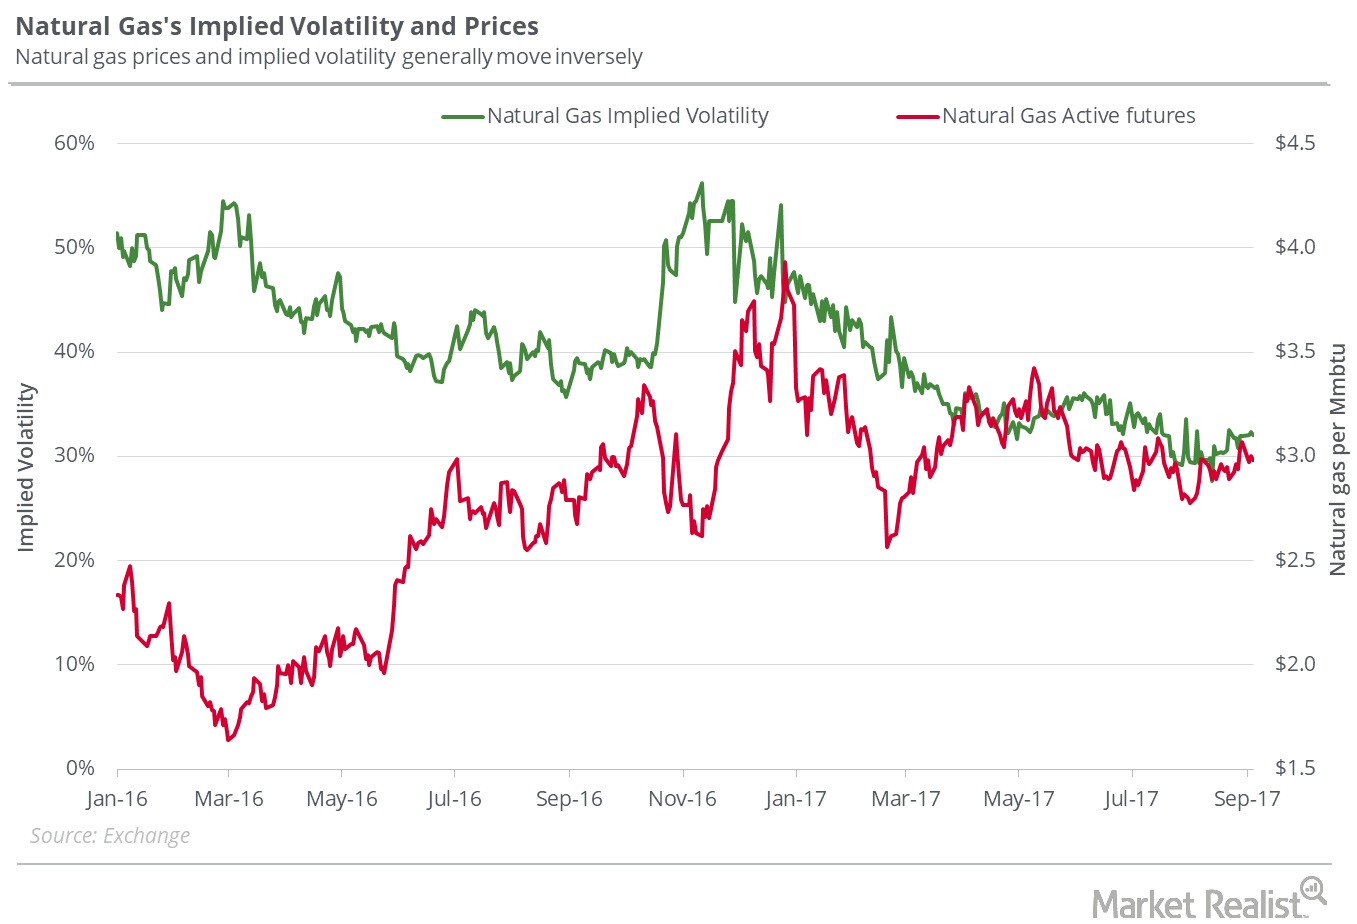
Will Natural Gas Fall to $2.7 Levels Next Week?
On October 19, 2017, natural gas futures’ implied volatility was 38.8%, 9.6% above its 15-day average.
Reading the Natural Gas Futures Spread: Rising Oversupply Concerns
On October 11, 2017, the futures spread was at a premium of $0.13. Between then and October 18, natural gas November futures fell 1.2%.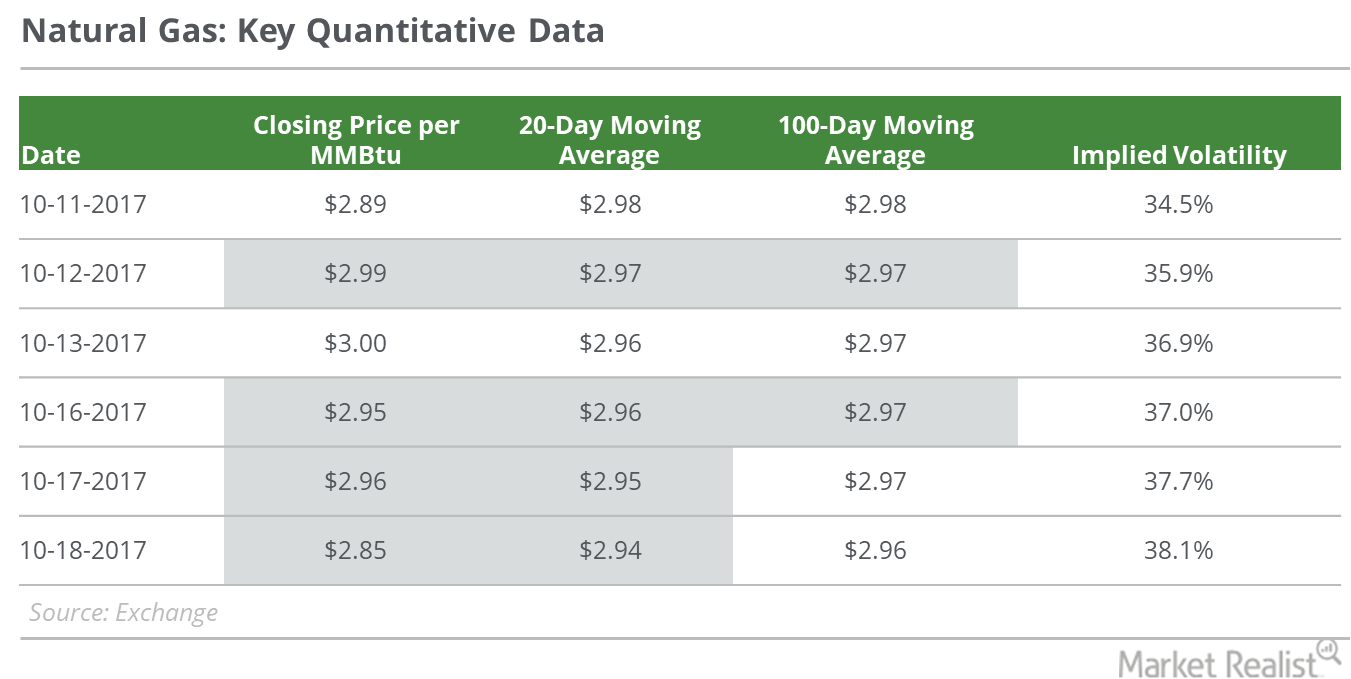
The Smell of Natural Gas: Ripe for a Pullback?
On October 18, natural gas November futures closed at $2.85 per MMBtu (million British thermal units)—3.6% below the last trading session’s closing price.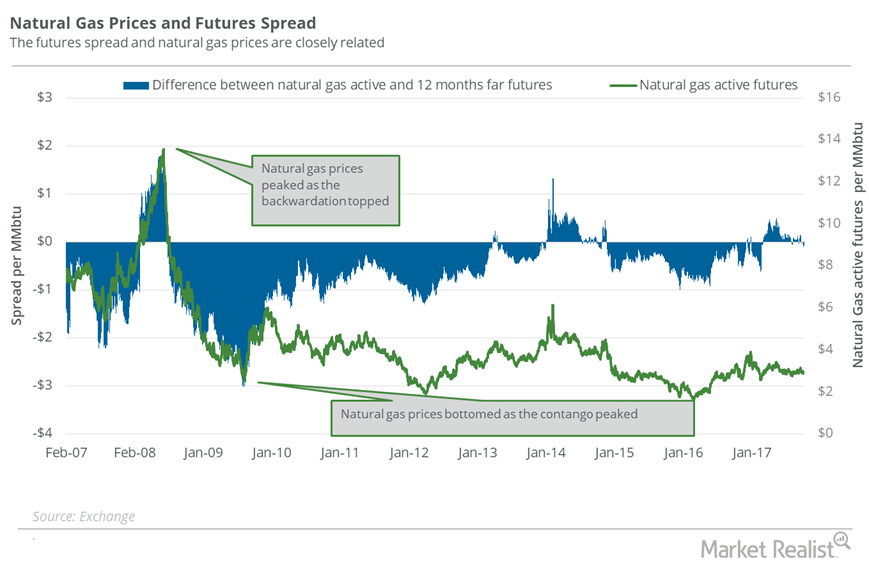
Why the Natural Gas Futures Spread Is Concerning Markets
When the futures spread is at a premium, or the premium rises, it could hamper the rise in natural gas prices.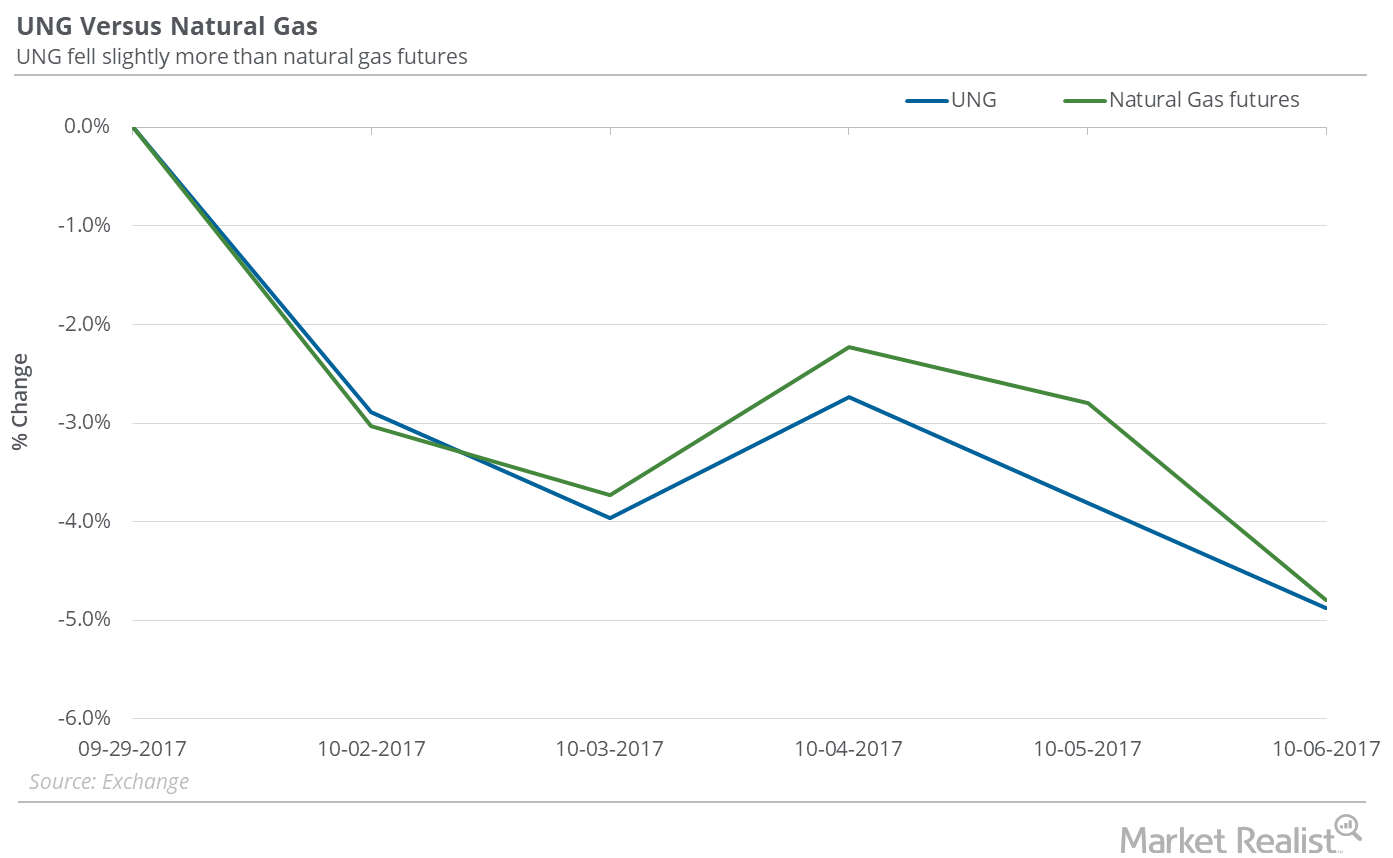
Did UNG Outperform Natural Gas in the Week Ended October 6?
Between September 29 and October 6, 2017, the United States Natural Gas Fund ETF (UNG) fell 4.9%, while natural gas (BOIL) (GASX) November futures fell 4.8%.
Could Natural Gas Fall below the $2.8 Mark Next Week?
On October 5, 2017, the implied volatility of US natural gas active futures was at 33.1%, or 7.3% below the 15-day average.
Futures Spread: A Look at Natural Gas Supply–Demand Concerns
On October 4, 2017, natural gas (UNG) (GASL) November 2018 futures traded $0.08 above the November 2017 futures.
How UNG Fared Compared to Natural Gas Last Week
On September 22–29, 2017, the United States Natural Gas Fund LP (UNG) rose 0.2%, while natural gas (BOIL) November futures fell 0.5%.
Understanding the Oil Futures’ Forward Curve
On September 26, 2017, US crude oil November 2017 futures traded just $0.14 below the November 2018 futures.
Is Natural Gas a Good Short for Bears at $3?
On September 13, natural gas October futures closed at $3.058 per MMBtu (million British thermal units). The same day, natural gas prices rose 1.9%.
Natural Gas Could Regain the $3 Mark Next Week
In the next seven days, natural gas October futures could close between $2.85 and $3.11 per MMBtu (million British thermal units).
Have Oil Supply Glut Concerns Relaxed since Harvey?
On September 5, US crude oil October 2018 futures traded at a premium of $1.94 to October 2017 futures. On August 29, the premium was at $2.37.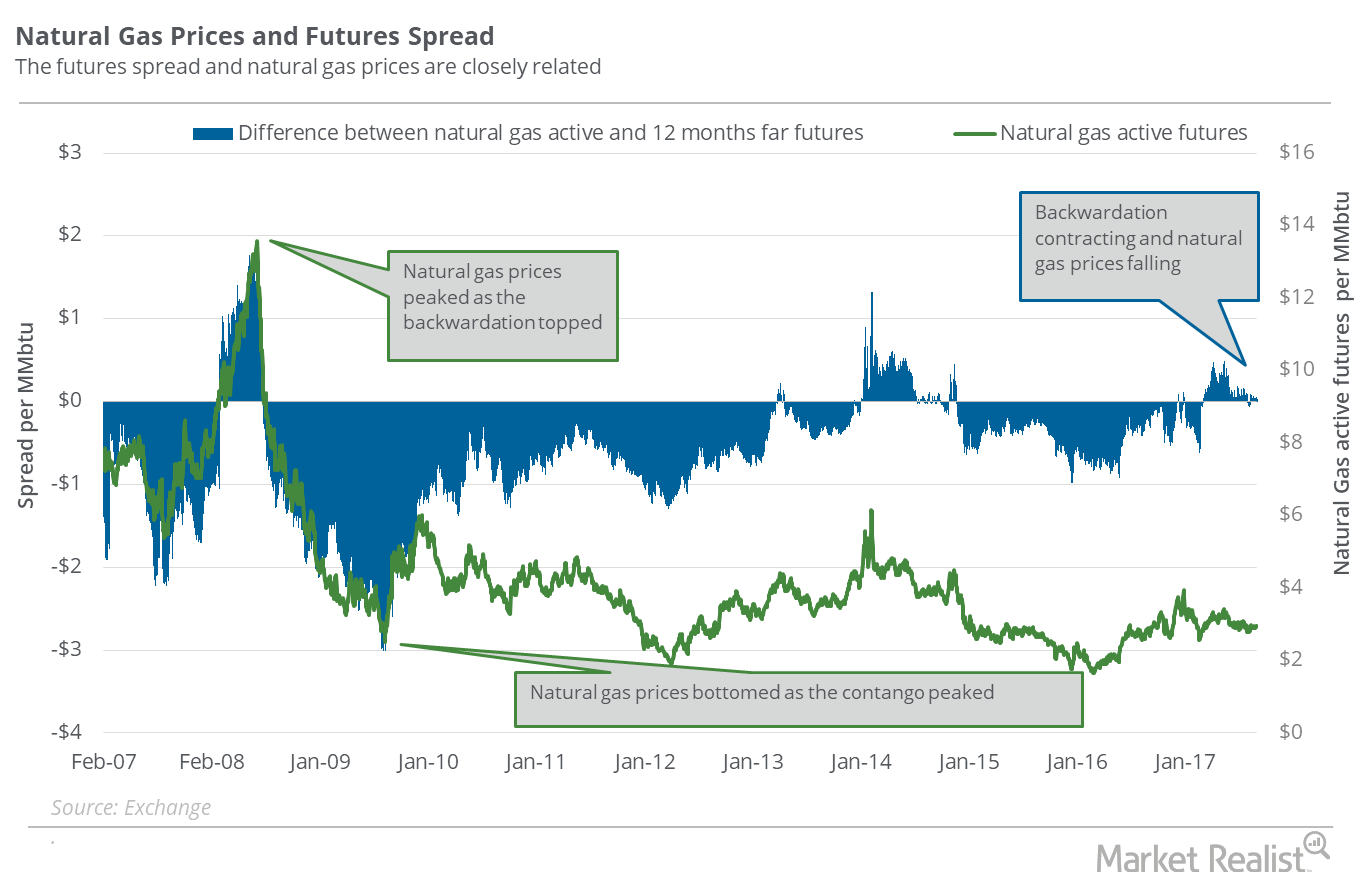
Natural Gas: Analyzing the Futures Spread
On August 30, 2017, natural gas October 2018 futures traded at a discount of ~$0.03 to October 2017 futures.
Oil’s Futures Spread: Have Supply Glut Concerns Increased?
On August 29, 2017, US crude oil (USL) October 2018 futures traded at a premium of $2.37 to October 2017 futures.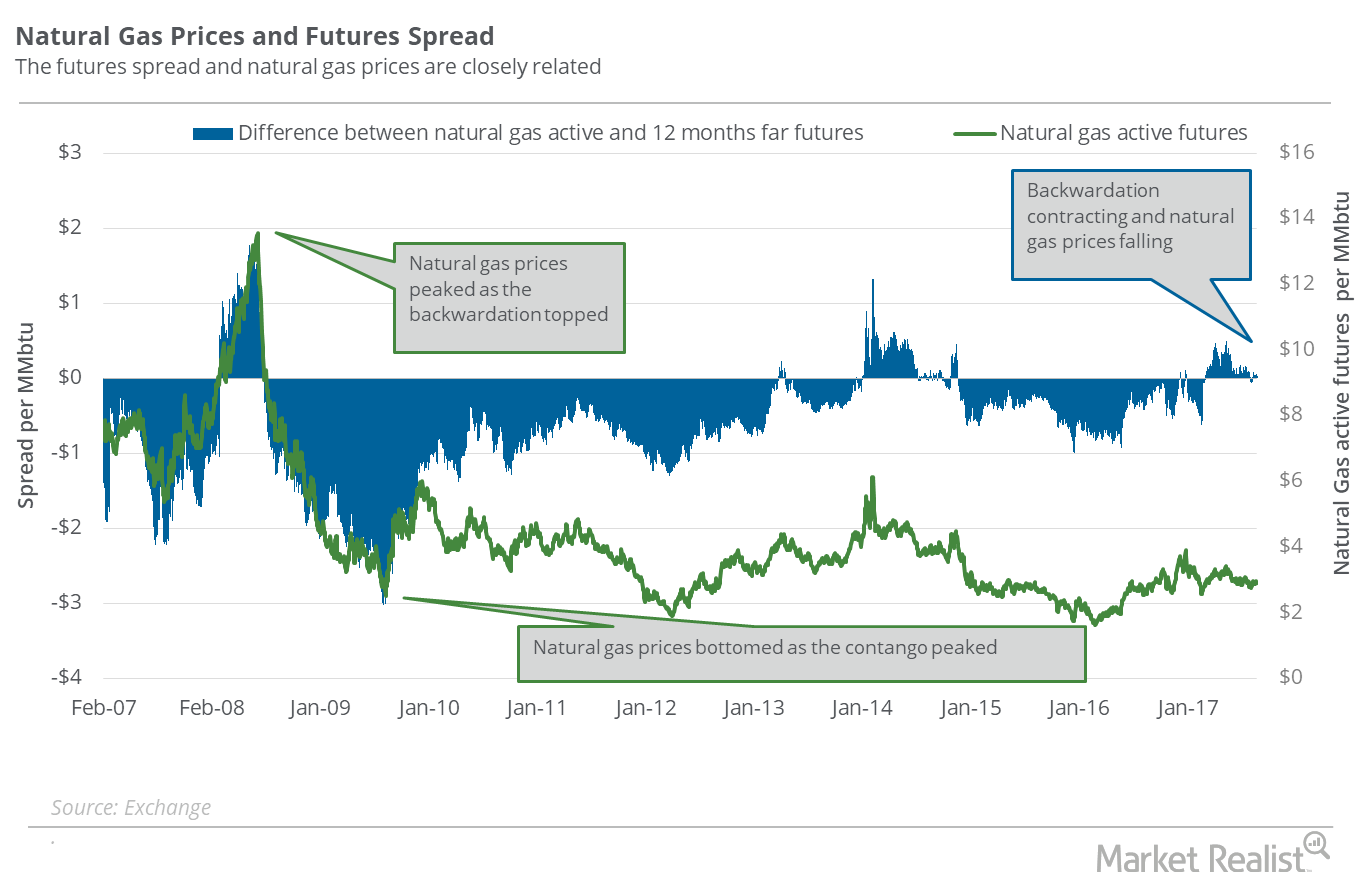
Natural Gas Futures Spread: Analyzing Supply-Glut Concerns
On August 23, 2017, natural gas September 2018 futures traded at a discount of $0.03 to September 2017 futures.
Could the Oil Rig Count Threaten Bullish Bets on Oil Prices?
The US oil rig count rose by three to 768 for the week ended August 11, 2017.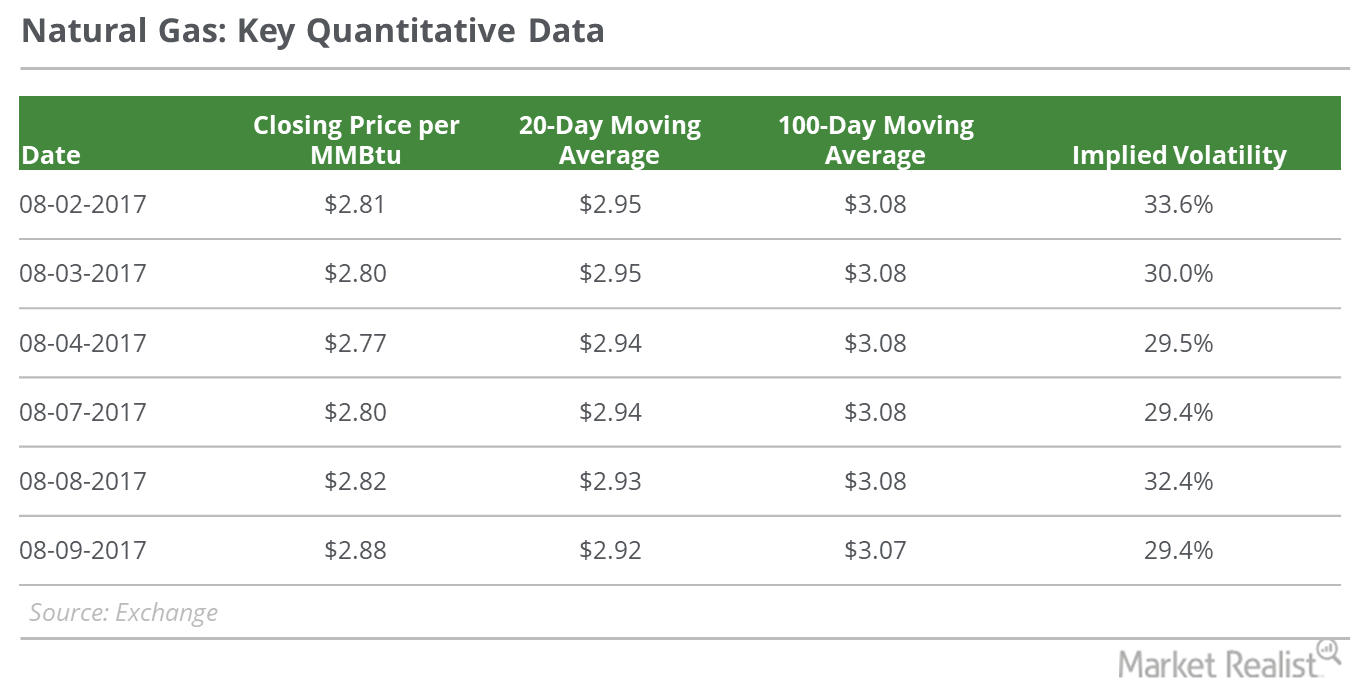
Why Natural Gas Prices Are Rising
On August 9, 2017, natural gas (UNG) September futures closed at $2.88 per MMBtu (million British thermal unit).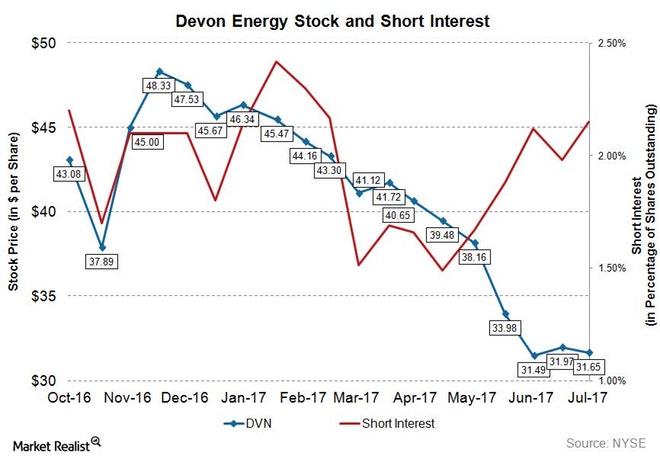
Chart of the Week: What’s the Short Interest in Devon Energy?
As of July 14, 2017, short interest in Devon Energy (DVN) is ~11.3 million shares, while its average daily volume is ~6.2 million shares.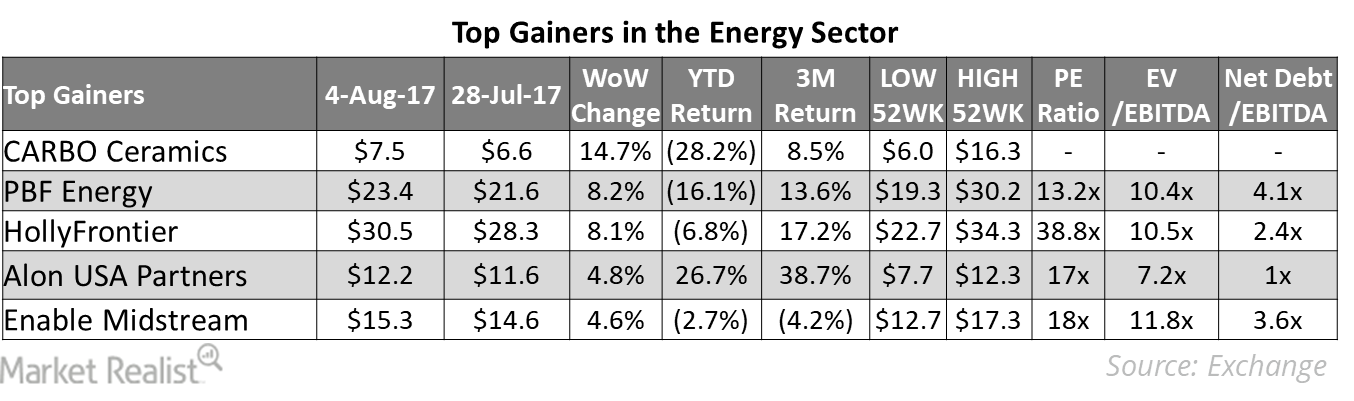
These Energy Stocks Rose the Most Last Week
Oil field services stock CARBO Ceramics (CRR) was the biggest gainer among the energy sector stocks last week.
Oil Rigs: Oil Prices Could Make a U-Turn
The US oil rig count extended to 765 in the week ending July 14, 2017—a gain of two rigs compared to the previous week.
Why Oil Prices Could Plunge
The US oil rig count rose by seven to 763 in the week ended July 7, 2017. This was the rig count’s highest level since April 10, 2015.
Oil Rigs: Will Oil Prices Rise More?
On June 23–June 30, the US oil rig count fell by two to 756. The fall was marginal, but it was the first fall after rising for 23 consecutive weeks.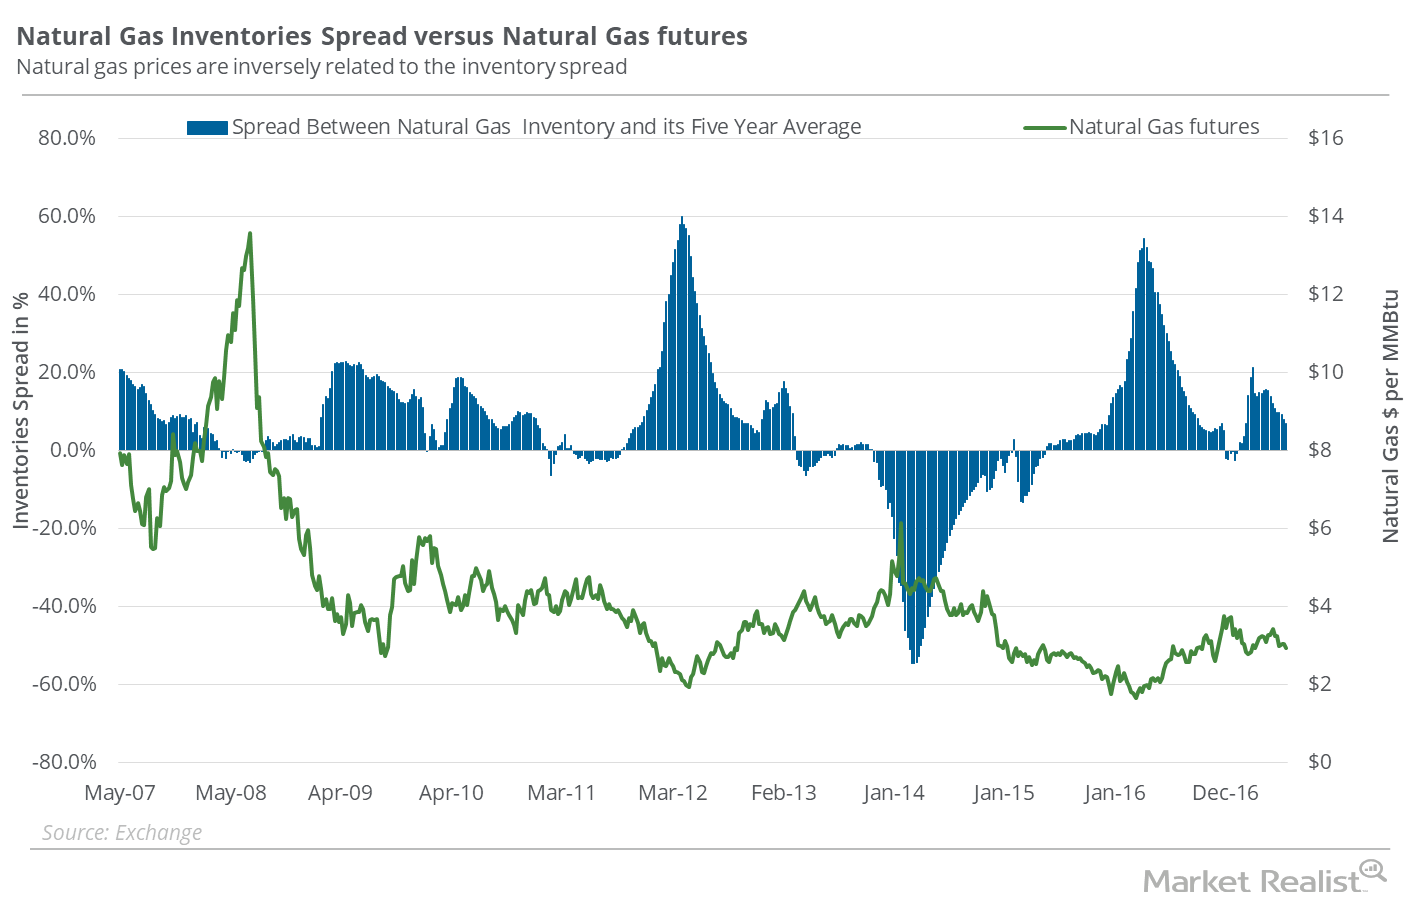
Can the Natural Gas Inventories Spread Rescue Natural Gas Bulls?
In the week ended June 23, 2017, natural gas inventories were at 2,816 Bcf (billion cubic feet)—46 Bcf more compared to the week earlier.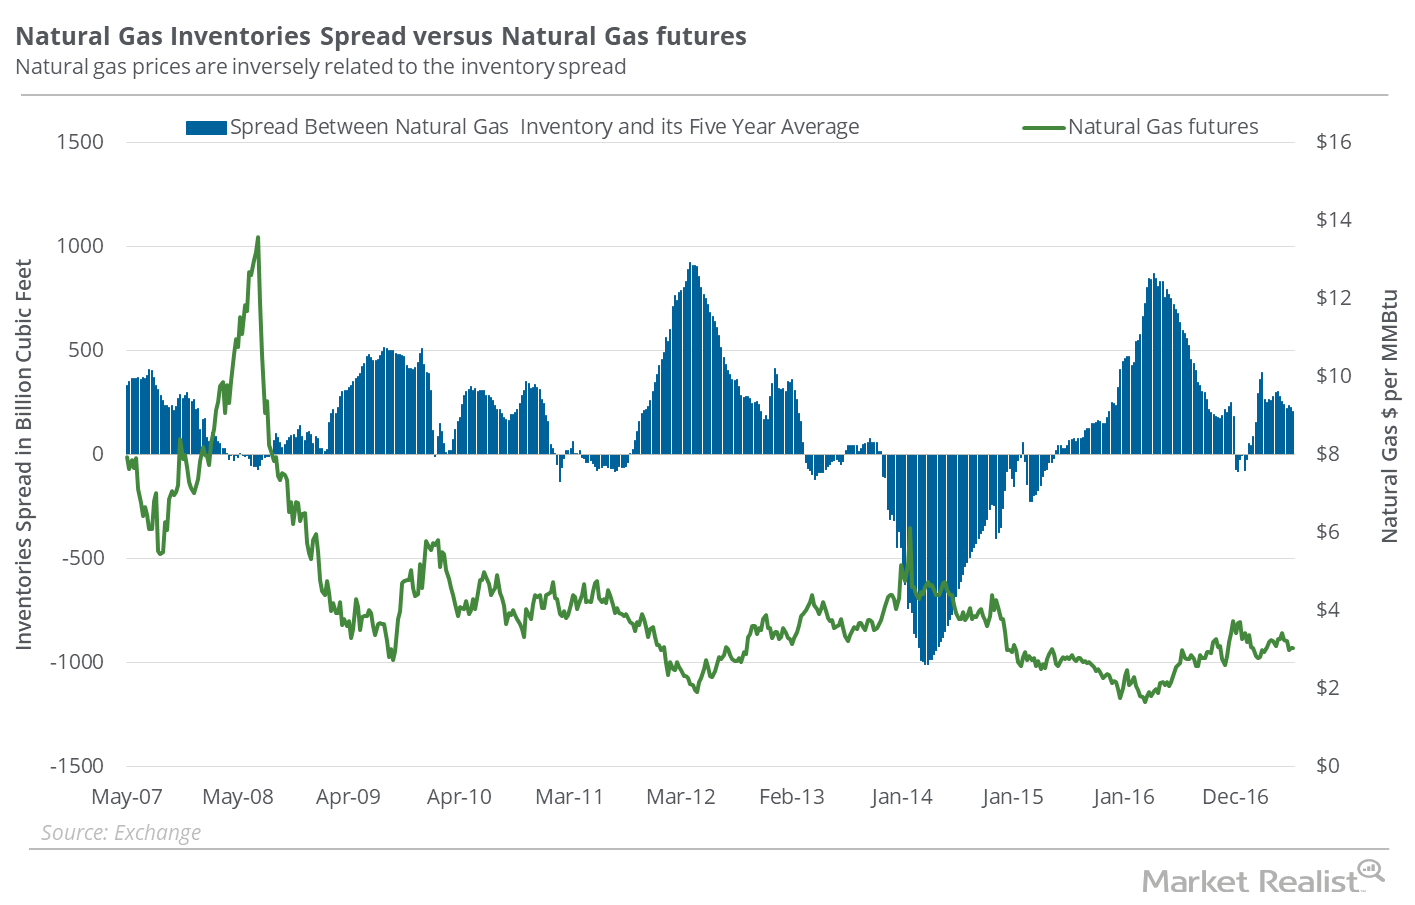
Why the Natural Gas Inventory Spread Supports Its Recent Recovery
In the week ended June 16, 2017, natural gas inventories rose 61 Bcf (billion cubic feet) to 2,770 Bcf based on EIA data released on June 22, 2017.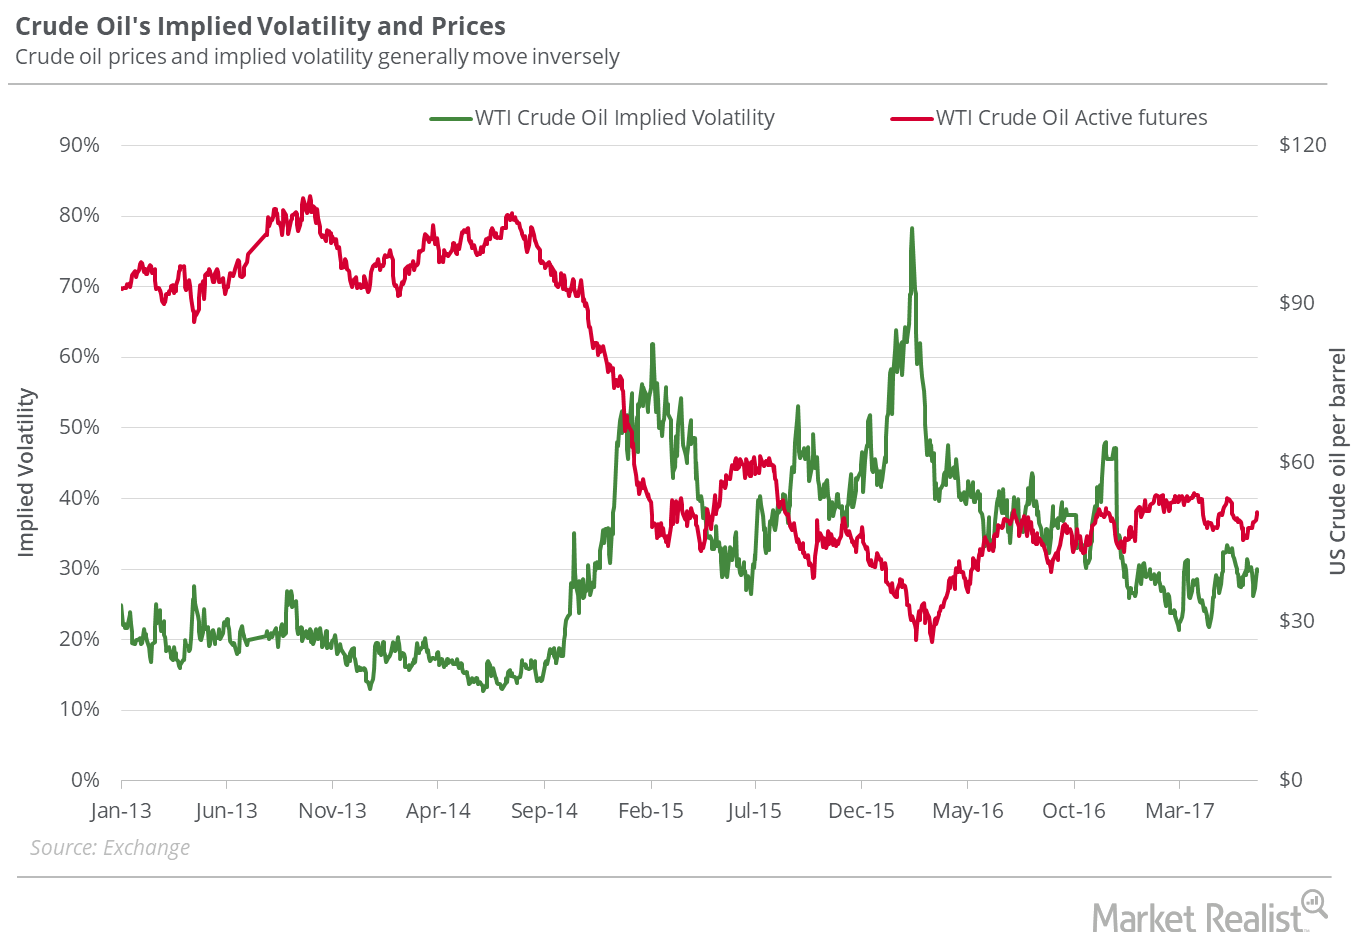
Will US Crude Oil Hit $40 Next Week?
On June 22, 2017, WTI crude oil (USO) (OIIL) active futures’ implied volatility was 29.7%, up 1.7% compared to its 15-day average.
Natural Gas Inventories Spread: Savior for Natural Gas Bulls?
The EIA reported that natural gas inventories rose by 78 Bcf (billion cubic feet) to 2,709 Bcf in the week ending June 9, 2017.