
Rabindra Samanta
I have been working at Market Realist since August 2015. My primary area of expertise includes qualitative and quantitative analysis of crude oil and the natural gas market. This focus also includes tracking macroeconomic indicators. But, later into my career, I also started covering global markets, hedge fund manager commentary, and other macro developments.
I completed the PGDBM degree in 2014. Prior to Market Realist, I worked with one of India's largest brokerage house, Kotak Securities. My primary responsibilities include market analysis, portfolio advisory, and investor presentations.
After my graduate degree, I worked as an Associate at Vedanta Resources CPP (captive power plant) and IPP (Independent Power plant) project at Jharsuguda Odisha.
Disclosure: I am in full compliance with all ethics and other policies for Market Realist research analysts. I am not invested in securities that I cover on Market Realist.
More From Rabindra Samanta

Soros Exits, Buffet Increases: Who Is Right on Apple?
In Q4 2018, legendary investor George Soros sold all his holding in Apple (AAPL). In Q3 2018, Apple represented around 0.2% of his total portfolio.
Goldman Sachs: Expect Volatile October, Rising Gold
Yesterday, Goldman Sachs’ strategist warned of high volatility in October. Based on Goldman Sachs’ data, since 1928 volatility in October is 25% higher.
Will API Inventory Data Impact Energy Stocks?
Today, the API plans to release its oil inventory data for the week ended August 30. Gasoline inventories are expected to fall by 1.8 MMbbls.
Is Trump Hinting at a Currency War?
The currency can be weakened by the central bank or government intervention. If President Trump is reelected, a currency war seems obvious.
Where Is US Crude Oil Headed? An Energy Update
On August 30, US crude oil October futures settled at $55.1 per barrel. On a week-over-week basis, US crude oil prices rose 1.7%.
Crude Oil’s Outlook based on Chart Indicators
On Friday, WTI crude oil active futures rose 3.2% to $55.66 per barrel. The day before, they saw their largest single-day fall in more than four years.
How US Production Is Affecting WTI Crude Oil Prices
Between February 11, 2016, and July 15, 2019, WTI crude oil prices rose 127.3%. The United States Oil Fund LP (USO) gained 53.9% in the period.
Oil Prices: Implied Volatility Suggests Upside Is Intact
On June 27, US crude oil’s implied volatility was 33.7%—12.7% below its 15-day average. Lower implied volatility might support oil prices.
Range Resources: What Do Analysts Recommend?
On June 14, BMO reduced its target price on Range Resources by $2 to $6. On June 12, Citigroup reduced its target price by $4.5 to $7.5.
Rise in Oil Pushed Energy ETFs Higher
US crude oil active futures have risen 8.6% in the trailing week, which might have boosted or limited the downside in OIH, XOP, XLE, and AMLP. They have returned 5.8%, 5%, 3.7%, and -0.7%, respectively.
Is Oil Dominating Over Natural Gas-Weighted Stocks?
Except Cabot Oil and Gas (COG), all of these natural gas–weighted stocks had a correlation of at least 75% with the S&P 500 Index (SPY).
Where Cabot Oil & Gas’s Stock Price Could Be by May’s End
On May 24, Cabot Oil & Gas’s (COG) implied volatility was 28.6%, ~4.4% higher than its 15-day average.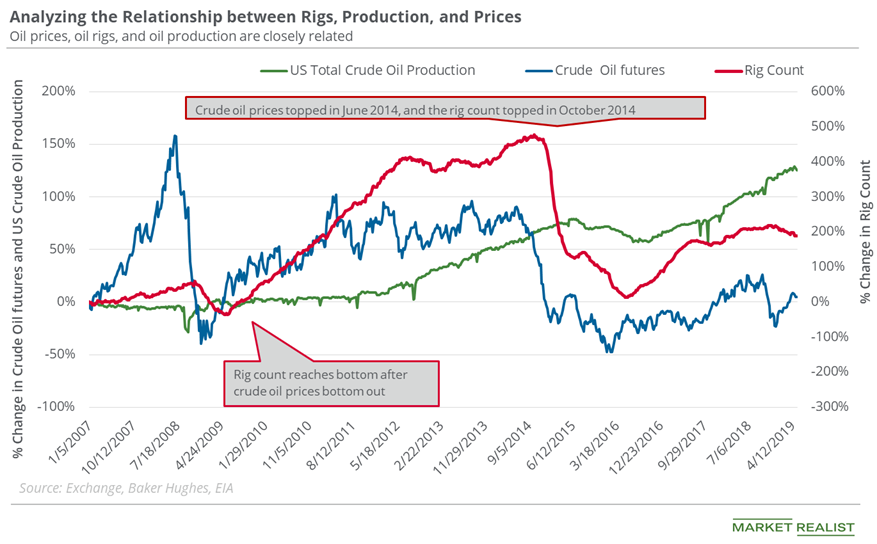
Is the Oil Rig Count Dragging US Oil Production?
Last week, the oil rig count fell by three to 802—the lowest level since March 30.
Are Oil Bulls Back?
On April 12–18, US crude oil June futures rose 0.1% and closed at $64 per barrel. The S&P 500 Index (SPY) fell 0.1% last week.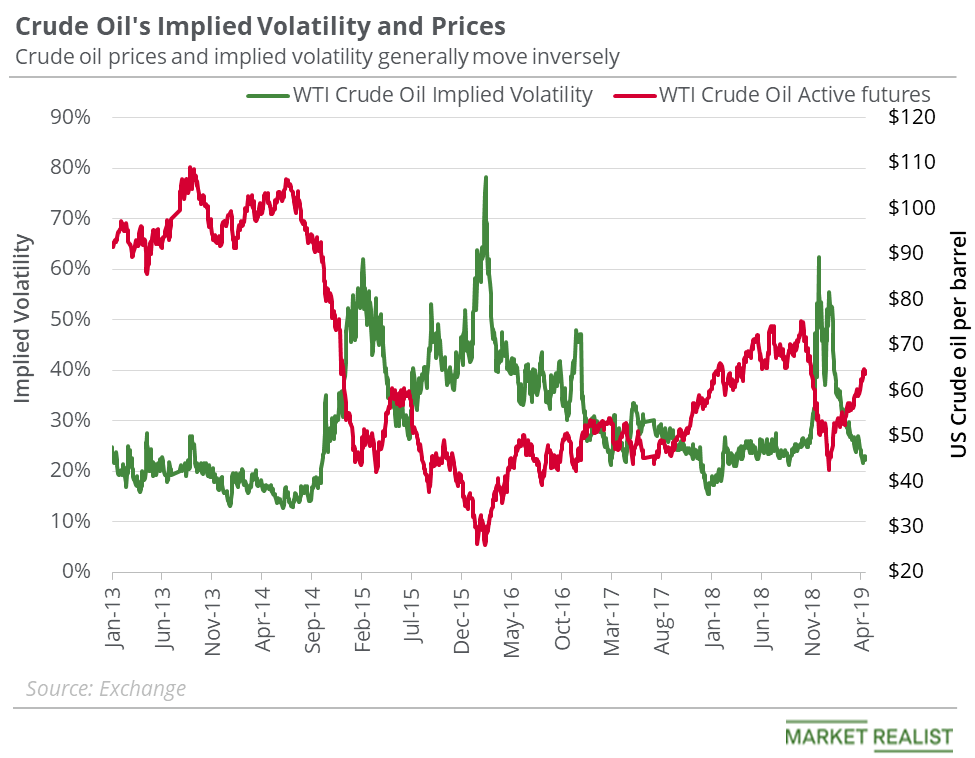
Crude Oil’s Implied Volatility and Price Forecast
On April 17, US crude oil’s implied volatility was 22.1%, which is 5.5% below its 15-day average.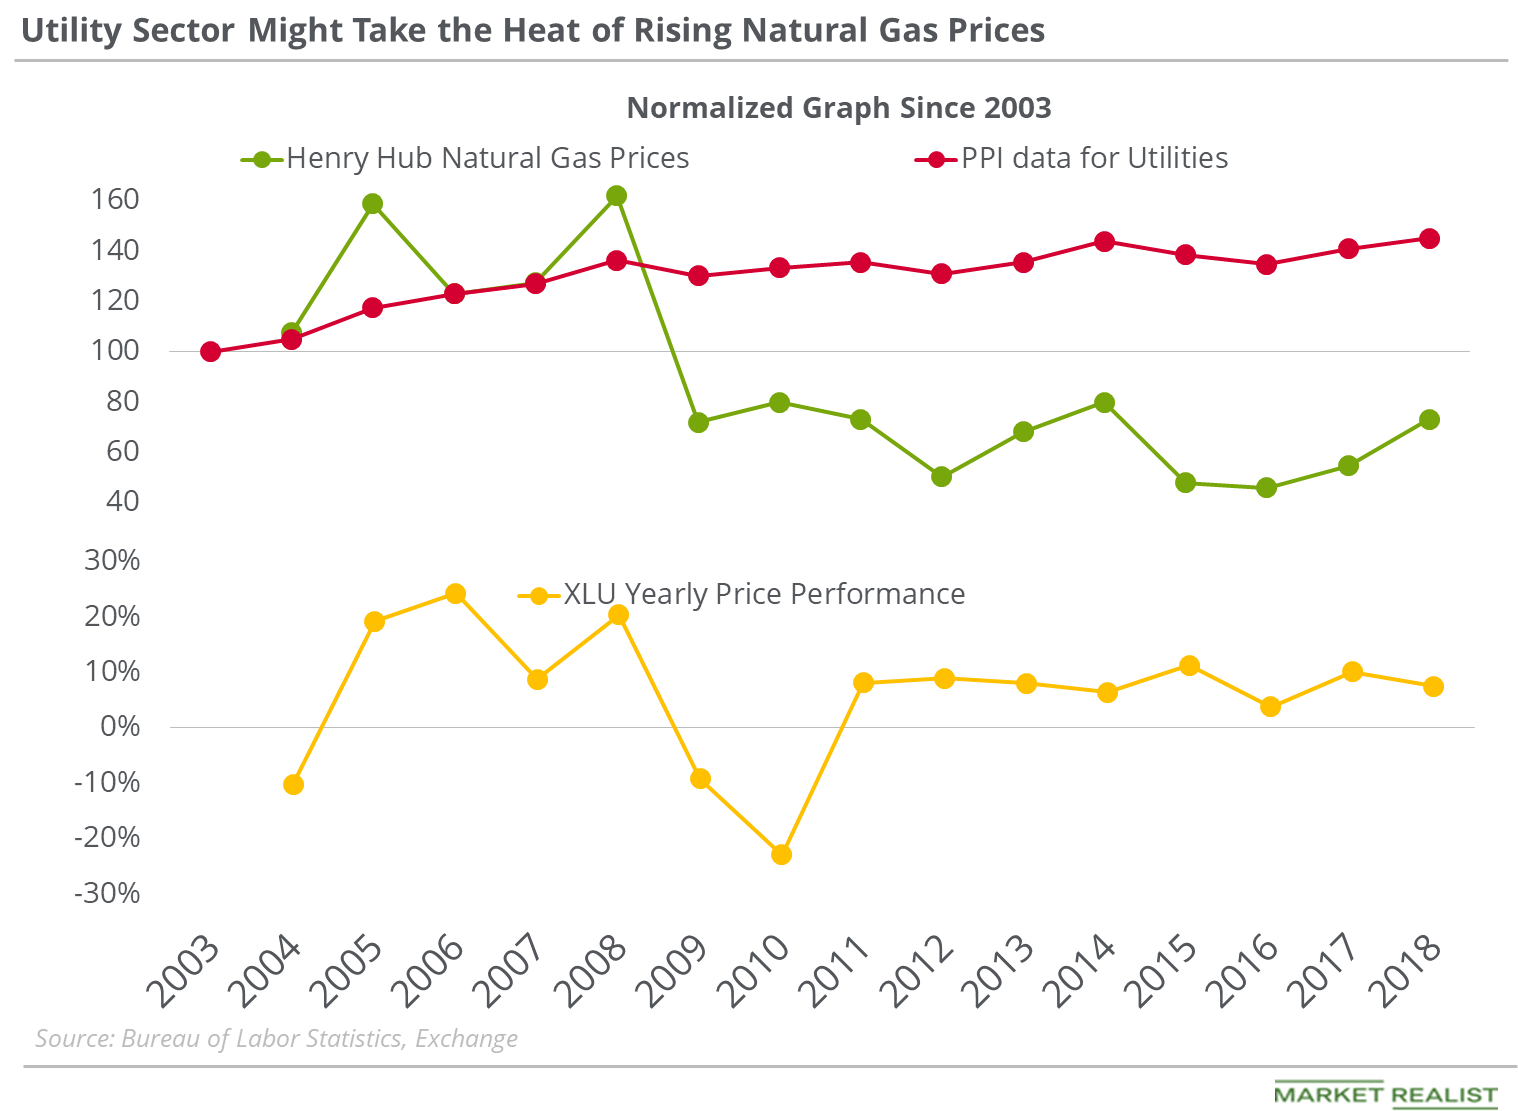
Utilities’ PPI Could Increase with Higher Natural Gas Prices
On March 3, 2016, natural gas active futures were at the lowest closing level in the last 17 years.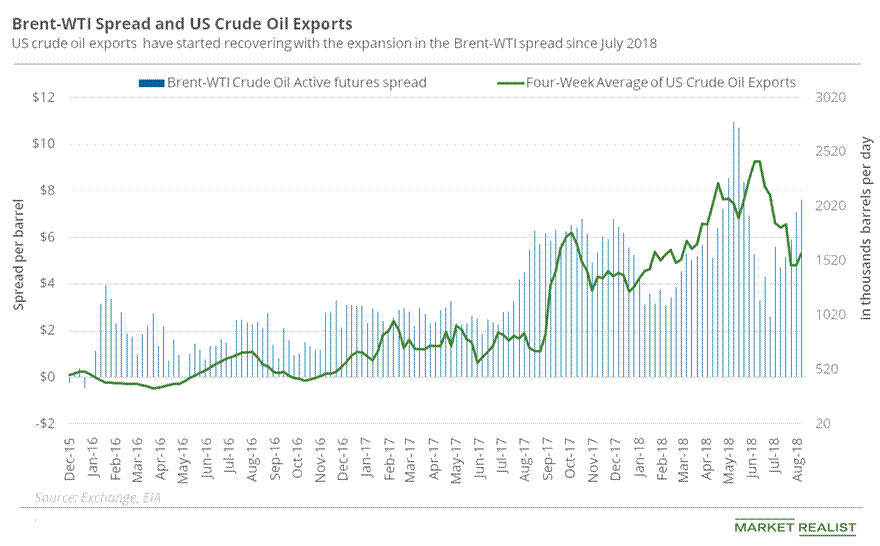
Brent-WTI Spread Might Push Oil Exports and Downstream Stocks Up
On September 10, 2018, Brent crude oil November futures settled ~$9.83 higher than WTI crude oil October futures, the highest level for the Brent-WTI spread since June 19, 2018.
Key Energy Events This Week
The EIA’s crude oil and natural gas inventory data are scheduled to be released on April 25 and April 26, 2018, respectively.
Key Events That Could Steer Oil and Gas Prices This Week
The EIA’s (U.S. Energy Information Administration) Drilling Productivity Report is scheduled for release on February 12, 2018.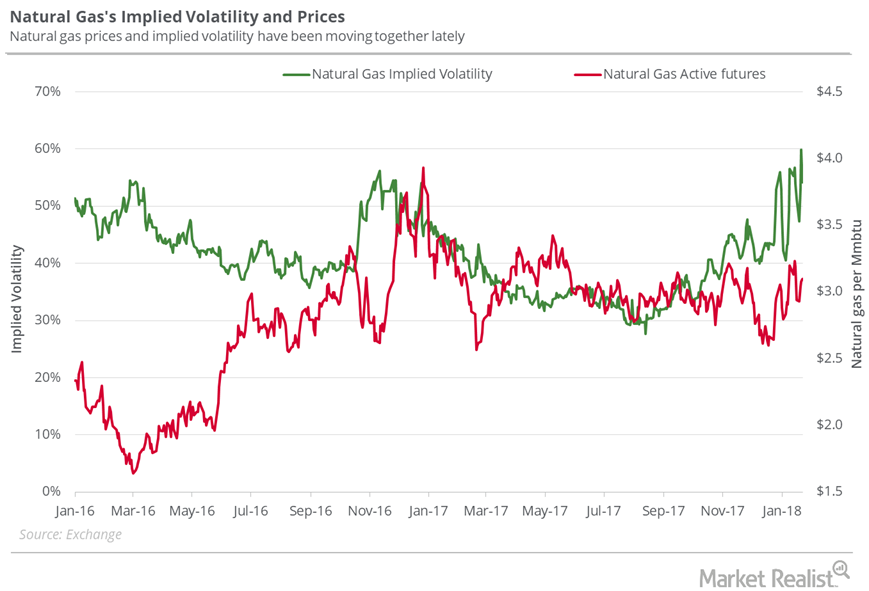
Where Could Natural Gas Prices Close Next Week?
On January 25, 2018, natural gas’s implied volatility was at 54.8%, 8% above its 15-day average.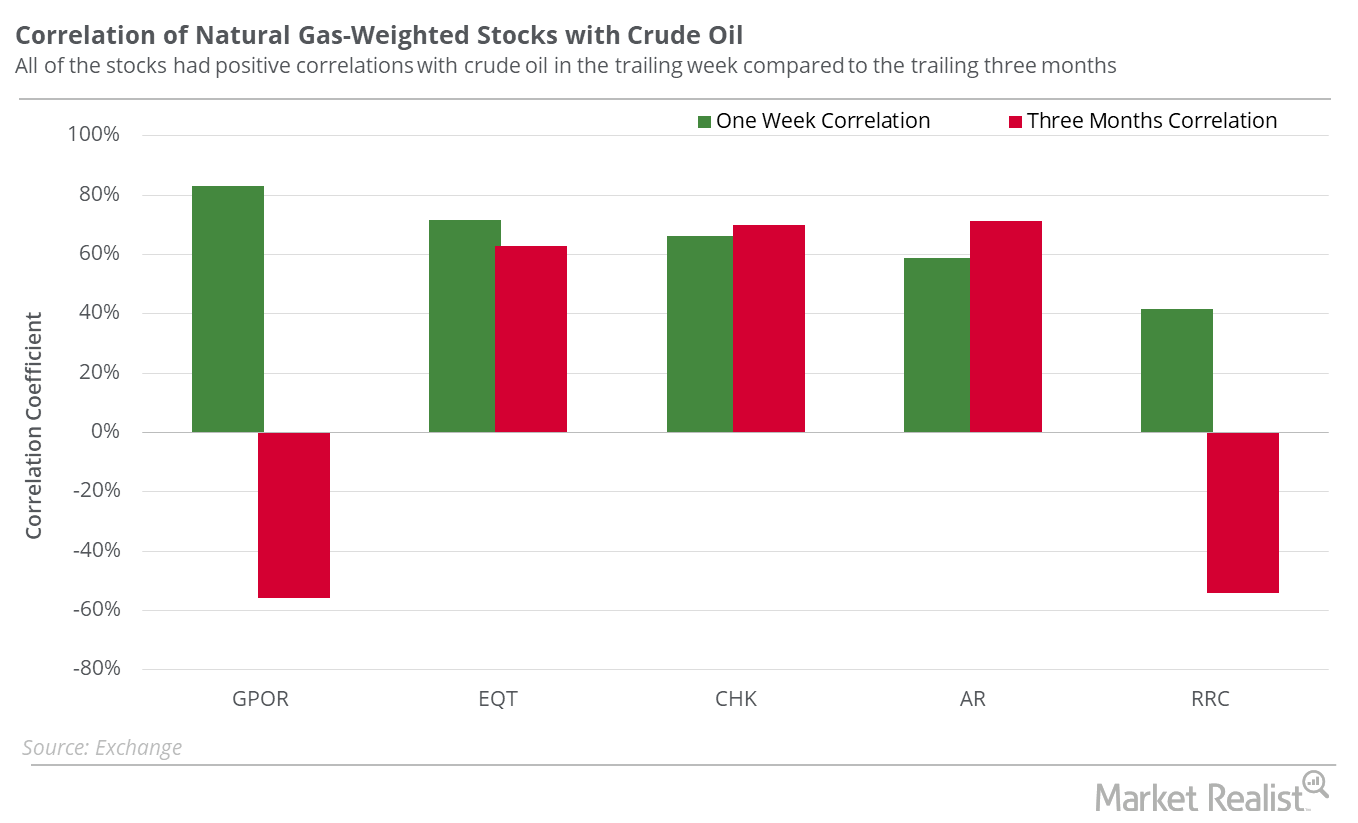
The Relationship between Natural Gas–Weighted Stocks and Oil
Natural gas supplies are linked to US crude oil prices. The entire energy sector tends to track oil prices.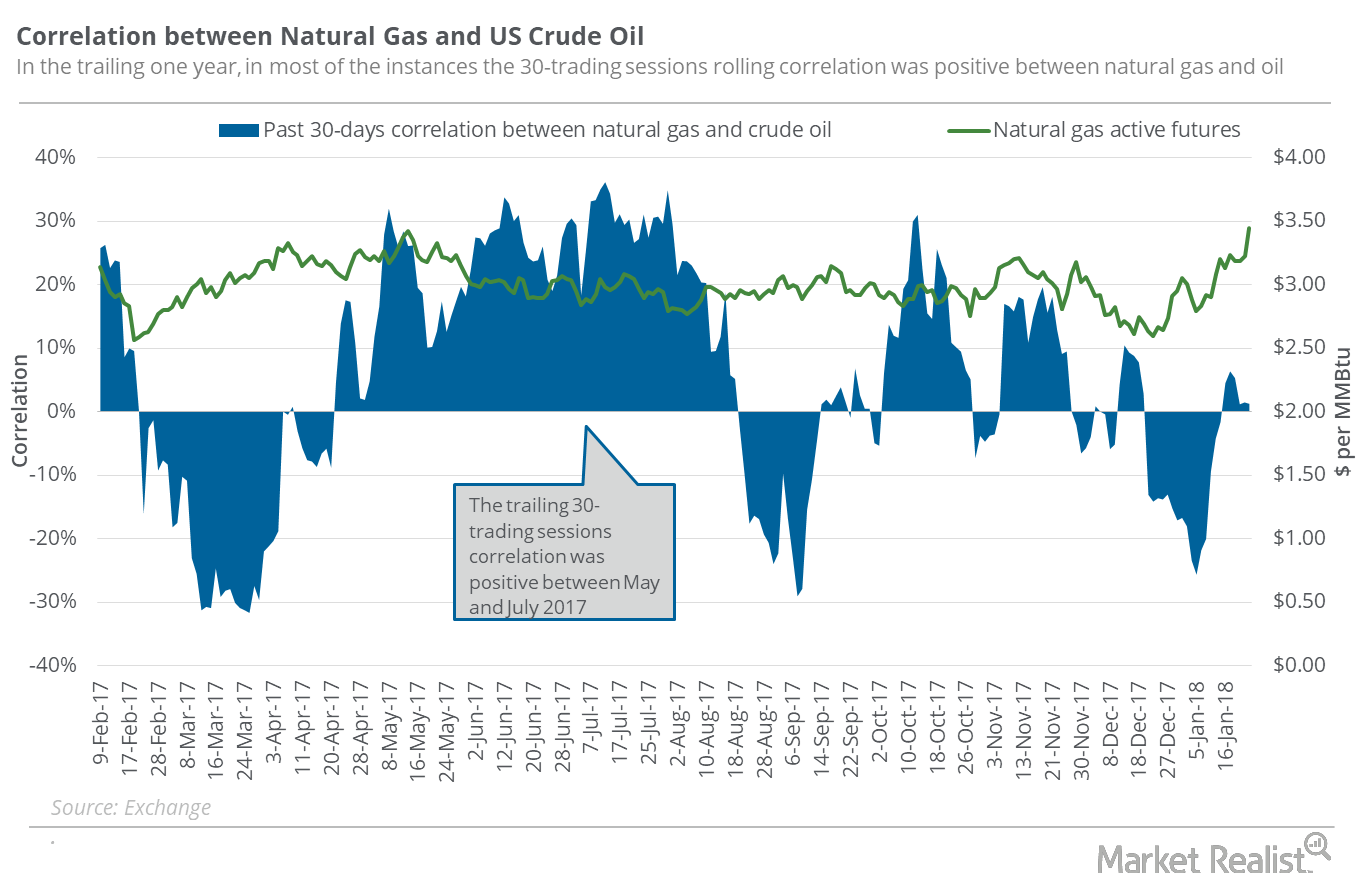
Does Natural Gas’s Rise Depend on Crude Oil?
Between January 16 and January 23, 2018, natural gas (GASL) (UNG) (FCG) had a correlation of 84.6% with US crude oil (OIIL) (USL) (DBO) active futures.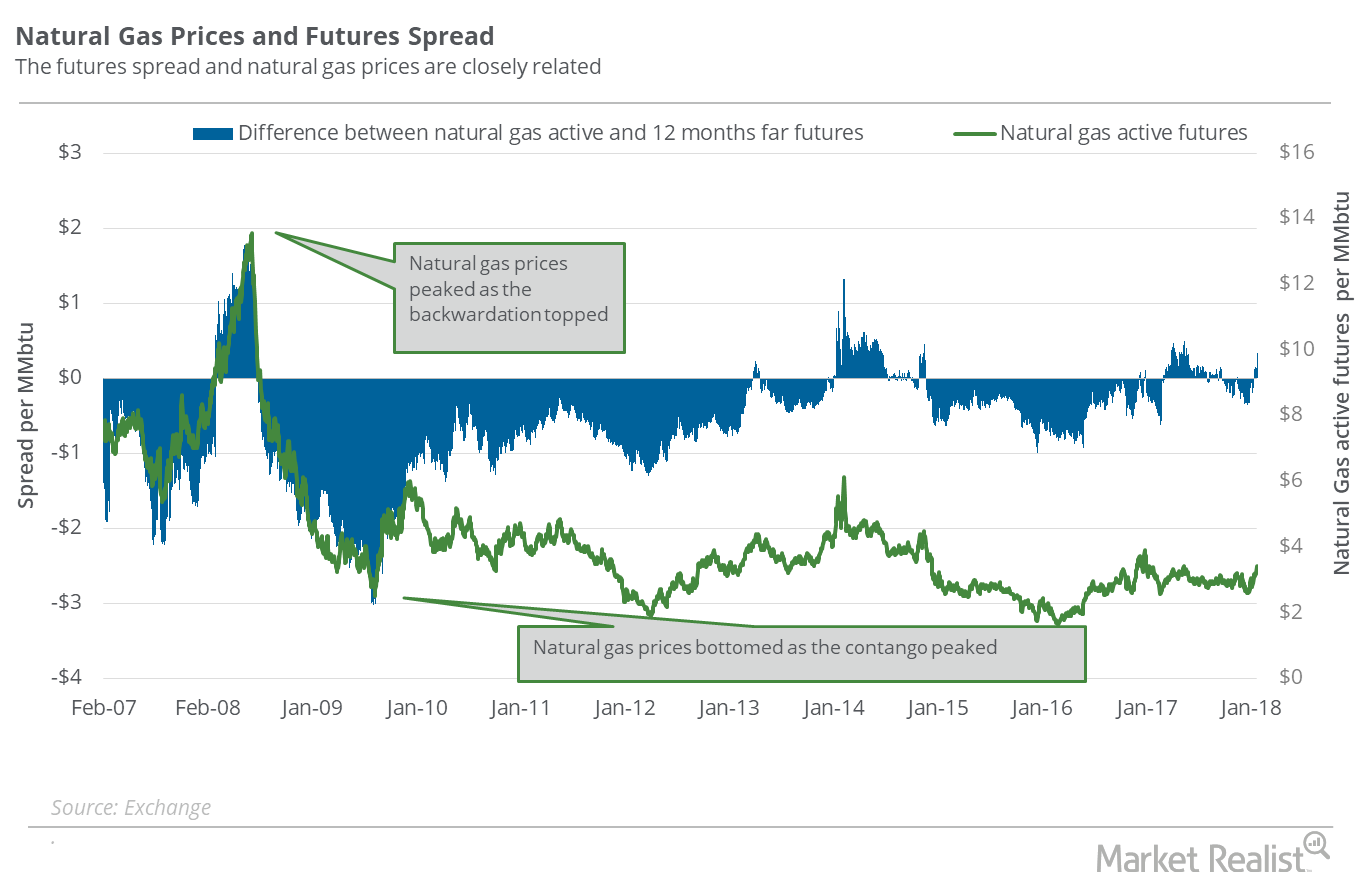
Is Natural Gas Pricing in Colder Weather?
On January 23, 2018, natural gas February 2018 futures settled $0.34 above February 2019 futures.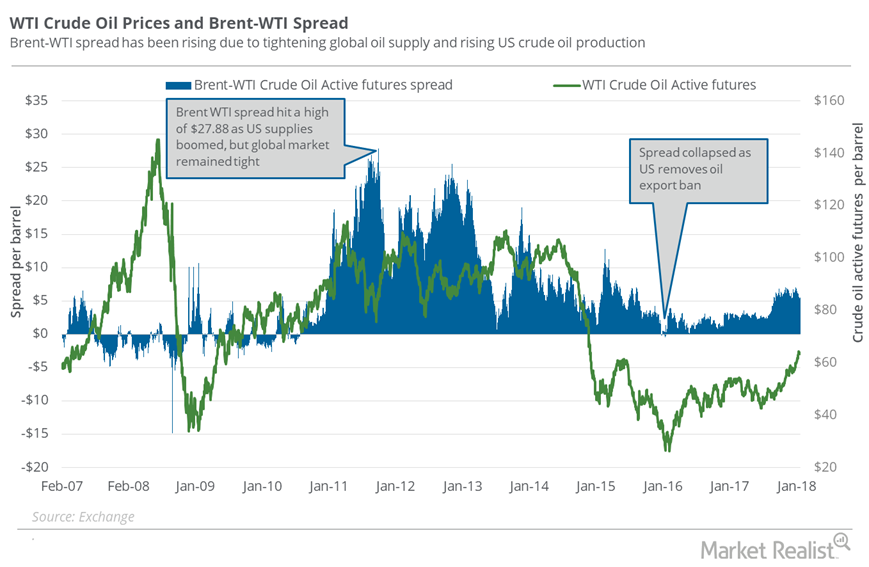
US Oil Exports Could Threaten International Oil Prices
In the week ending January 12, 2018, US crude oil exports were at ~1.25 MMbpd—234,000 barrels per day more than the previous week.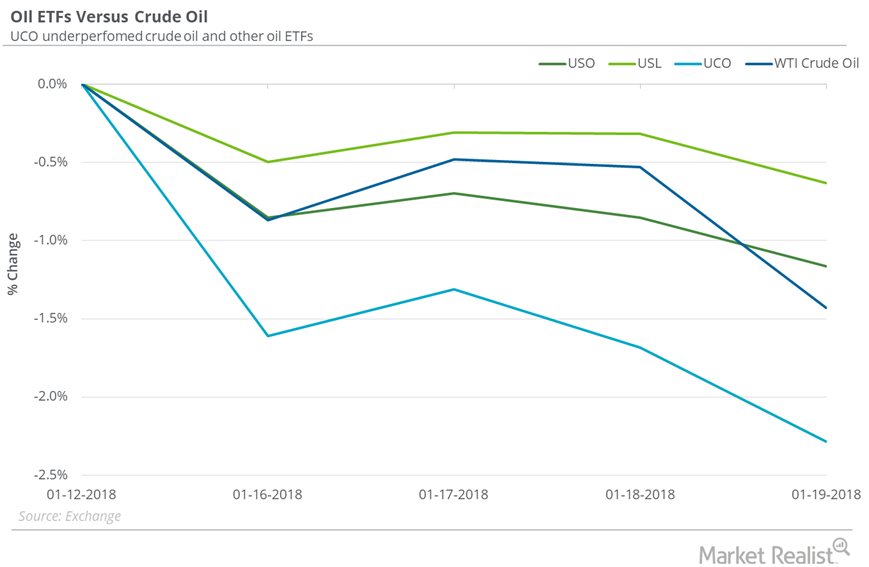
Are Oil ETFs Outperforming Oil?
Between January 12 and January 19, 2018, the United States Oil ETF (USO) fell 1.2%.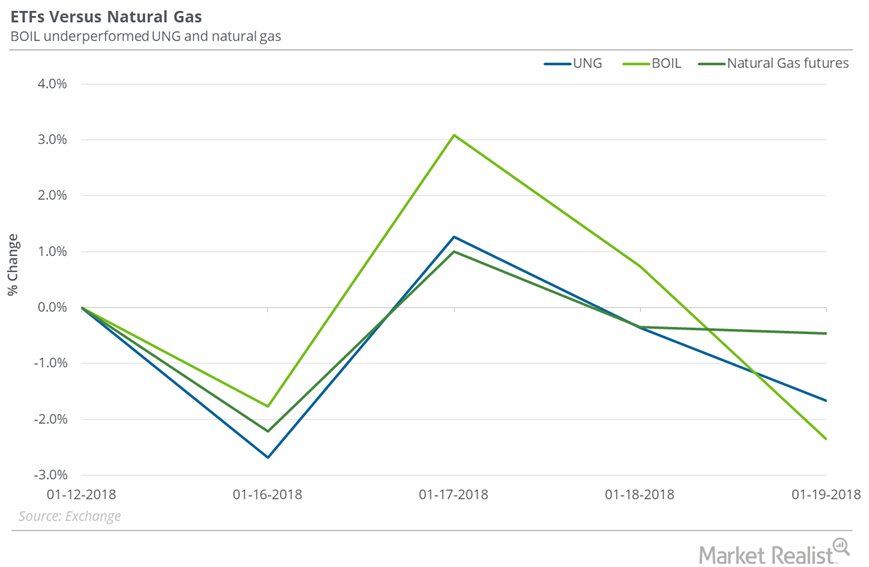
How Natural Gas ETFs Performed Last Week
Between January 12 and January 19, 2018, the United States Natural Gas ETF (UNG), an ETF that has exposure to natural gas futures, fell 1.7%.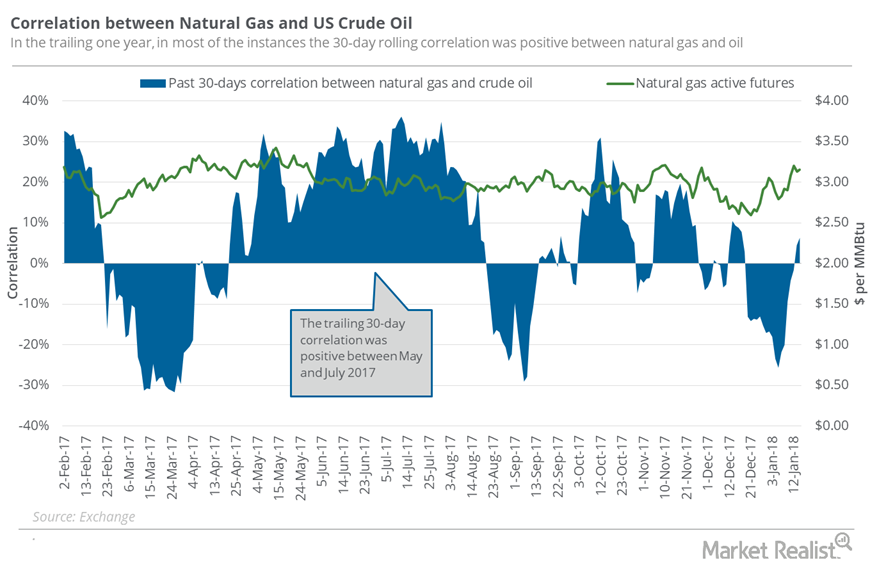
Are the Gains in Natural Gas and Oil Coincidental?
Between January 9 and January 16, 2018, the correlation between natural gas and US crude oil active futures was 52.7%.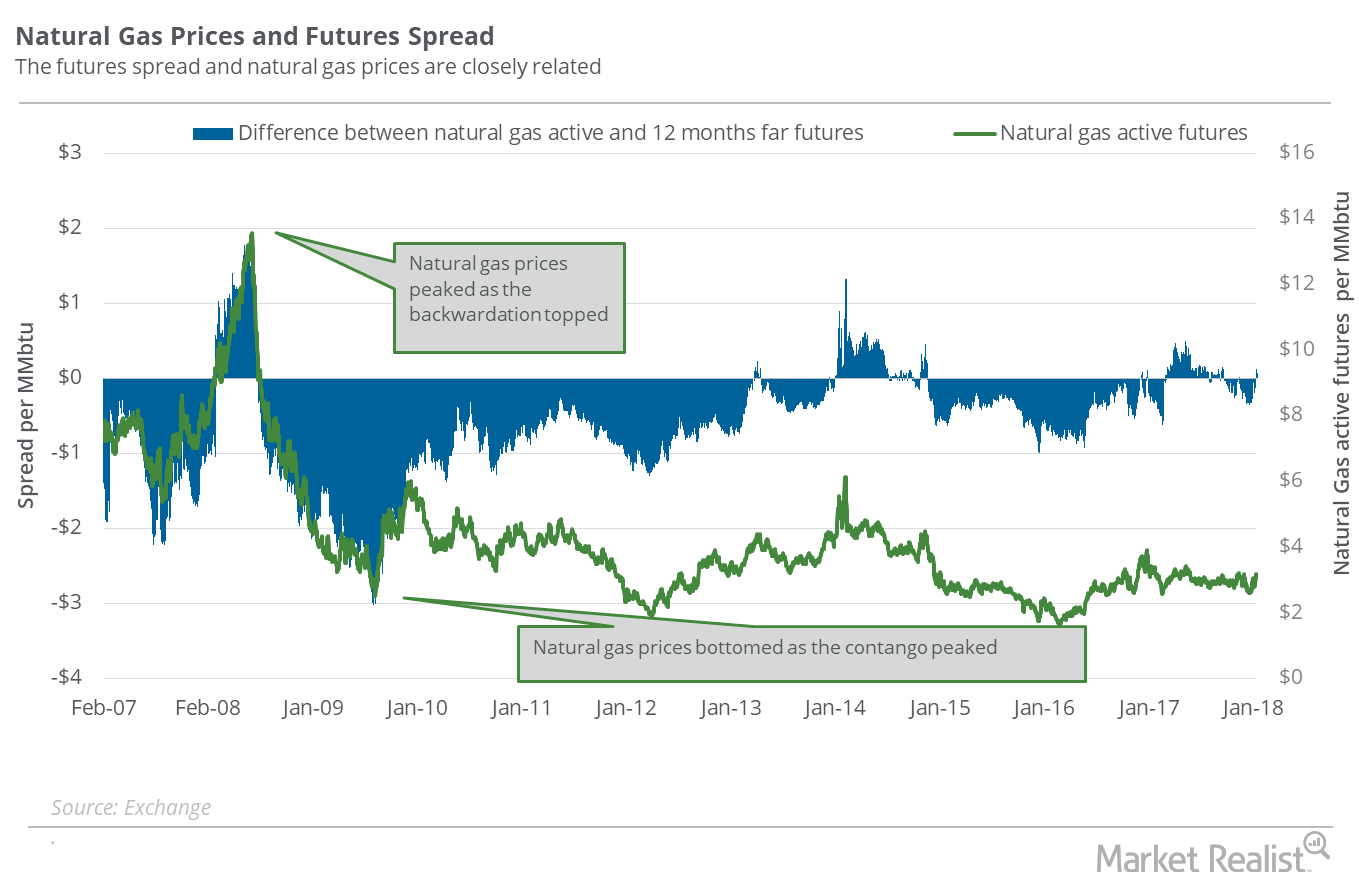
Natural Gas Market Could Be Pricing In a Supply Deficit
On January 16, 2018, the gap between natural gas’s February 2018 futures and February 2019 futures was $0.07, or the futures spread.
Oil ETFs: How They’re Performing at Oil’s 3-Year High
Between January 5 and January 12, 2018, the United States Oil ETF (USO), which holds positions in US crude oil active futures, gained 4.5%.
How Natural Gas ETFs Are Reacting to Spike in Natural Gas
Between January 5 and January 12, 2018, the United States Natural Gas ETF (UNG), which holds positions in active natural gas futures, gained 14.5%.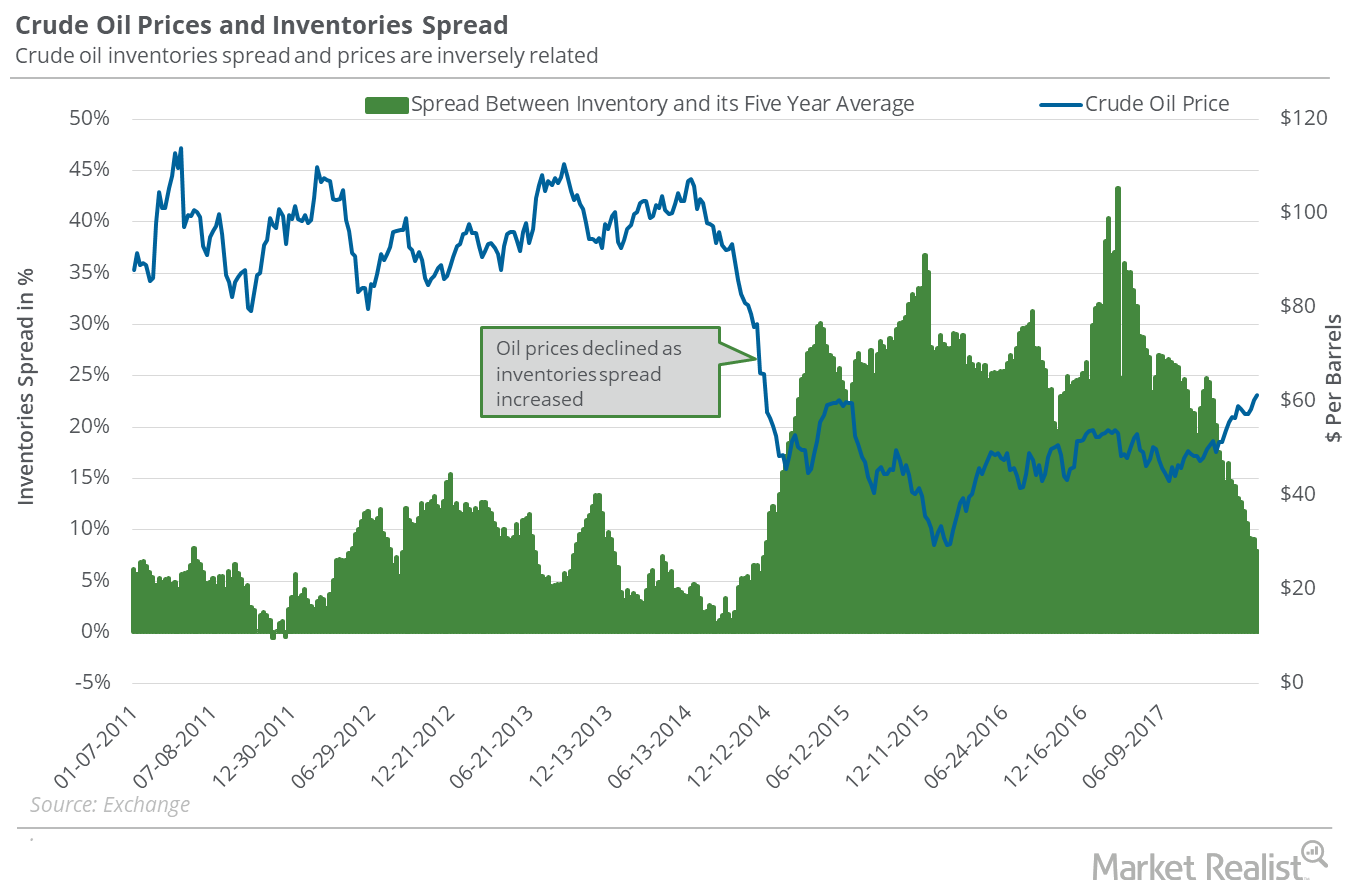
Oil Inventory Data Could Push Oil Higher
In the week ending January 5, 2018, US crude oil inventories fell by 4.9 MMbbls (million barrels)—1 MMbbls more than the market’s expected fall.
Is $3.30 Possible for Natural Gas Next Week?
On January 11, 2018, natural gas’s implied volatility was 49.1%. That’s 7% above its 15-day average.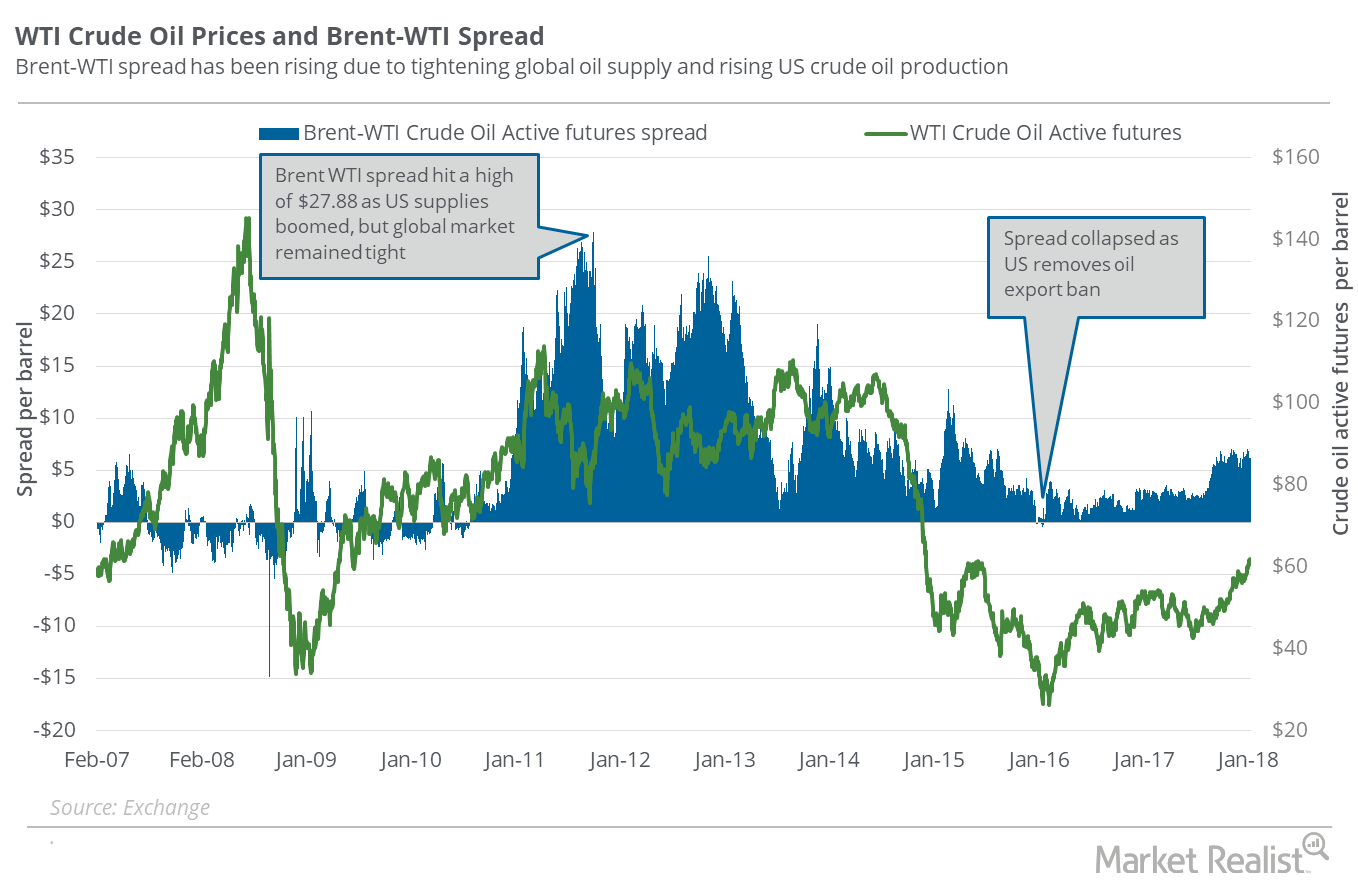
US Oil Exports Are Crucial for Oil Prices in 2018
On January 8, 2018, Brent crude oil (BNO) active futures were $6.05 stronger than WTI (West Texas Intermediate) crude oil (USO) (UCO) active futures.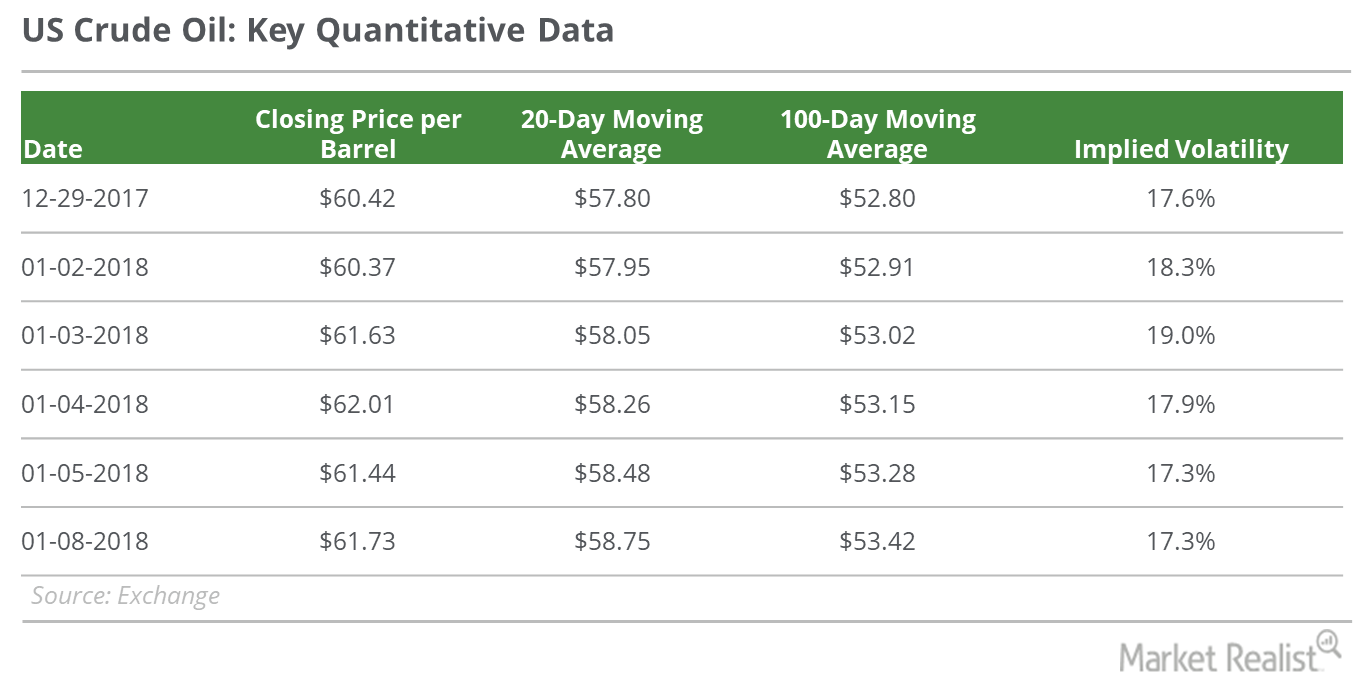
Will US Crude Oil Prices Make a New 3-Year High?
On January 8, 2018, US crude oil (USO) (USL) February 2018 futures rose 0.5% and closed at $61.73 per barrel—0.5% below the three-year high.
Possible Downside in Natural Gas Next Week
On December 21, 2017, natural gas prices closed at the lowest closing level since February 23, 2017. Since that day, natural gas futures have risen 11.1%.
Why Oil Reached a 3-Year High
On January 4, 2018, US crude oil (USO) (USL) February 2018 futures rose 0.6% and closed at $62.01 per barrel—a three-year high.
Which Oil ETFs Might Be a Better Bet in 2018?
On December 29, 2017, the closing prices of US crude oil futures contracts between March 2018 and January 2019 were progressively lower.
Natural Gas ETFs to Watch in 2018
On December 29, 2017, the closing prices of natural gas futures contracts between March 2018 and May 2018 were progressively lower.
US Crude Oil Closed at 2017 High: Will the Ride Continue?
On December 22–29, US crude oil (USO) (USL) February futures rose 3.3%. On December 29, US crude oil February 2018 futures closed at $60.42 per barrel.
How Much Fall in Inventories Could Support Oil This Week?
In the week ended December 22, 2017, US crude oil inventories were 431.9 MMbbls (million barrels), a fall of 4.6 MMbbls compared to the previous week.
Should Oil Traders Follow US Oil Exports in 2018?
On December 29, 2017, the price difference between Brent crude oil (BNO) active futures and WTI (West Texas Intermediate) crude oil (USO) (UCO) active futures was $6.45.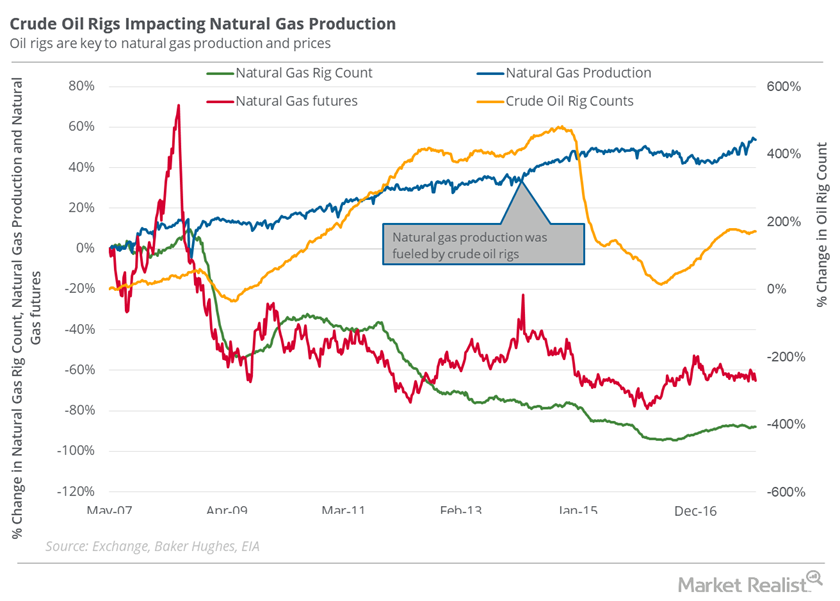
Why the Oil Rig Count Could Be a Concern for Natural Gas Bulls
In the week ended December 22, the natural gas rig count was 88.5% below its record high of 1,606 in 2008.
Which Energy Stocks Were Top Losers Last Week?
In the seven calendar days to December 22, 2017, oilfield services company Seadrill (SDRL) was the largest loser.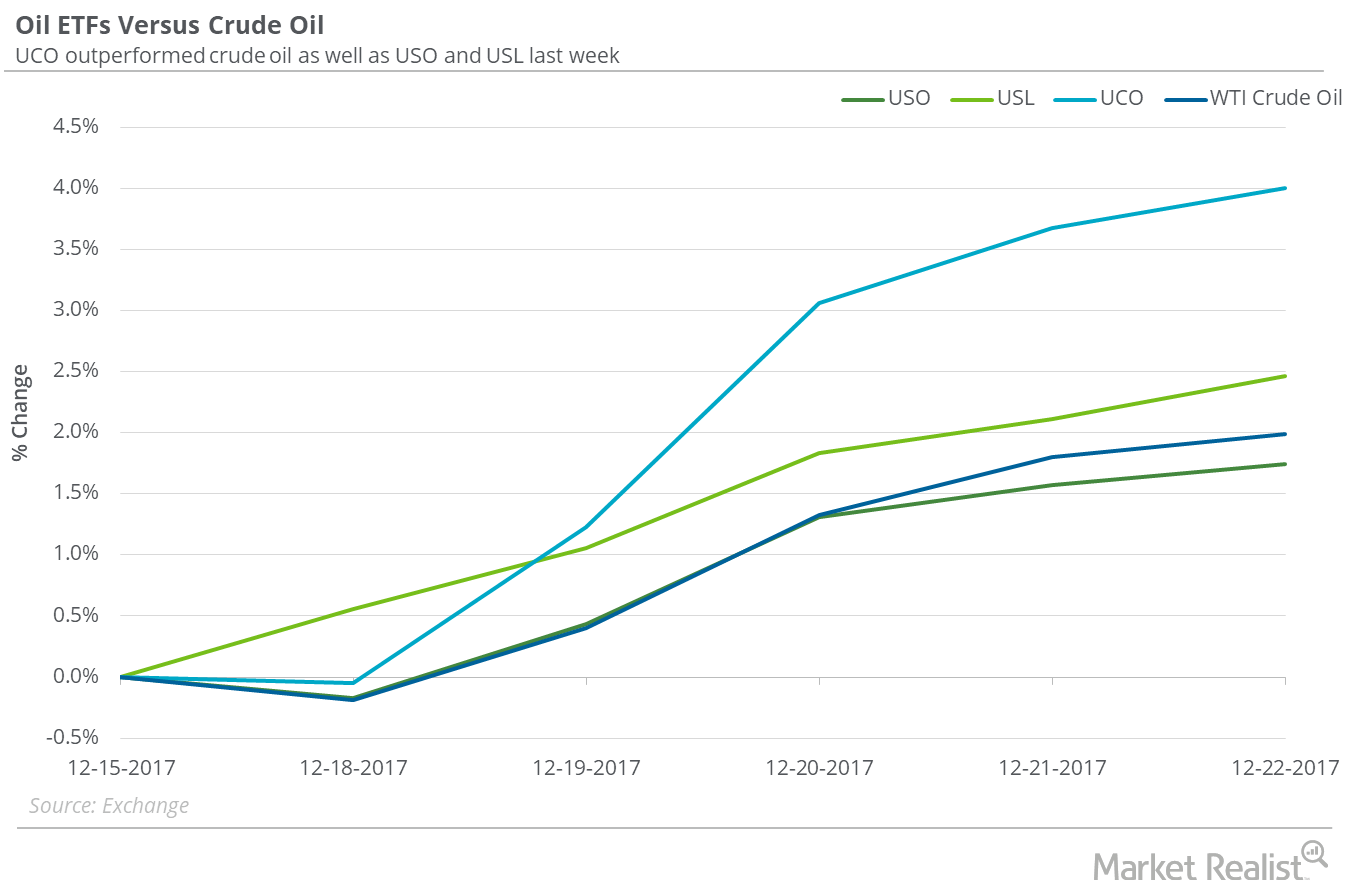
US Crude Oil and Oil ETFs: Which One Is Rising More?
From December 15–22, 2017, the United States Oil ETF (USO) rose 1.7%. USO holds US crude oil near-month futures contracts.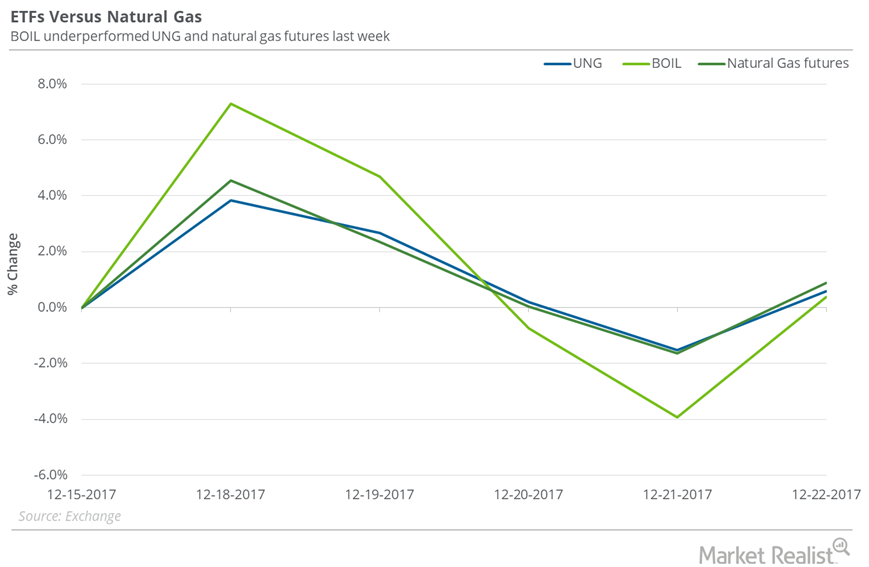
Natural Gas Returns and Natural Gas ETFs
From December 15–22, 2017, the United States Natural Gas Fund (UNG) rose 0.6%.
Could US Tax Reform Pose a Threat to Oil Prices?
US tax reform could pose a problem for oil bulls, as lower taxes on the energy sector could bring down breakeven costs for US oil producers.
Natural Gas: Have Oversupply Concerns Eased?
On December 19, natural gas (UNG)(BOIL)(FCG) January 2018 futures closed $0.31 below its January 2019 futures.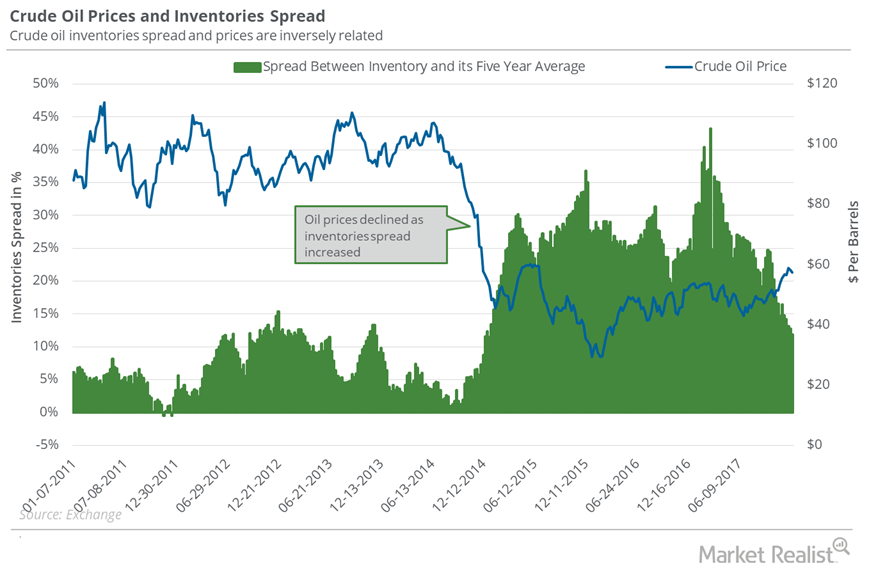
What Oil Bulls Could Expect for Oil Inventories
Oil stockpiles In the week ended December 8, 2017, US crude oil inventories fell by 5.1 MMbbls (million barrels) to 443 MMbbls. However, motor gasoline inventories rose 5.7 MMbbls. The data was released by the EIA (U.S. Energy Information Administration) on December 13. That day, US crude oil prices fell 0.9%. Inventory spread The gap between US oil inventories […]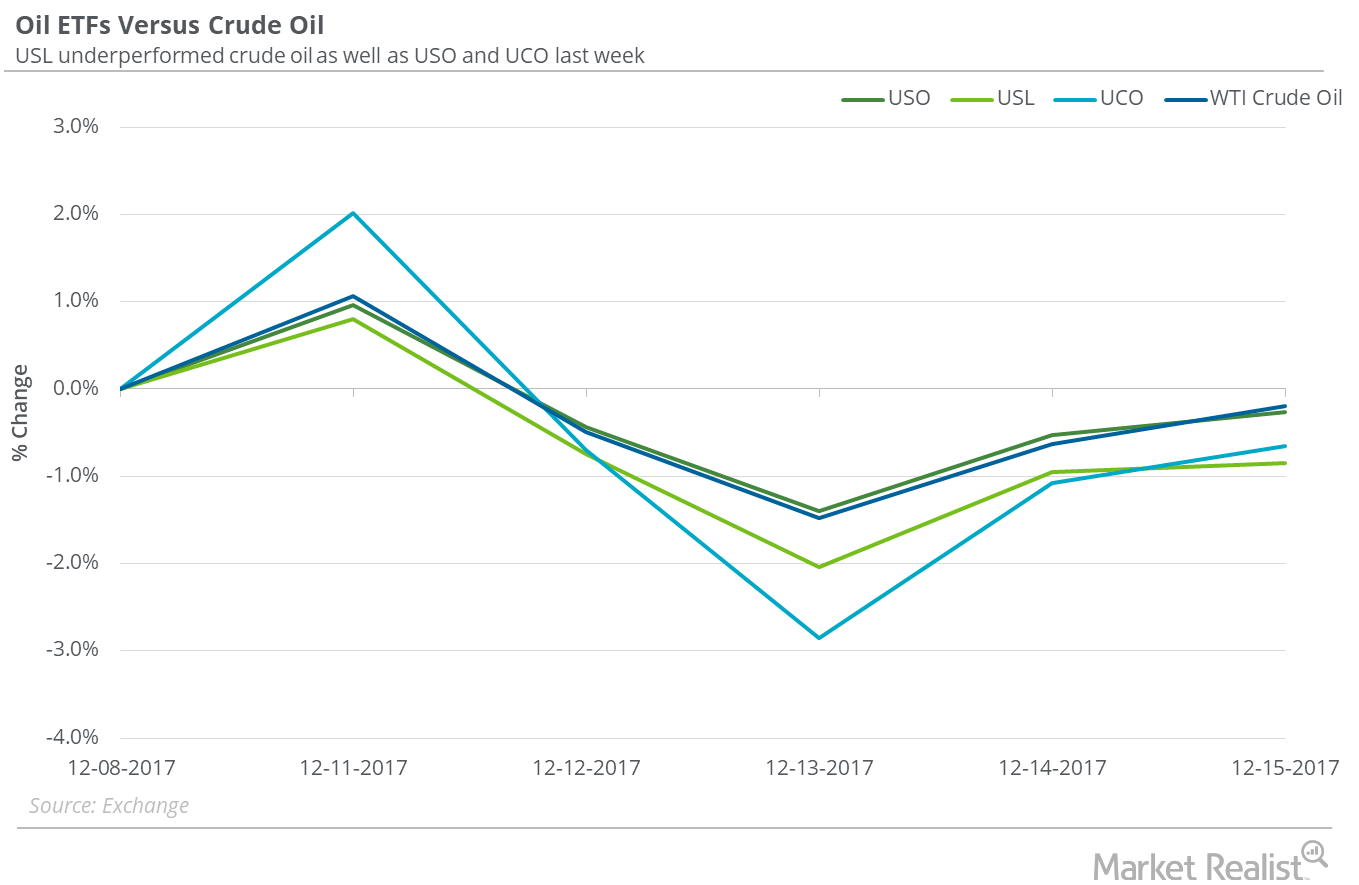
This Oil-Tracking ETF Fell the Most Last Week
Between December 8 and December 15, the United States Oil Fund (USO)—which invests in crude US oil near-month futures contracts—fell 0.3%.
Are Natural Gas ETFs Outperforming the Natural Gas Fall?
Between December 8 and December 15, the United States Natural Gas Fund (UNG)—which invests in natural gas near-month futures contracts—fell 5.6%.
