Crude Oil’s Implied Volatility and Price Forecast
On April 17, US crude oil’s implied volatility was 22.1%, which is 5.5% below its 15-day average.
April 18 2019, Published 8:23 a.m. ET

Oil’s implied volatility
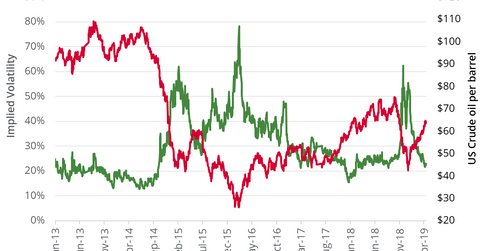
On April 17, US crude oil’s implied volatility was 22.1%, which is 5.5% below its 15-day average. Usually, lower implied volatility supports oil prices. The following chart shows the inverse relationship between oil prices and oil’s implied volatility. Since reaching a 12-year low in February 2016, US crude oil active futures have risen ~143.3%. Crude oil’s implied volatility has fallen ~70.6% since February 11, 2016.
Price forecast
In the next five trading sessions, US crude oil futures should close between $62.22 and $65.52 per barrel 68.0% of the time. The forecast is based on crude oil’s implied volatility of 22.1% and assumes a normal distribution of prices. On April 17, US crude oil June futures fell 0.5% and settled at $63.76 per barrel.
Any changes in oil could be important for equity indexes like the S&P 500 Index (SPY) and the Dow Jones Industrial Average Index (DIA). The sentiment in oil and equity markets is often related.
