
Rabindra Samanta
I have been working at Market Realist since August 2015. My primary area of expertise includes qualitative and quantitative analysis of crude oil and the natural gas market. This focus also includes tracking macroeconomic indicators. But, later into my career, I also started covering global markets, hedge fund manager commentary, and other macro developments.
I completed the PGDBM degree in 2014. Prior to Market Realist, I worked with one of India's largest brokerage house, Kotak Securities. My primary responsibilities include market analysis, portfolio advisory, and investor presentations.
After my graduate degree, I worked as an Associate at Vedanta Resources CPP (captive power plant) and IPP (Independent Power plant) project at Jharsuguda Odisha.
Disclosure: I am in full compliance with all ethics and other policies for Market Realist research analysts. I am not invested in securities that I cover on Market Realist.
More From Rabindra Samanta
Rising Oil Rigs: Oil Bears’ Friend, Oil Bulls’ Foe
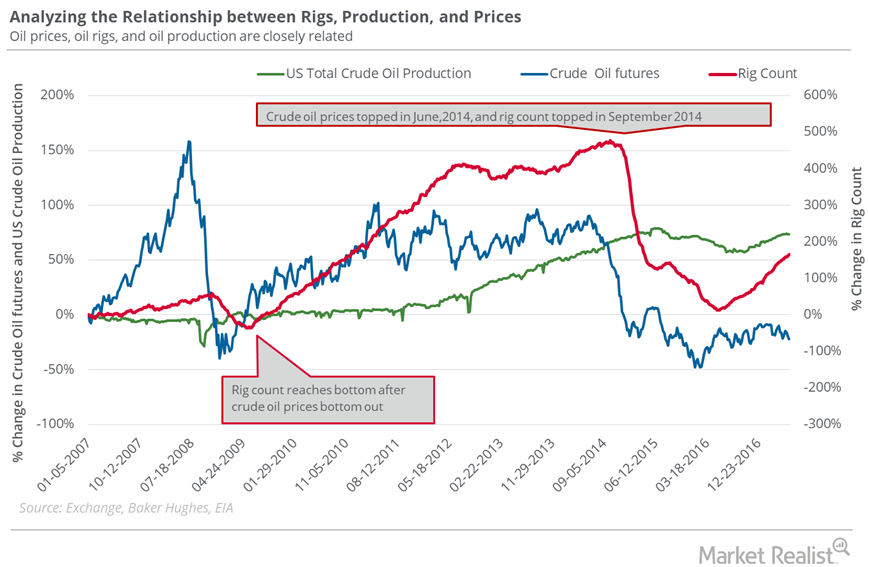
In the week ended June 16, 2017, the US oil rig count was 747, its highest level since the week ended April 17, 2015.
Where Will US Crude Prices Settle?
On June 15, 2017, US crude oil active futures’ implied volatility was 27.9%.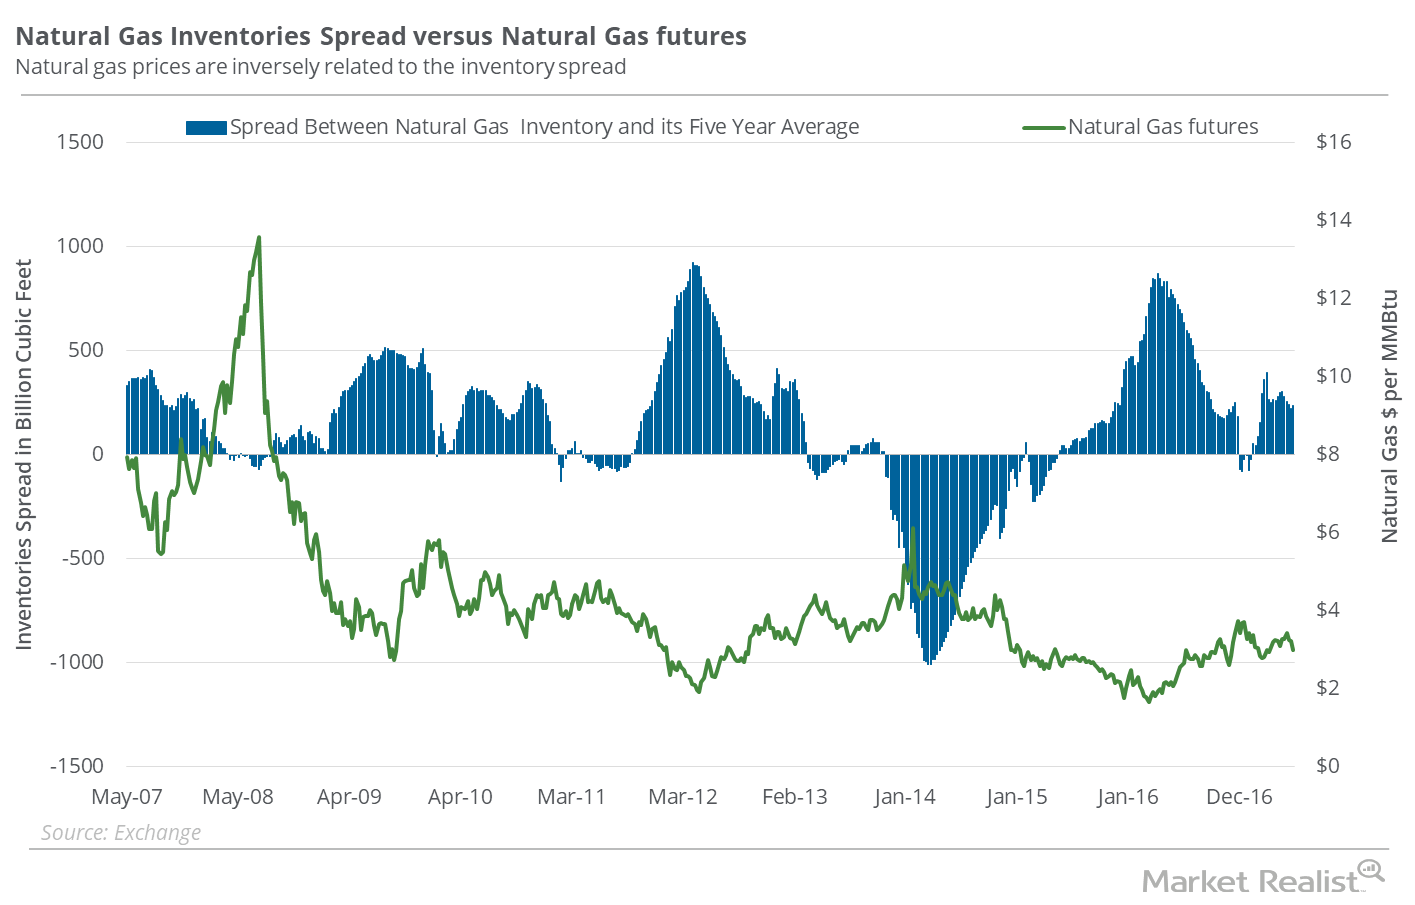
What’s in the Natural Gas Inventory Spread—Bears?
In the week ended June 2, 2017, natural gas inventories rose by 106 Bcf.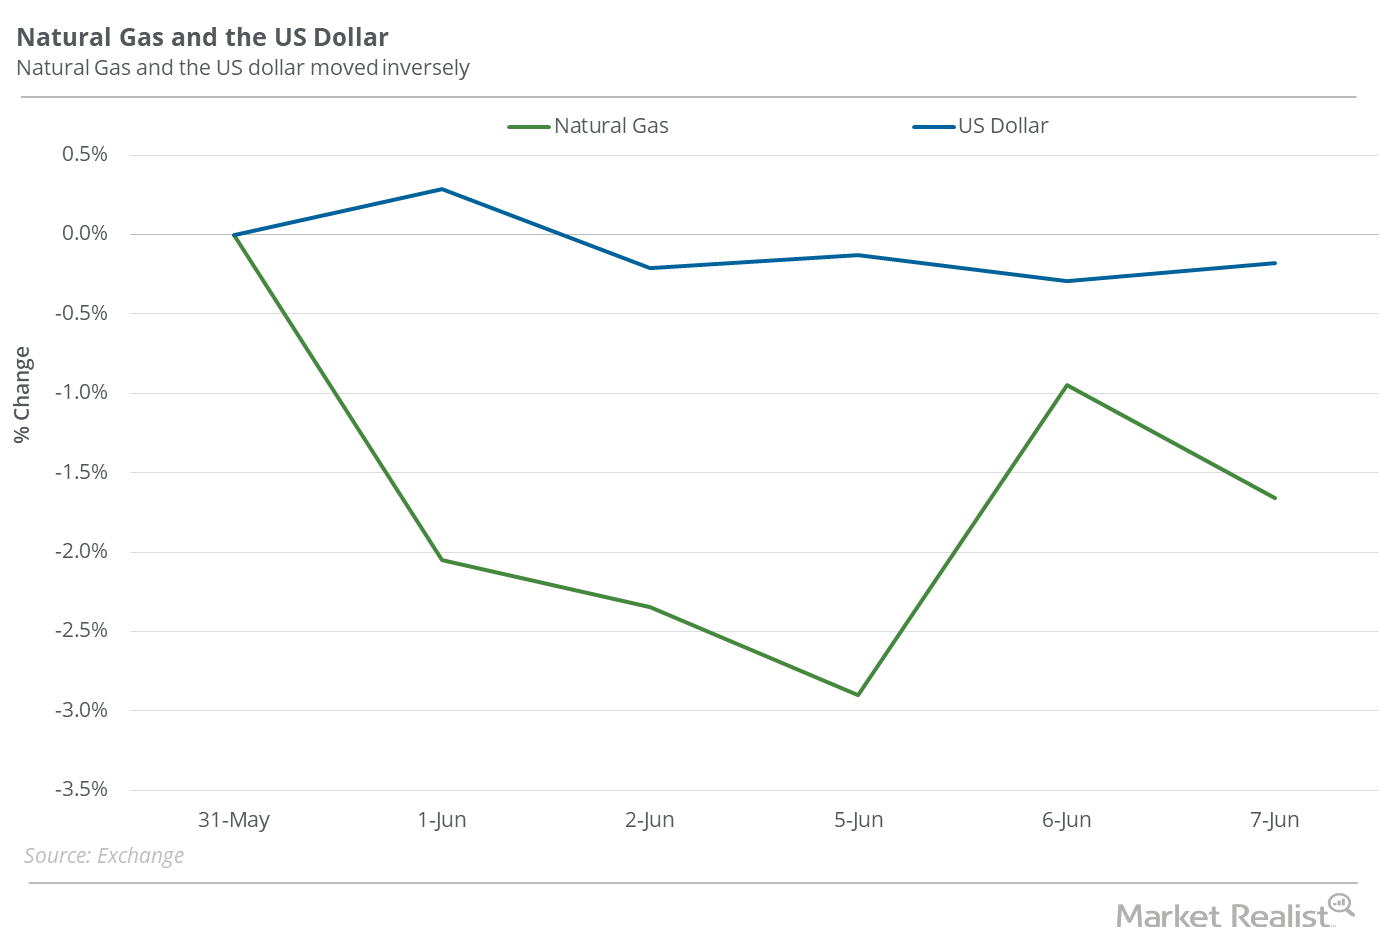
Is Natural Gas Reacting to the US Dollar?
Between March 3, 2016–June 7, 2017, natural gas active futures rose 84.1% while the US dollar fell 0.8%.
Chart in Focus: The Natural Gas Inventory Spread
Between January 27–June 7, 2017, natural gas active futures fell 10.9%. Natural gas inventories moved above their five-year average in the week ended January 27, 2017.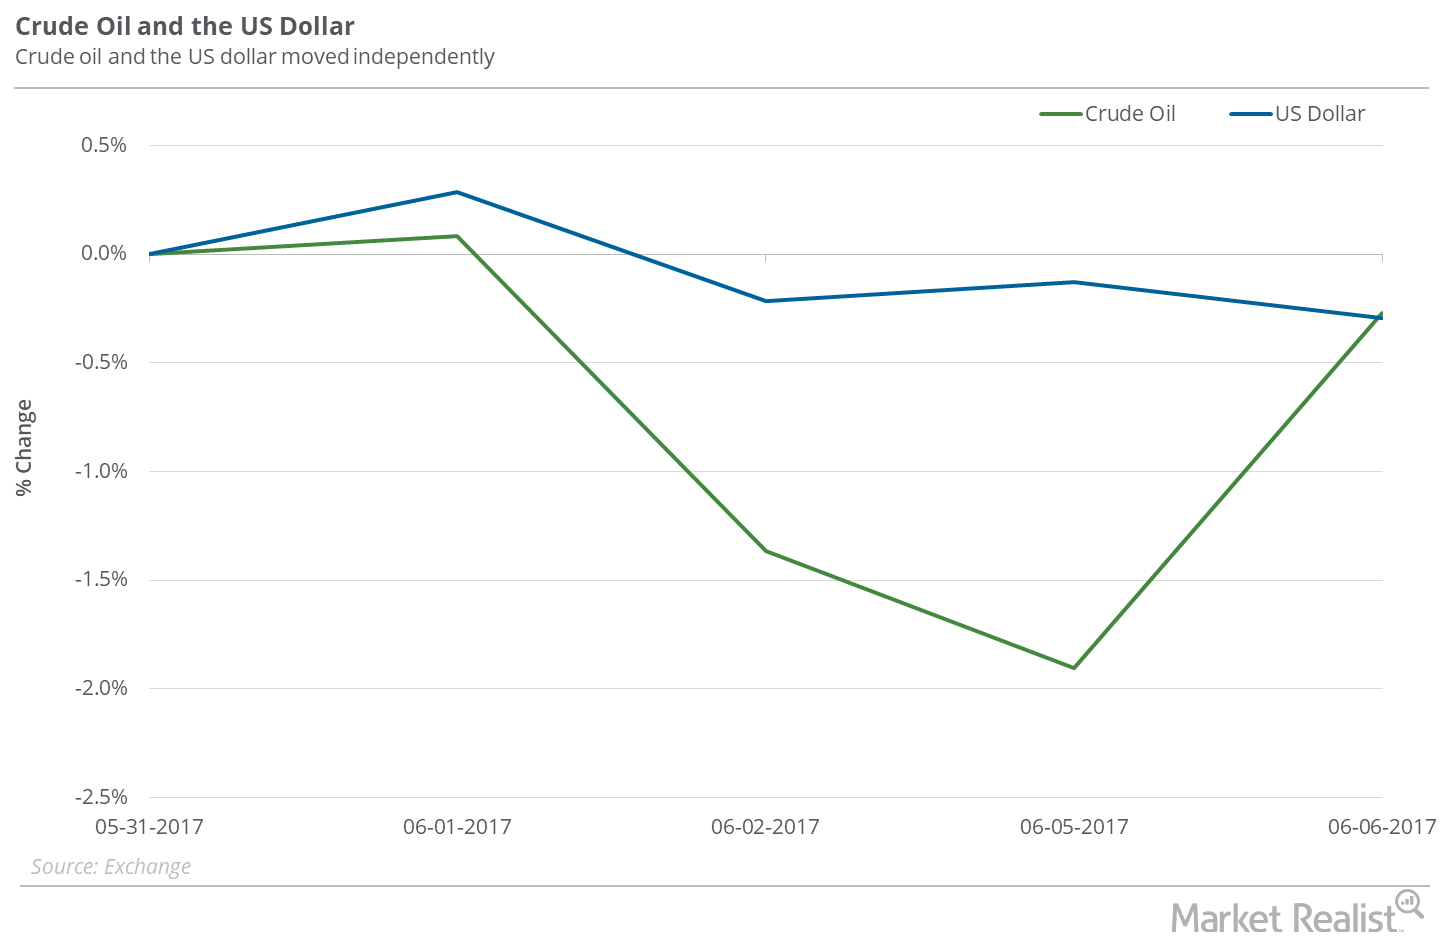
Is Crude Oil Ignoring the Falling Dollar?
Between May 30 and June 6, 2017, the US dollar (UUP) (USDU) (UDN) fell 0.7%, and crude oil (USO) (OIIL) July futures fell 3%.
Is the US Dollar a Factor in Natural Gas’s Current Downturn?
The US dollar (UUP) (UDN) (USDU) fell 0.3% between May 24 and May 31, 2017.
Why the Inventory Spread Could Make Natural Gas Bulls Happy
On a week-over-week basis, natural gas inventories rose by 75 Bcf (billion cubic feet) and were at 2,444 Bcf for the week ended May 19, 2017.
Is the US Dollar Impacting Oil’s Downturn?
In the trailing week, the US dollar fell 0.1%. Despite a fall in the US dollar, crude oil July futures fell 3.5% between May 23 and May 30, 2017.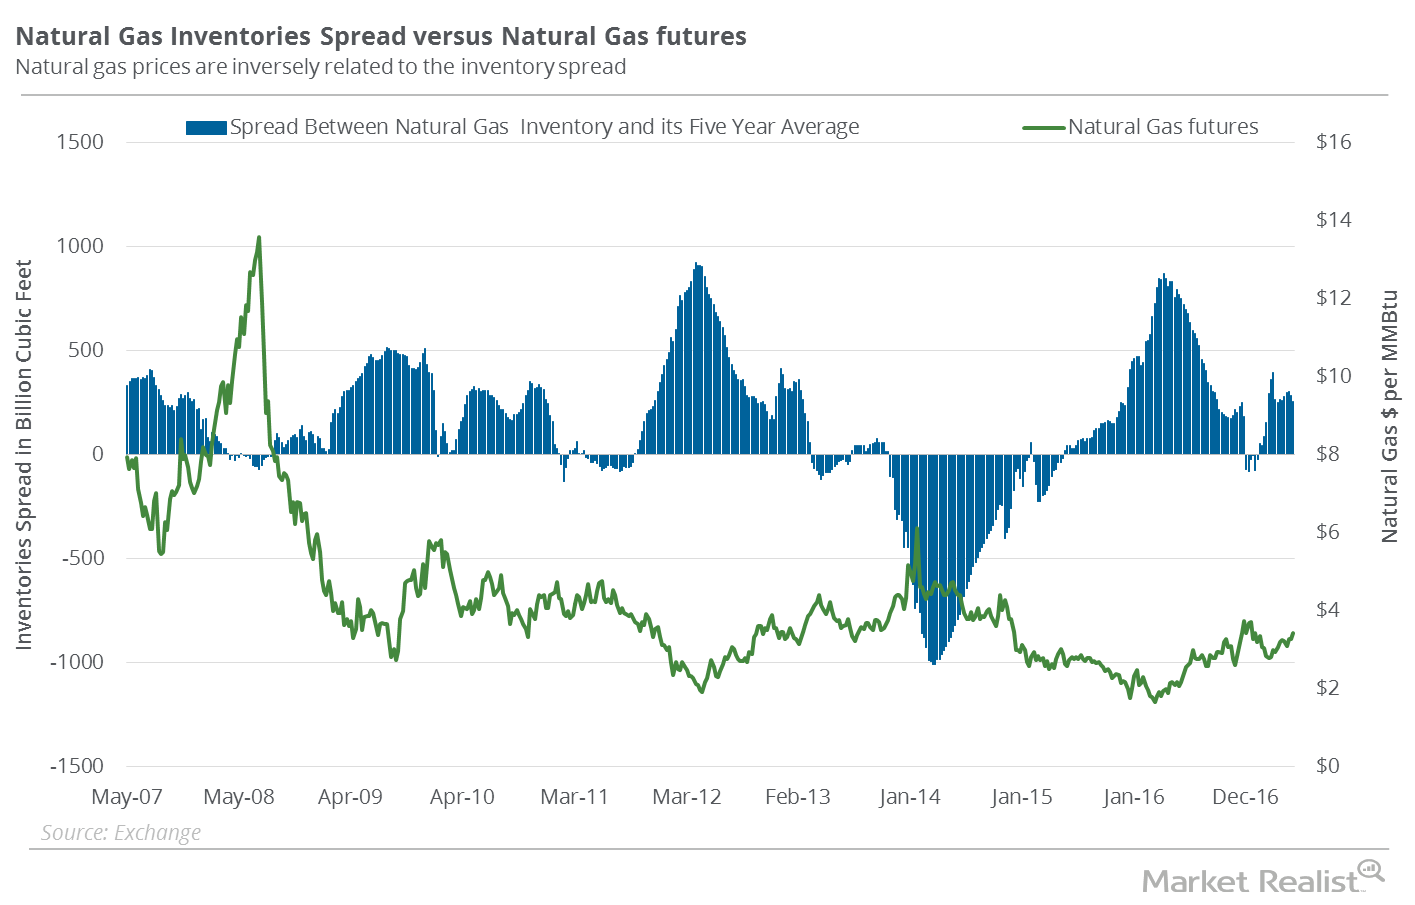
Natural Gas Inventory Spread Is Falling: Will Gas Prices Soar?
According to EIA data announced on May 18, there was an addition of 68 Bcf to natural gas (GASX) (FCG) (GASL) inventories for the week ending May 12, 2017.
Is the Natural Gas Inventory Spread Optimistic?
According to data from the EIA on May 4, natural gas (GASX) (FCG) (GASL) inventories rose by 67 Bcf (billion cubic feet) during the week ending April 28.
The Natural Gas Inventory Spread: Another Bearish Indicator?
According to data from the EIA released on April 27, 2017, natural gas inventories rose 74 Bcf (billion cubic feet) during the week ended April 21, 2017.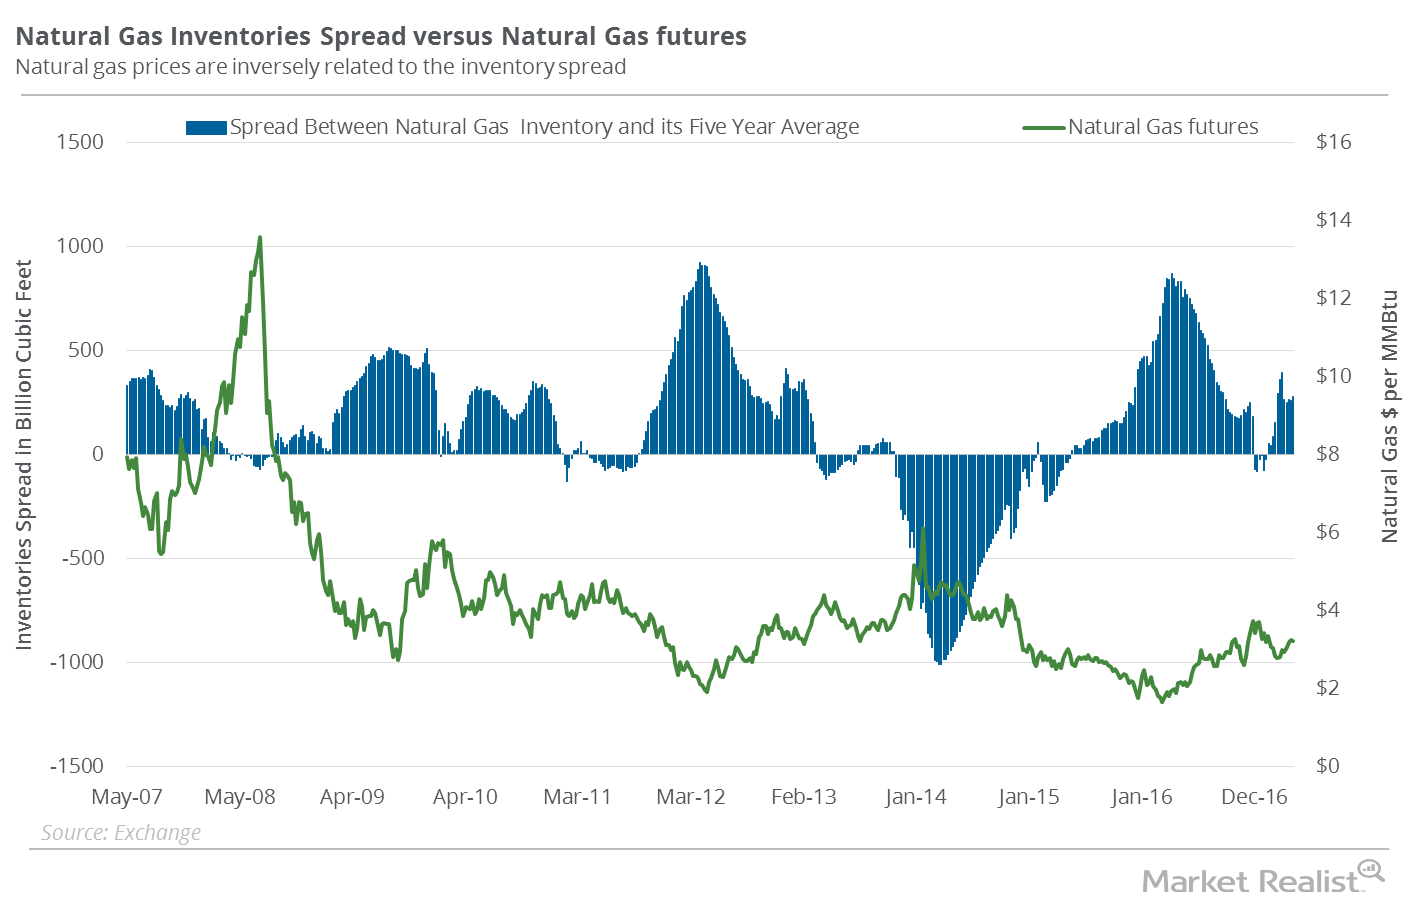
Natural Gas Inventories Spread: What Investors Should Know
According to data from the EIA released on April 20, 2017, natural gas (GASX) (FCG) (GASL) inventories rose by 54 Bcf during the week ending April 14, 2017.
Inventories Spread: Will Natural Gas Prices Fall Again?
Natural gas (GASX) (FCG) (GASL) inventories rose by ten Bcf (billion cubic feet) during the week ending April 7, 2017.
Inventories Spread: Why Natural Gas Uptrend Could Be at Risk
According to data from the EIA (U.S. Energy Information Administration) released on March 30, 2017, natural gas inventories fell by 43 Bcf (billion cubic feet) during the week ending March 24, 2017.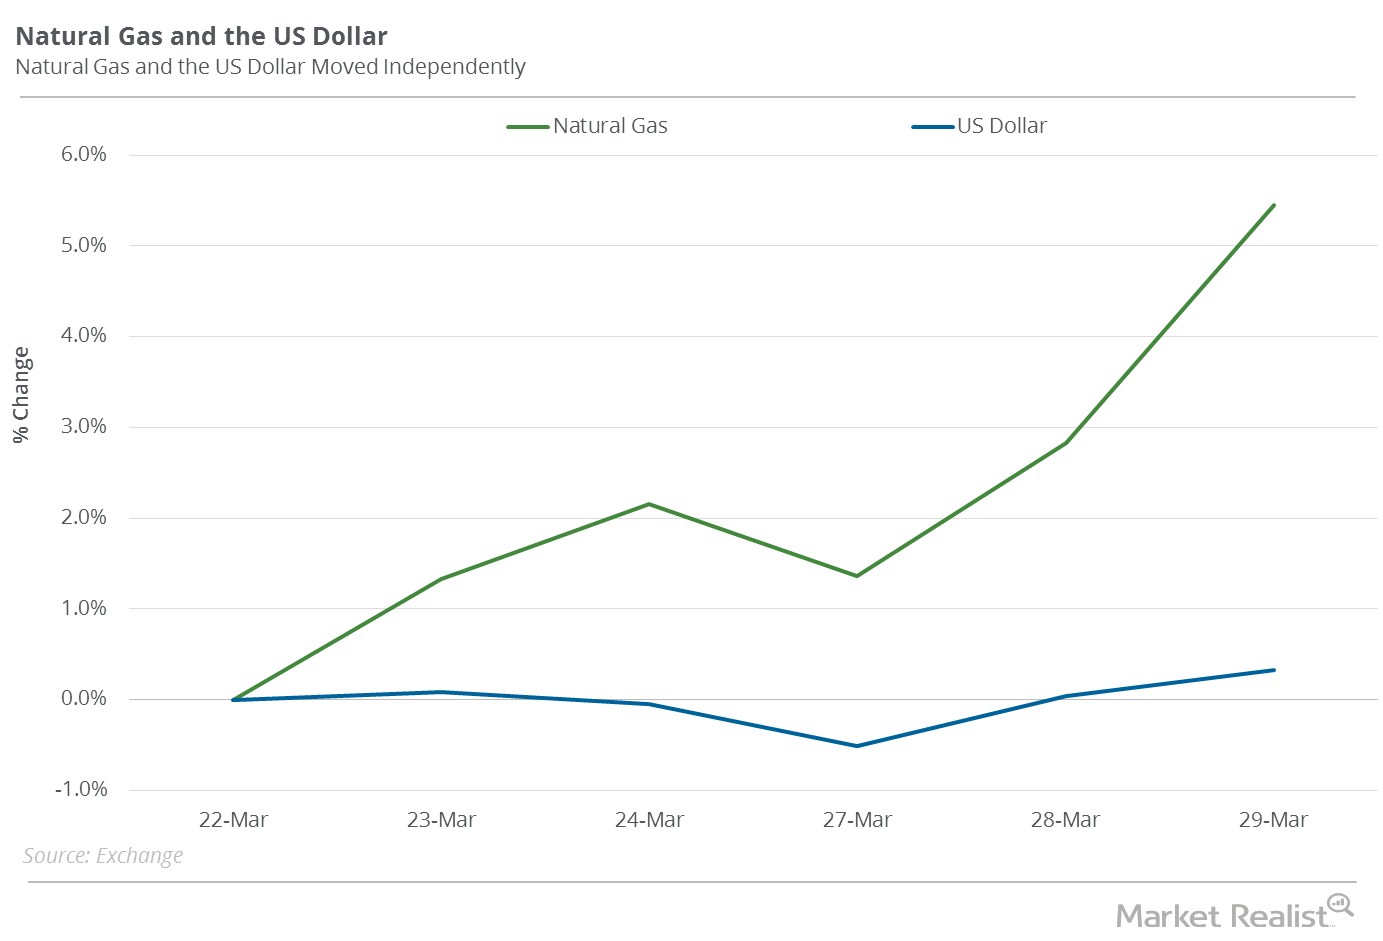
US Dollar Could Impact Natural Gas Prices
Between March 22 and March 29, 2017, natural gas (GASX) (FCG) (GASL) May futures rose 5.4%. The US dollar rose 0.3% during that period.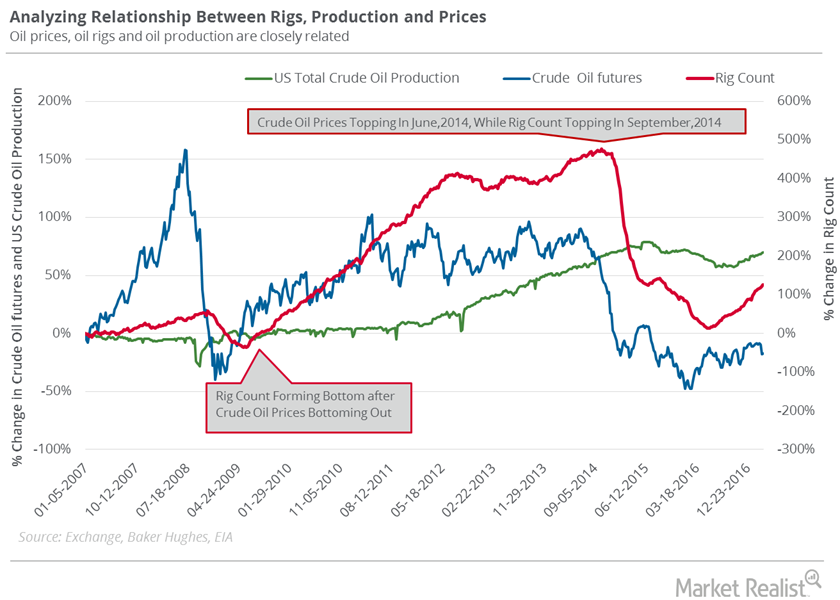
Oil Rig Count and Crude Oil Prices: What’s the Correlation?
The US oil rig count reached 652 in the week ended March 24, 2017. That was a 21-rig rise over the previous week.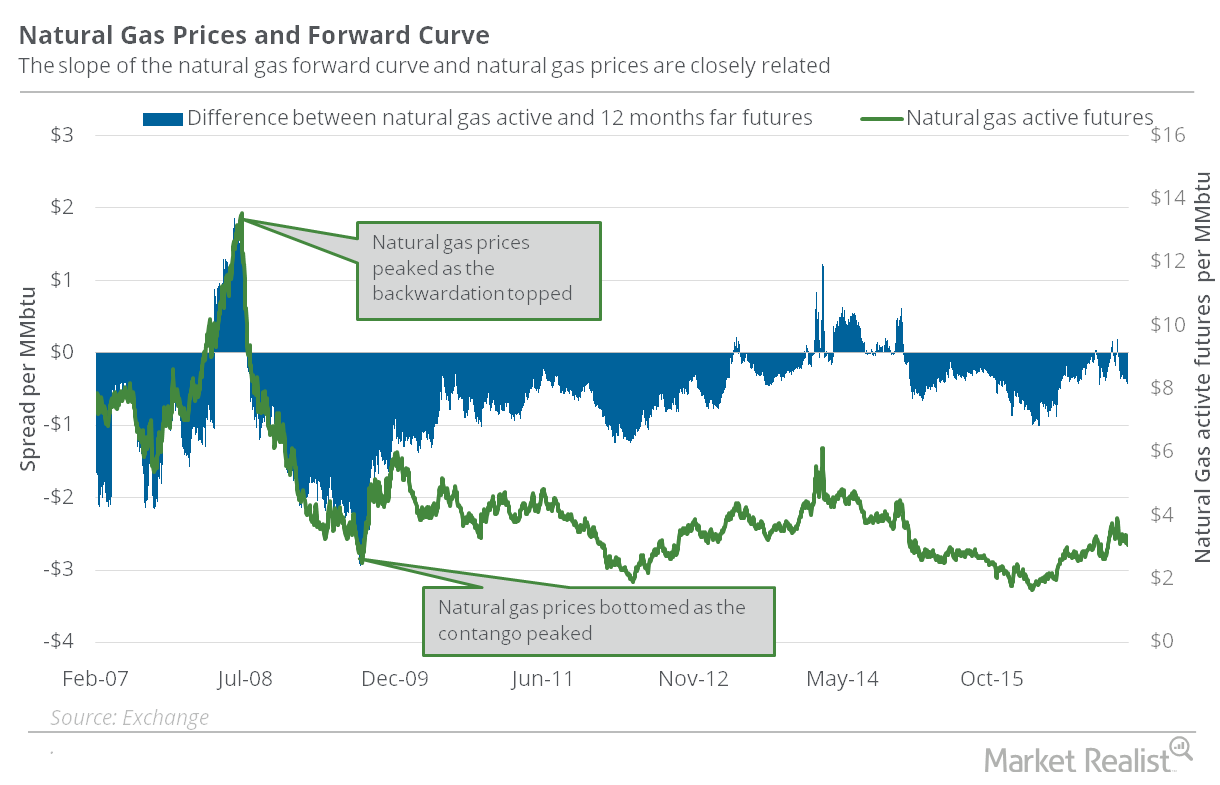
What Contango Could Mean for Natural Gas Traders
Active natural gas futures are currently trading at a discount of $0.56 to the futures contracts 12 months ahead. The situation is called “contango.”
US Non-Farm Payrolls: How Will Crude Oil and Natural Gas React?
US (VFINX) (VOO) non-farm payrolls rose by 227,000 in January 2017, according to the U.S. Bureau of Labor Statistics’ report on February 3, 2017.
Does the US Dollar Impact Natural Gas Prices?
In the past four trading sessions, natural gas futures and the US Dollar Index moved in opposite directions one out of four times.
Will US Non-Farm Payrolls Impact Crude Oil Prices?
US (VFINX) (VOO) non-farm payrolls rose by 161,000 in October 2016, according to the U.S. Bureau of Labor Statistics’ report released on November 4, 2016.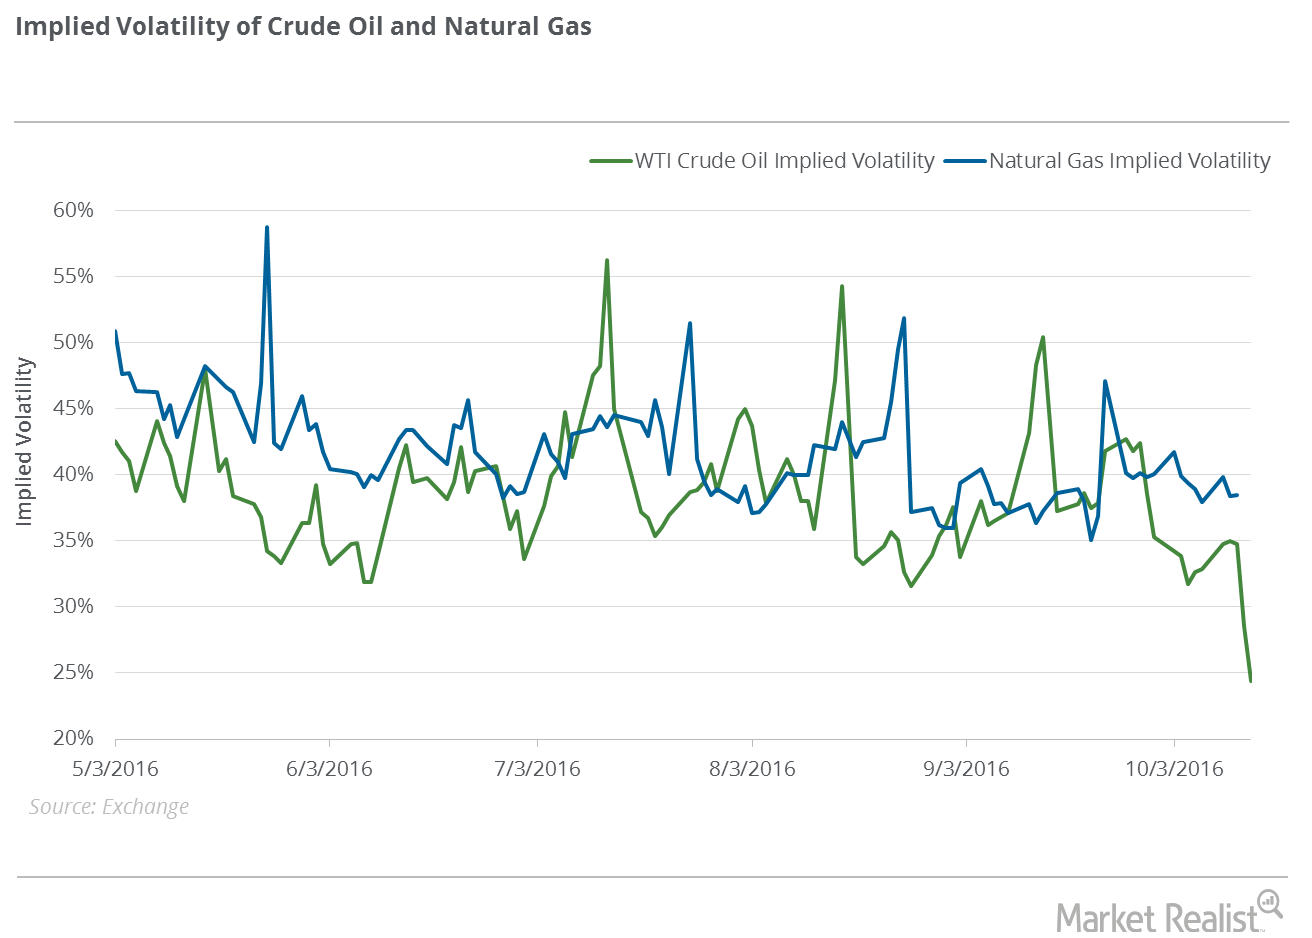
Implied Volatilities: Crude Oil and Natural Gas
Crude oil’s (UWTI) (USO) (OIIL) (USL) (SCO) (DWTI) implied volatility was 24.4% on October 14, 2016. Its 15-day average implied volatility is 36%.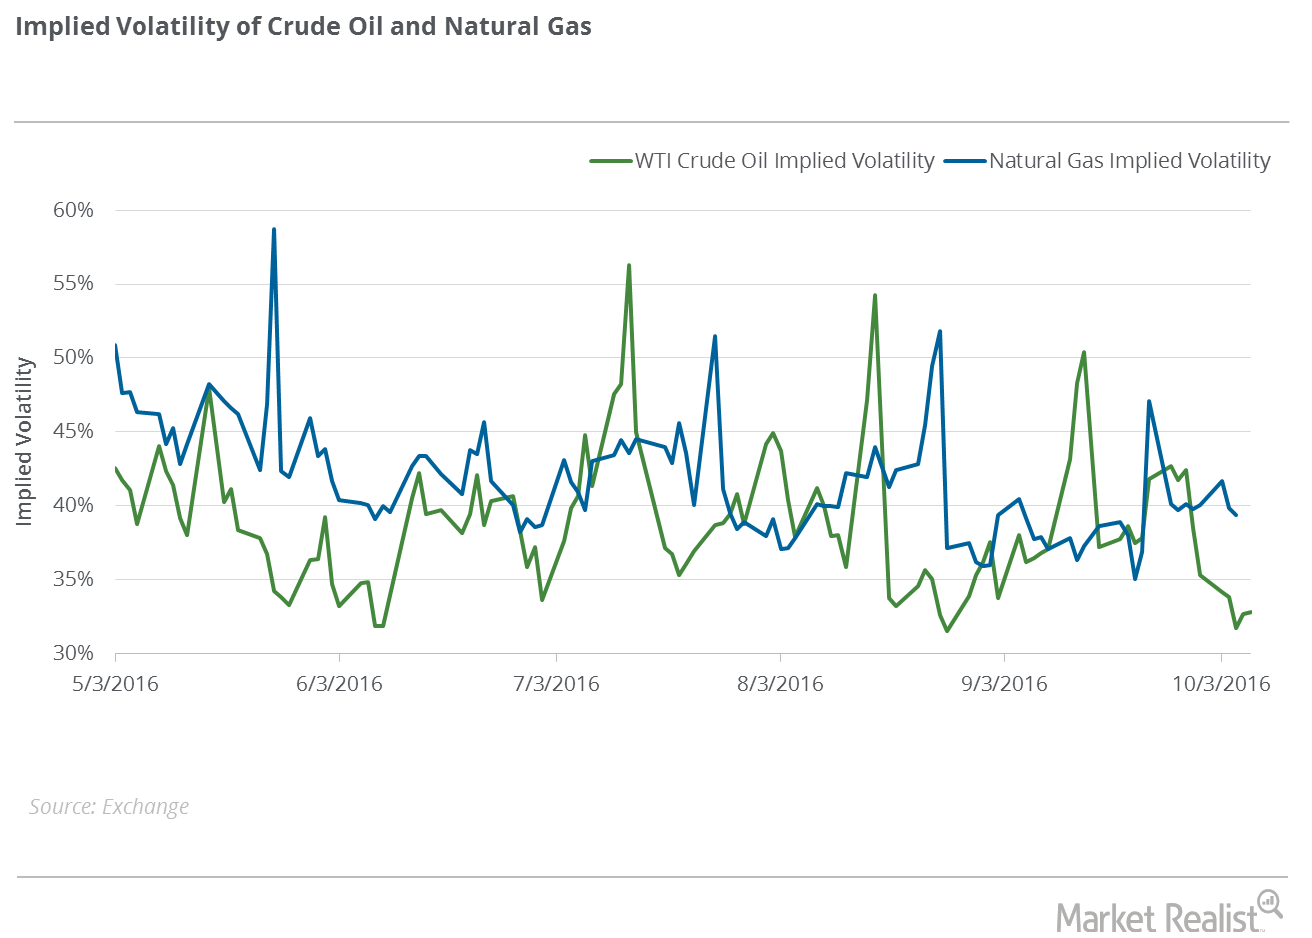
Crude Oil and Natural Gas: Analyzing Implied Volatilities
For natural gas (UNG) (DGAZ) (BOIL) (FCG) (UGAZ) (GASL), its implied volatility was 39.4% on October 7, 2016. Its 15-day average implied volatility is 38.5%.
What Were the Implied Volatilities for Crude Oil and Natural Gas?
Crude oil’s (UWTI) (USO) (OIIL) (USL) (SCO) (DWTI) implied volatility was 35.3% on September 30, 2016.
What’s the Natural Gas Outlook for This Week?
The weather forecast for October 3 to October 9, 2016, indicates that temperatures in the United States could remain higher than the five-year average for the period between October 3 and October 6.
Options Traders: The Implied Volatility of Crude Oil and Natural Gas
Crude oil’s implied volatility was 41.8% on September 23, which is 6.9% above its 15-day average. Its 15-day average implied volatility is 39.1%.
Why the Weather Could Mean Trouble for Natural Gas Bulls
The weather forecast for September 26 to October 2 indicates that temperatures in the US could remain lower than the five-year average for the period.
Analyzing the Implied Volatilities of Crude Oil and Natural Gas
Crude oil’s implied volatility was 37.2% on September 16, 2016. Its 15-day average implied volatility is 38.1%.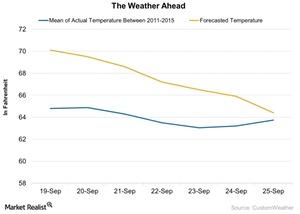
Natural Gas Traders Should Watch This Weather Report
The weather forecast for September 19–25, 2016, indicates that temperatures in the United States could remain higher than the five-year average for the same period.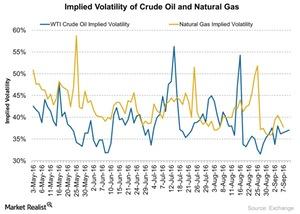
A Look into the Implied Volatilities of Crude Oil and Natural Gas
Crude oil’s implied volatility was 37.1% on September 9, 2016. Its 15-day average implied volatility is 35.1%.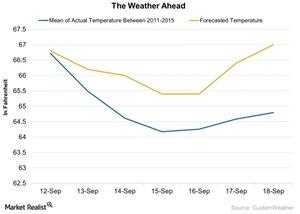
How Weather Could Be a Bullish Catalyst for Natural Gas
The weather forecast for September 12–18, 2016, indicates that US temperatures could remain higher than the five-year average for the same period.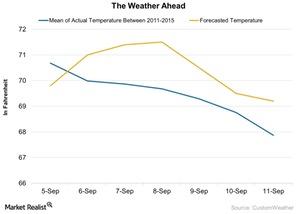
How Could the Weather Impact Natural Gas Prices?
Weather forecasts for September 5–11 indicate that temperatures in the United States could remain higher than the five-year average for the same period, except on September 5.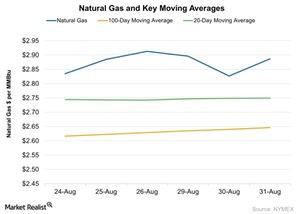
What Does The Price Action in Natural Gas Indicate?
In the last five trading sessions, natural gas October futures have risen by 1.8%. They closed at ~$2.89 per MMBtu on August 31, 2016.
Implied Volatilities of Crude Oil, Natural Gas in Focus
Crude oil’s implied volatility was 31.6% on August 26, 2016. That’s 18% below its 15-day average.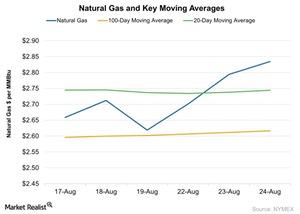
What’s Driving Natural Gas Prices Higher?
Natural gas prices broke above the 20-day moving average on August 23. This indicates short-term bullishness in natural gas prices.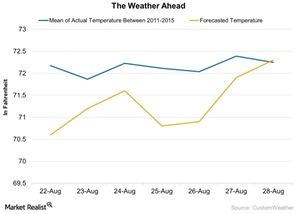
How Will Weather Affect Natural Gas Prices This Week?
Lower temperatures decrease the use of natural gas (UNG) (DGAZ) (BOIL) (FCG) (UGAZ) (GASL) for cooling purposes during the summer.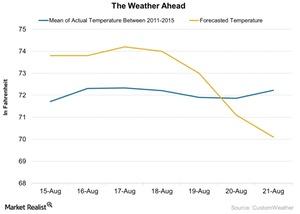
How Will the Weather Impact Natural Gas This Week?
In the week ending August 12, temperatures were higher than the forecast for the week. Natural gas futures fell 6.7% for the week ending on August 12.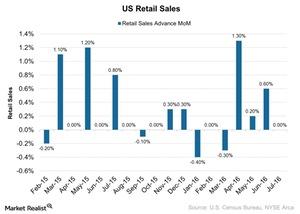
What Do US Retail Sales Data Mean to Crude Oil?
The Market’s expectation of a rate hike could boost the US Dollar Index (UUP)—this could have a negative impact on crude oil prices.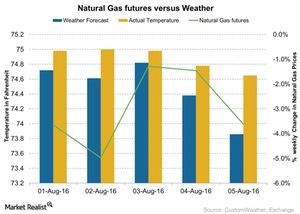
How Weather Could Impact Natural Gas Prices
In the week ended August 5, 2016, temperatures were higher than the forecast for the week. That boosted natural gas prices on August 3.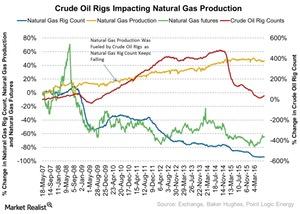
Decoding the Crude Oil Rig Count’s Impact on Natural Gas Prices
On July 29, the US crude oil rig count was 374, which was 3 higher than in the previous week.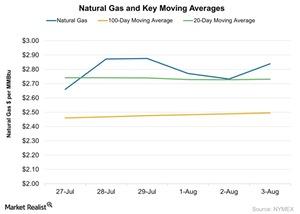
Natural Gas: Key Moving Averages and Price Forecasts
Natural gas futures rose ~3.9% on August 3, 2016, compared to the previous session. The gain was caused by weather reports suggesting hotter weather.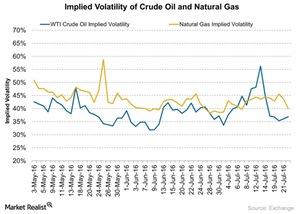
How Volatile Are Natural Gas and Crude Oil?
Natural gas’s (UNG) (GASL) (GASX) implied volatility was 40.0% on July 22, 2016. Its 15-day average implied volatility is 42.5%.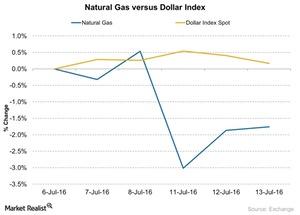
How Does the US Dollar Affect Natural Gas Prices?
Between July 6 and July 13, 2016, natural gas (UNG) (DGAZ) (BOIL) (GASL) (GASX) (DGAZ) (FCG) futures fell by ~1.8%, and the US Dollar Index (UUP) rose by ~0.17%.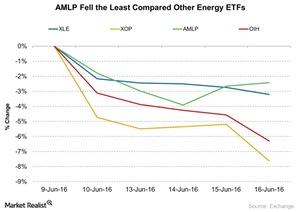
AMLP Fell: Did It Outperform Other Energy ETFs?
The Alerian MLP ETF (AMLP) outperformed other energy ETFs from June 9–16, 2016. Falling crude oil has less of an impact on midstream companies.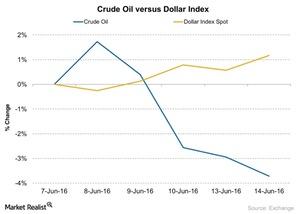
Will the Dollar’s Recovery Affect Crude Oil?
Between June 7 and June 14, 2016, crude oil (USO) fell by ~3.7% while the US dollar index (UUP) rose by around 1.2%.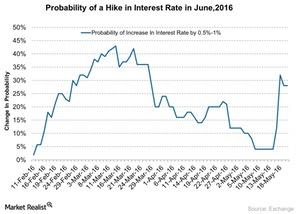
How Did the Consumer Price Index Affect Crude Oil Prices?
The US (SPY) (VOO) CPI (consumer price index) rose 0.4% on a month-over-month basis in April, according to a US Department of Labor report on May 17, 2016.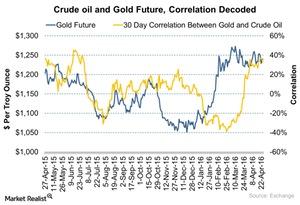
Gold and Crude Oil: How Does the Correlation Work?
Gold (GLD) can be considered an indicator of economic fear and inflation expectations. Driven by these fears, gold gains during equity market turmoil.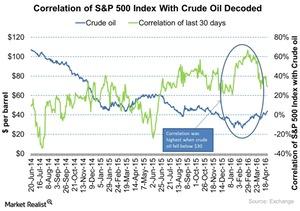
How Are Crude Oil Prices and the S&P 500 Correlated?
Historically, crude oil prices and the S&P 500 index have influenced each other.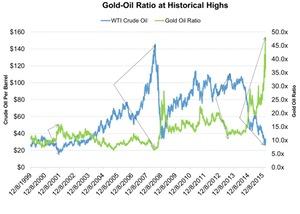
Gold-Oil Ratio Is at a Historic High: Why Isn’t the Bottom Near?
A rise in the ratio can be correlated the corresponding rise in gold prices. An increase in the ratio indicates that gold is more expensive than crude oil.
Moving Average Analysis of Chinese Energy Companies
Chinese energy companies CNOOC, China Petroleum & Chemical, and PetroChina Company have fallen below their 100-day and 20-day moving averages.
